Home > Comparison > Technology > NOW vs ADSK
The strategic rivalry between ServiceNow, Inc. and Autodesk, Inc. shapes the evolution of the technology sector. ServiceNow dominates enterprise cloud workflow automation, while Autodesk leads in 3D design and engineering software. This head-to-head contrasts a cloud-first automation powerhouse against a specialized design software leader. This analysis will clarify which company offers a superior risk-adjusted return, guiding investors seeking durable growth and innovation in their portfolios.
Table of contents
Companies Overview
ServiceNow and Autodesk occupy pivotal roles in the enterprise software landscape, driving innovation in workflow automation and 3D design respectively.
ServiceNow, Inc.: Enterprise Workflow Automation Leader
ServiceNow dominates the enterprise cloud computing sector with its Now platform, automating workflows using AI, machine learning, and robotic process automation. Its revenue stems from subscription-based IT service management, security operations, and customer service management products. In 2026, the firm sharpened its focus on expanding automation capabilities through strategic partnerships, notably with Celonis, to optimize enterprise process efficiency.
Autodesk, Inc.: 3D Design and Engineering Software Innovator
Autodesk leads in 3D design, engineering, and construction software, selling solutions like AutoCAD, BIM 360, and Fusion 360. Its revenue base relies on subscriptions for design, drafting, and cloud-based construction management tools. In 2026, Autodesk prioritized cloud integration and cross-industry collaboration, enhancing its software suite to support architecture, manufacturing, and media production workflows.
Strategic Collision: Similarities & Divergences
Both companies leverage subscription models in the software application sector but diverge in focus: ServiceNow drives automation within enterprise operations while Autodesk pioneers 3D design innovation. Their primary battleground lies in digital transformation tools for enterprises. ServiceNow’s strength is workflow automation; Autodesk’s lies in creative design software. Each offers distinct investment profiles shaped by unique market niches and growth trajectories.
Income Statement Comparison
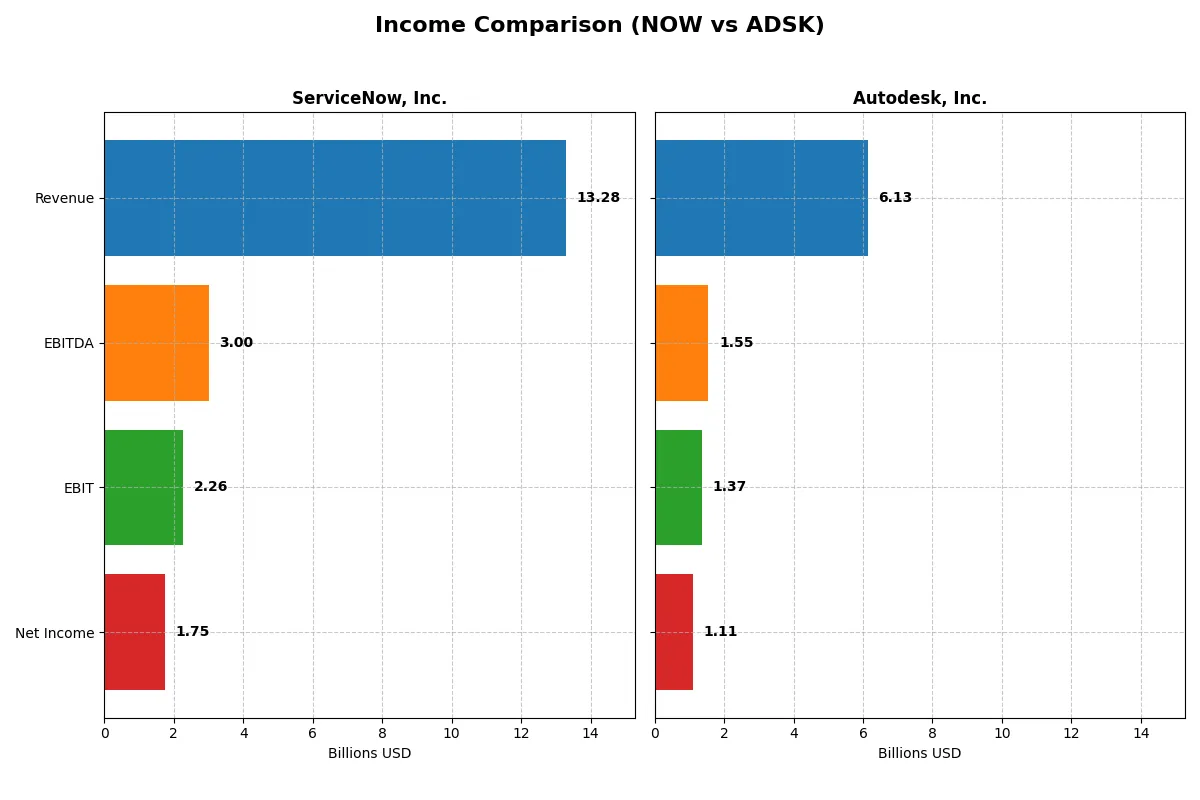
This data dissects the core profitability and scalability of both corporate engines to reveal who dominates the bottom line:
| Metric | ServiceNow, Inc. (NOW) | Autodesk, Inc. (ADSK) |
|---|---|---|
| Revenue | 13.3B | 6.1B |
| Cost of Revenue | 3.0B | 578M |
| Operating Expenses | 8.5B | 4.2B |
| Gross Profit | 10.3B | 5.6B |
| EBITDA | 3.0B | 1.5B |
| EBIT | 2.3B | 1.4B |
| Interest Expense | 0 | 0 |
| Net Income | 1.7B | 1.1B |
| EPS | 1.69 | 5.17 |
| Fiscal Year | 2025 | 2025 |
Income Statement Analysis: The Bottom-Line Duel
The upcoming income statement comparison reveals which company drives superior efficiency through revenue growth, margin strength, and net income performance.
ServiceNow, Inc. Analysis
ServiceNow’s revenue surged from 5.9B in 2021 to 13.3B in 2025, with net income expanding from 230M to 1.75B. The company maintains a robust gross margin above 77% and a net margin improving to 13.16%. In 2025, its 21.9% EPS growth and 28.4% EBIT growth demonstrate strong operational momentum and disciplined cost management.
Autodesk, Inc. Analysis
Autodesk’s revenue grew steadily from 3.8B in 2021 to 6.1B in 2025, while net income declined from 1.21B to 1.11B over the same period. It commands an excellent 90.6% gross margin and a net margin of 18.14%. The 2025 year shows solid revenue and EBIT growth (12.7% and 20.5%), with EPS rising 22.2%, but overall net income and margin trends over five years are weaker.
Growth Momentum vs. Margin Excellence
ServiceNow outpaces Autodesk in revenue and net income growth, showcasing expanding margins and accelerating EPS gains. Autodesk leads in margin efficiency but faces net income erosion over five years. For investors prioritizing growth and improving profitability, ServiceNow’s dynamic trajectory appears more compelling.
Financial Ratios Comparison
These vital ratios act as a diagnostic tool to expose the underlying fiscal health, valuation premiums, and capital efficiency of companies under review:
| Ratios | ServiceNow, Inc. (NOW) | Autodesk, Inc. (ADSK) |
|---|---|---|
| ROE | 13.5% | 42.4% |
| ROIC | 9.0% | 18.0% |
| P/E | 90.9 | 60.2 |
| P/B | 12.3 | 25.5 |
| Current Ratio | 0.95 | 0.68 |
| Quick Ratio | 0.95 | 0.68 |
| D/E | 0.25 | 0.98 |
| Debt-to-Assets | 12.3% | 23.6% |
| Interest Coverage | 0 | 0 |
| Asset Turnover | 0.51 | 0.57 |
| Fixed Asset Turnover | 4.29 | 21.44 |
| Payout ratio | 0 | 0 |
| Dividend yield | 0 | 0 |
| Fiscal Year | 2025 | 2025 |
Efficiency & Valuation Duel: The Vital Signs
Ratios serve as a company’s DNA, exposing hidden risks and operational prowess that shape investor outcomes.
ServiceNow, Inc.
ServiceNow shows moderate profitability with a 13.5% ROE and a 13.2% net margin, signaling stable core operations. However, its valuation is stretched, with a high P/E of 90.9 and P/B at 12.3, indicating premium pricing. The company favors reinvestment over dividends, prioritizing R&D to fuel growth.
Autodesk, Inc.
Autodesk delivers superior profitability, posting a robust 42.4% ROE and an 18.1% net margin, reflecting operational efficiency. Despite a lower P/E of 60.2 relative to ServiceNow, the P/B ratio sits at an elevated 25.5, suggesting valuation concerns. Autodesk also forgoes dividends, reinvesting heavily in innovation and growth initiatives.
Premium Valuation vs. Operational Efficiency
ServiceNow carries a pricier valuation but maintains balanced risk with moderate returns. Autodesk excels in profitability but faces valuation headwinds and liquidity concerns. Investors seeking growth combined with efficiency may lean toward Autodesk, while those preferring steadier fundamentals might find ServiceNow more fitting.
Which one offers the Superior Shareholder Reward?
ServiceNow and Autodesk both forgo dividends, instead reinvesting heavily to fuel growth. I note ServiceNow’s zero dividend yield and payout ratio, relying solely on buybacks to reward shareholders. Autodesk also pays no dividends but executes a more intense buyback program, reflected in its substantial free cash flow per share of 7 vs. ServiceNow’s 4.4. Autodesk’s superior operating margins (22% vs. ServiceNow’s 17%) and more efficient capital allocation hint at a more sustainable growth and buyback-driven shareholder return. I conclude Autodesk offers the more attractive total return profile in 2026.
Comparative Score Analysis: The Strategic Profile
The radar chart reveals the fundamental DNA and trade-offs of both firms, highlighting their financial strengths and valuation challenges:
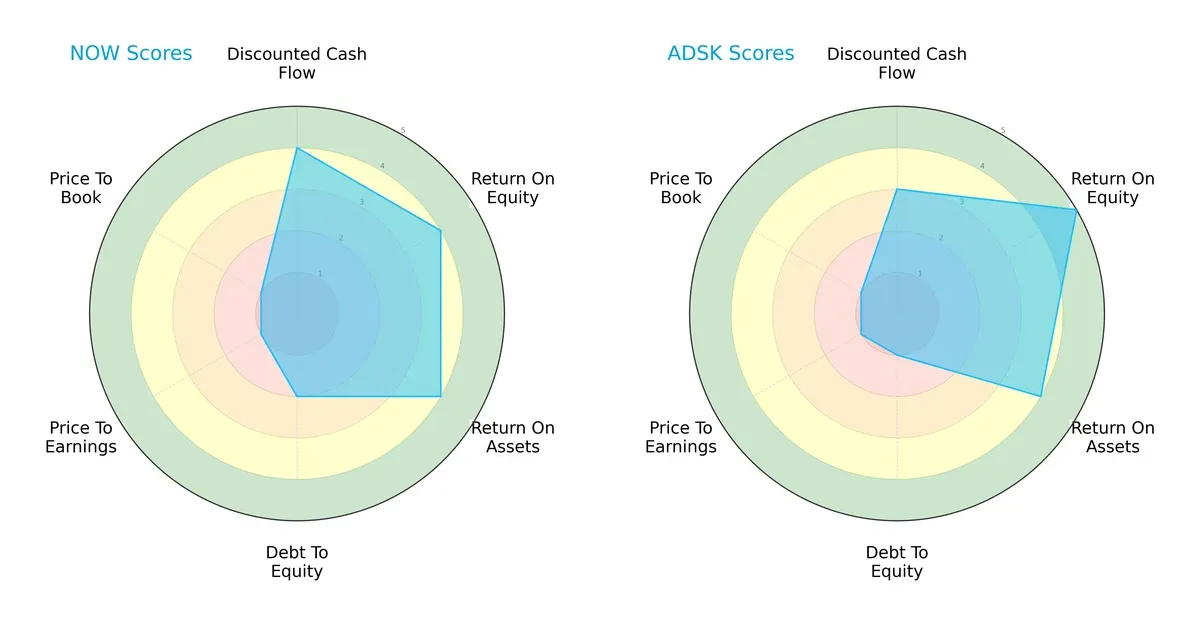
ServiceNow scores higher in discounted cash flow with a favorable ROE and ROA, reflecting efficient asset use and profit generation. Autodesk boasts a superior ROE but carries heavier debt, indicated by a weaker debt-to-equity score. Both face valuation headwinds with low P/E and P/B scores. ServiceNow presents a more balanced risk profile, while Autodesk leans on operational efficiency amid financial leverage.
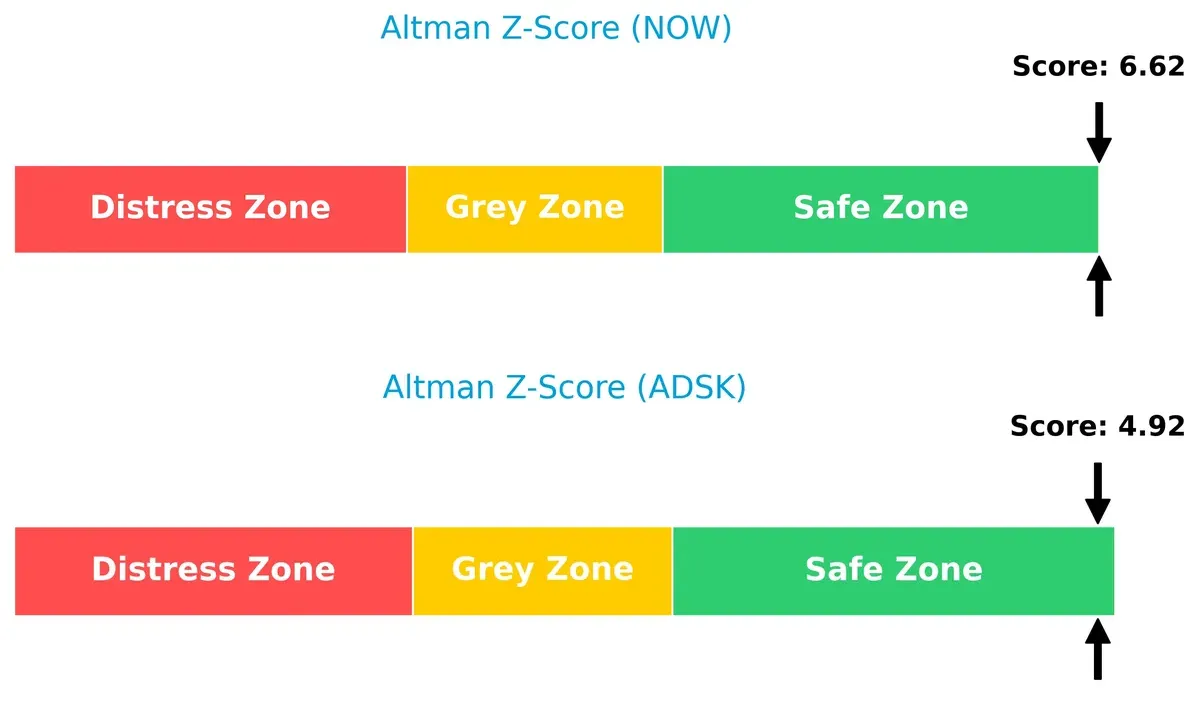
Bankruptcy Risk: Solvency Showdown
The Altman Z-Score gap shows both companies in the safe zone, with ServiceNow’s 6.6 score indicating stronger solvency resilience than Autodesk’s 4.9, signaling greater long-term stability:
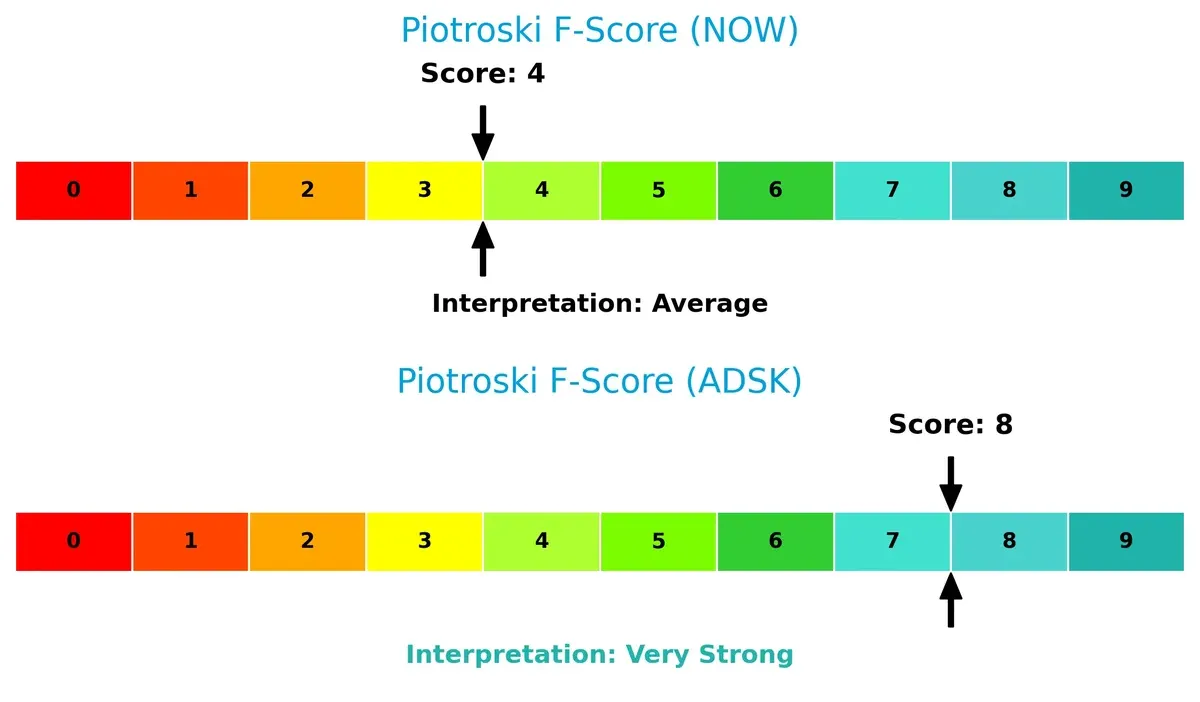
Financial Health: Quality of Operations
Autodesk’s Piotroski F-Score of 8 suggests robust financial health, outperforming ServiceNow’s average score of 4. This disparity highlights ServiceNow’s internal metric concerns versus Autodesk’s operational strength:
How are the two companies positioned?
This section dissects the operational DNA of ServiceNow and Autodesk by comparing their revenue distribution and internal dynamics. The goal is to confront their economic moats and identify which model delivers the most resilient, sustainable competitive advantage today.
Revenue Segmentation: The Strategic Mix
This visual comparison dissects how ServiceNow and Autodesk diversify their income streams and where their primary sector bets lie:
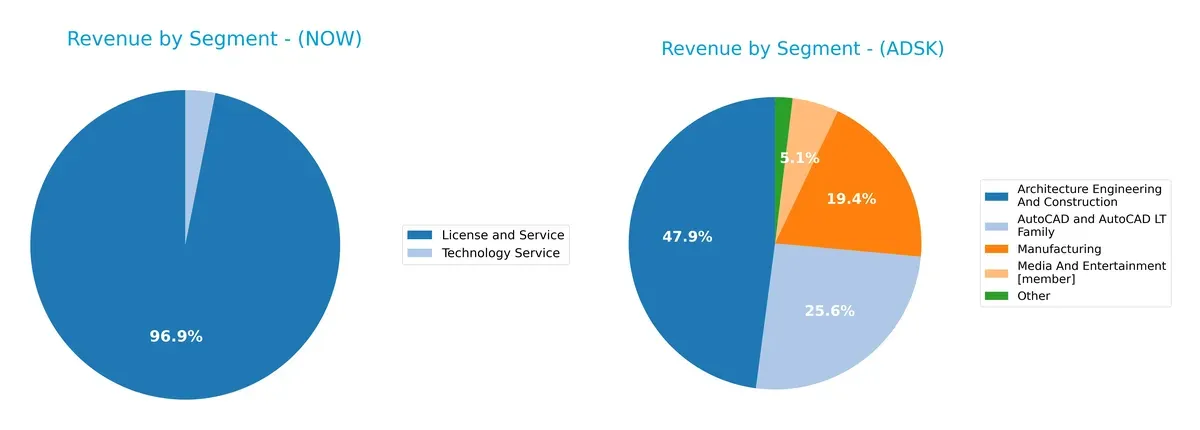
ServiceNow’s revenue pivots heavily on License and Service, totaling $12.9B in 2025, with Technology Service trailing at $414M. Autodesk displays a more diversified mix: Architecture Engineering and Construction leads at $2.94B, followed by AutoCAD at $1.57B, Manufacturing at $1.19B, and smaller segments rounding out the rest. ServiceNow’s concentration signals robust ecosystem lock-in but heightens concentration risk. Autodesk’s spread cushions it against sector-specific downturns.
Strengths and Weaknesses Comparison
This table compares the strengths and weaknesses of ServiceNow and Autodesk based on diversification, profitability, financial statements, innovation, global presence, and market share:
ServiceNow Strengths
- Strong revenue growth in License and Service segments
- Favorable debt-to-equity and interest coverage ratios
- Balanced global presence with significant North America and EMEA sales
- Favorable fixed asset turnover indicating efficient asset use
Autodesk Strengths
- Higher net margin and ROE indicating superior profitability
- Favorable ROIC above WACC showing value creation
- Diverse product portfolio across industries like AEC and manufacturing
- Strong fixed asset turnover and favorable debt-to-assets ratio
ServiceNow Weaknesses
- High P/E and P/B ratios reflect expensive valuation
- Current ratio below 1 signals liquidity concerns
- Zero dividend yield limits income appeal
- ROE and ROIC only neutral versus cost of capital
- Moderate asset turnover suggests room for operational improvement
Autodesk Weaknesses
- Unfavorable current and quick ratios indicate liquidity pressure
- High P/B ratio suggests overvaluation risk
- WACC above ROIC may signal capital inefficiency
- Zero dividend yield reduces income attractiveness
- High debt-to-equity ratio raises leverage concerns
ServiceNow shows solid leverage management and global footprint but faces valuation and liquidity challenges. Autodesk excels in profitability and product diversification, yet its liquidity and capital costs warrant caution. These insights highlight differing strategic priorities and financial profiles.
The Moat Duel: Analyzing Competitive Defensibility
A structural moat protects long-term profits from competition erosion, making it the cornerstone of sustainable corporate value creation:
ServiceNow, Inc.: Workflow Automation Switching Costs
ServiceNow’s moat stems from high switching costs embedded in its enterprise workflow platform. Its slightly favorable ROIC trend signals improving profitability but still trails WACC. Expansion into AI-enhanced automation could deepen this advantage in 2026.
Autodesk, Inc.: High-Margin Product Ecosystem
Autodesk’s moat relies on a high-margin design software suite with strong customer lock-in. Its ROIC exceeds WACC by 7.6%, reflecting value creation and durable profitability. Continued cloud and AI integration will likely sustain growth and market control.
Workflow Automation vs. Product Ecosystem: The Moat Showdown
Autodesk possesses a deeper moat, evidenced by robust ROIC spread and margin stability. ServiceNow shows promise but currently sheds value relative to capital costs. Autodesk is better positioned to defend market share amid intensifying tech competition.
Which stock offers better returns?
The past year reveals contrasting dynamics: ServiceNow’s shares fell sharply while Autodesk’s edged slightly higher, both showing decelerating trends amid fluctuating trading volumes.
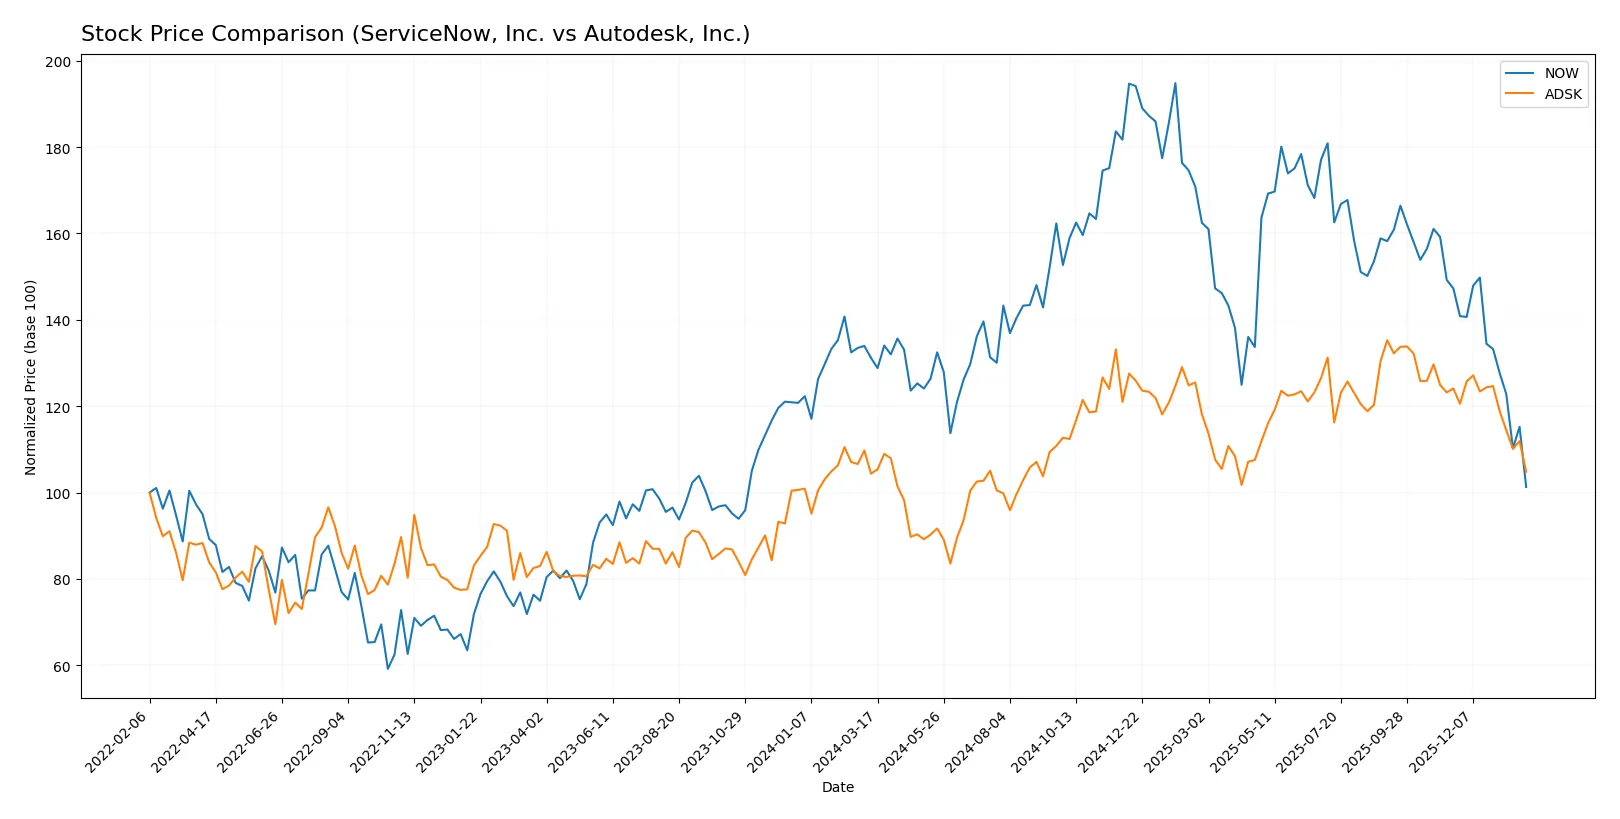
Trend Comparison
ServiceNow, Inc. experienced a bearish trend over 12 months with a -22.79% price decline, decelerating losses, and high volatility reflected in a 24.31 std deviation. The stock peaked at 225 and bottomed at 117.
Autodesk, Inc. showed a mild bullish trend with a 0.4% gain over the same period, also decelerating. It exhibited greater volatility (29.89 std deviation), hitting a high of 326.37 and a low of 201.6.
Comparing both, Autodesk delivered the highest market performance with a slight positive return, while ServiceNow suffered significant declines, reflecting weaker investor sentiment.
Target Prices
Analysts present a wide range of target prices, reflecting varied outlooks on these software leaders.
| Company | Target Low | Target High | Consensus |
|---|---|---|---|
| ServiceNow, Inc. | 115 | 1,315 | 440.14 |
| Autodesk, Inc. | 343 | 400 | 373 |
ServiceNow’s consensus target stands nearly four times above its current price of 117, signaling high growth expectations but also notable valuation risk. Autodesk’s target consensus at 373 also suggests substantial upside from its 253 price, albeit with a narrower range indicating more analyst agreement.

Don’t Let Luck Decide Your Entry Point
Optimize your entry points with our advanced ProRealTime indicators. You’ll get efficient buy signals with precise price targets for maximum performance. Start outperforming now!
How do institutions grade them?
Here is a comparison of the latest institutional grades for ServiceNow, Inc. and Autodesk, Inc.:
ServiceNow, Inc. Grades
The following table shows recent grades from leading financial institutions for ServiceNow, Inc.:
| Grading Company | Action | New Grade | Date |
|---|---|---|---|
| Citigroup | Maintain | Buy | 2026-01-30 |
| Keybanc | Maintain | Underweight | 2026-01-29 |
| DA Davidson | Maintain | Buy | 2026-01-29 |
| Cantor Fitzgerald | Maintain | Overweight | 2026-01-29 |
| RBC Capital | Maintain | Outperform | 2026-01-29 |
| Stifel | Maintain | Buy | 2026-01-29 |
| Evercore ISI Group | Maintain | Outperform | 2026-01-29 |
| Macquarie | Maintain | Neutral | 2026-01-29 |
| BTIG | Maintain | Buy | 2026-01-29 |
| Needham | Maintain | Buy | 2026-01-29 |
Autodesk, Inc. Grades
Below are the most recent grades provided by reputable institutions for Autodesk, Inc.:
| Grading Company | Action | New Grade | Date |
|---|---|---|---|
| Macquarie | Maintain | Outperform | 2025-11-26 |
| BMO Capital | Maintain | Market Perform | 2025-11-26 |
| Wells Fargo | Maintain | Overweight | 2025-11-26 |
| Deutsche Bank | Upgrade | Buy | 2025-11-26 |
| Rosenblatt | Maintain | Buy | 2025-11-26 |
| Baird | Maintain | Outperform | 2025-11-26 |
| B of A Securities | Maintain | Neutral | 2025-11-26 |
| Barclays | Maintain | Overweight | 2025-11-26 |
| Rosenblatt | Maintain | Buy | 2025-11-24 |
| Baird | Maintain | Outperform | 2025-11-18 |
Which company has the best grades?
ServiceNow, Inc. holds consistently strong ratings, with multiple Buy and Outperform grades from major firms. Autodesk, Inc. also receives predominantly positive grades, including several Outperform and Buy ratings. ServiceNow’s more recent updates may offer fresher market sentiment insights. Investors should weigh these grade patterns carefully alongside other factors.
Risks specific to each company
The following categories identify critical pressure points and systemic threats facing ServiceNow, Inc. and Autodesk, Inc. in the 2026 market environment:
1. Market & Competition
ServiceNow, Inc.
- Faces intense competition in enterprise cloud and workflow automation with pressure on pricing and innovation.
Autodesk, Inc.
- Operates in a highly competitive 3D design and engineering software market, challenged by rapid tech shifts and new entrants.
2. Capital Structure & Debt
ServiceNow, Inc.
- Maintains low debt-to-equity ratio (0.25), signifying conservative leverage and financial stability.
Autodesk, Inc.
- Carries higher leverage (D/E 0.98), increasing financial risk amid rising interest rates and economic uncertainty.
3. Stock Volatility
ServiceNow, Inc.
- Exhibits moderate beta at 0.98, indicating stock volatility aligns closely with the broader market.
Autodesk, Inc.
- Shows elevated beta of 1.47, implying greater share price swings and higher risk exposure.
4. Regulatory & Legal
ServiceNow, Inc.
- Subject to data privacy and cloud service regulations that could increase compliance costs.
Autodesk, Inc.
- Faces regulatory scrutiny related to software licensing and export controls impacting global markets.
5. Supply Chain & Operations
ServiceNow, Inc.
- Software delivery model reduces supply chain risks but depends heavily on data center infrastructure.
Autodesk, Inc.
- Relies on cloud infrastructure and third-party services, vulnerable to tech disruptions and service outages.
6. ESG & Climate Transition
ServiceNow, Inc.
- Increasing pressure to demonstrate sustainable cloud operations and reduce carbon footprint.
Autodesk, Inc.
- Faces rising demand for environmentally responsible product lifecycle management and green software solutions.
7. Geopolitical Exposure
ServiceNow, Inc.
- Exposure to US-China tensions affecting enterprise IT spending and cross-border data flows.
Autodesk, Inc.
- Global operations risk disruption from geopolitical conflicts and trade restrictions on technology exports.
Which company shows a better risk-adjusted profile?
ServiceNow’s conservative leverage and moderate stock volatility offer a more stable risk profile. Autodesk’s higher debt and volatility elevate its financial and market risks. ServiceNow also maintains a stronger liquidity stance, though both firms face significant market competition. Autodesk’s high Piotroski score signals financial strength but carries amplified risk from capital structure and regulatory pressures. Overall, ServiceNow shows a better risk-adjusted profile in 2026, balancing growth and prudence more effectively.
Final Verdict: Which stock to choose?
ServiceNow’s superpower lies in its impressive income growth and rising profitability, reflecting a company steadily improving operational efficiency. Its point of vigilance is a below-par current ratio, suggesting liquidity constraints that merit attention. It fits well in aggressive growth portfolios ready to tolerate some balance sheet risk for long-term rewards.
Autodesk boasts a durable competitive moat, demonstrated by a strong ROIC well above its WACC and robust returns on equity. Its safety profile is more mixed due to leverage concerns and a weaker liquidity position but benefits from consistent cash flow generation. It suits GARP investors seeking stable growth with an emphasis on value creation.
If you prioritize rapid earnings expansion and improving operational leverage, ServiceNow offers a compelling scenario despite its liquidity caution. However, if you seek a durable economic moat with stronger capital efficiency and can accept higher leverage, Autodesk outshines as a more stable growth choice. Both demand scrutiny of their respective risks within your investment strategy.
Disclaimer: Investment carries a risk of loss of initial capital. The past performance is not a reliable indicator of future results. Be sure to understand risks before making an investment decision.
Go Further
I encourage you to read the complete analyses of ServiceNow, Inc. and Autodesk, Inc. to enhance your investment decisions: