Home > Comparison > Technology > NOK vs AUDC
The strategic rivalry between Nokia Oyj and AudioCodes Ltd. shapes the evolution of the communication equipment sector. Nokia operates as a capital-intensive global network solutions provider, while AudioCodes focuses on high-margin, specialized communications software and digital workplace productivity. This head-to-head contrasts scale and diversity against nimble innovation. This analysis will determine which approach delivers superior risk-adjusted returns for a diversified portfolio in today’s dynamic technology landscape.

Table of contents
Companies Overview
Nokia Oyj and AudioCodes Ltd. stand as pivotal players shaping the communication equipment landscape globally.
Nokia Oyj: Global Network Infrastructure Leader
Nokia dominates the communication equipment sector with a comprehensive portfolio spanning mobile, fixed, and cloud network solutions. Its core revenue derives from radio access networks supporting 2G through 5G, fixed networking infrastructure, and cloud virtualization services. In 2026, Nokia strategically emphasizes expanding its cloud and network services to capture the digital transformation wave across telecom operators and enterprises.
AudioCodes Ltd.: Specialist in Unified Communications Software
AudioCodes excels in advanced communication software and productivity solutions for the digital workplace. It monetizes through unified communications products, session border controllers, and VoiceAI applications designed for Microsoft Teams and Skype for Business. The 2026 focus centers on enhancing managed services and cloud software solutions to support seamless migration and integration within enterprise collaboration platforms.
Strategic Collision: Similarities & Divergences
Both companies operate in communication equipment but with contrasting business models. Nokia pursues a broad network infrastructure approach, while AudioCodes adopts a niche focus on software and managed services for unified communications. Their primary battleground is enterprise digital transformation, particularly cloud and voice solutions. Nokia offers scale and network breadth; AudioCodes delivers specialized, software-driven agility. These distinctions shape markedly different risk-return profiles for investors.
Income Statement Comparison
This data dissects the core profitability and scalability of both corporate engines to reveal who dominates the bottom line:
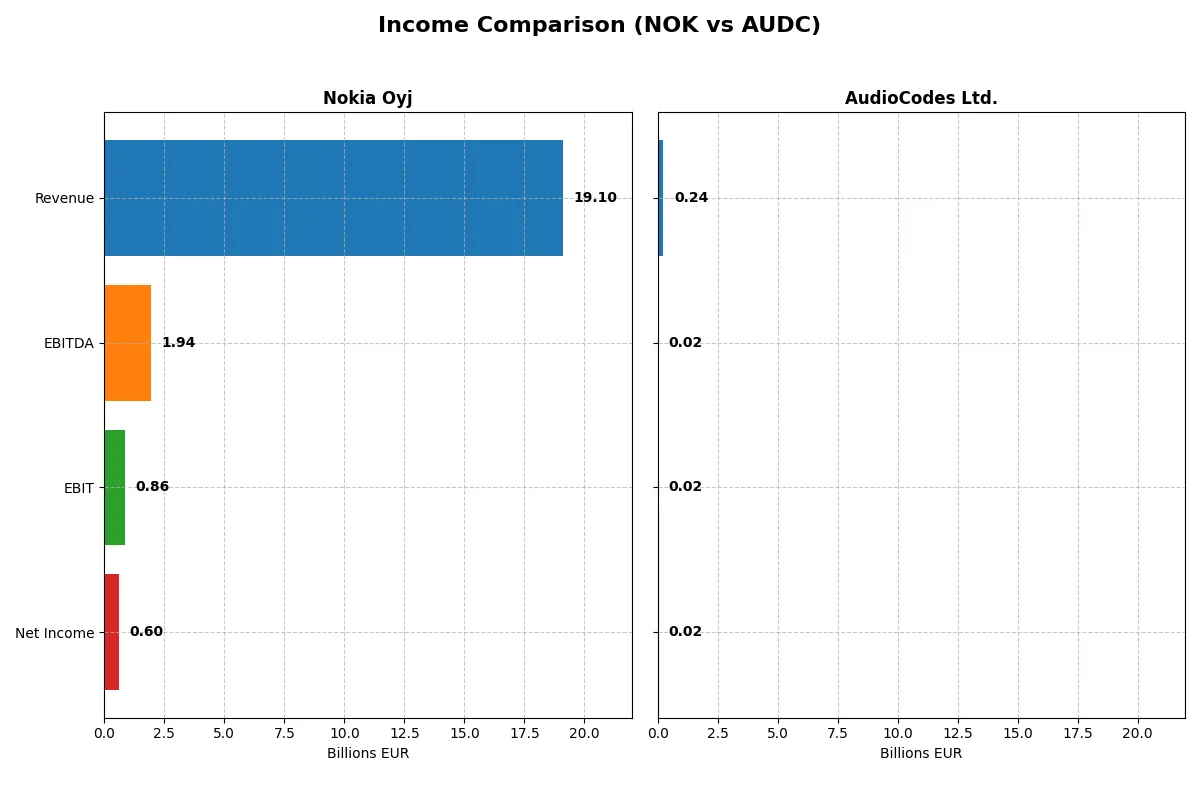
| Metric | Nokia Oyj (NOK) | AudioCodes Ltd. (AUDC) |
|---|---|---|
| Revenue | 19.1B EUR | 242M USD |
| Cost of Revenue | 11.1B EUR | 84M USD |
| Operating Expenses | 6.46B EUR | 141M USD |
| Gross Profit | 8.04B EUR | 158M USD |
| EBITDA | 1.94B EUR | 21M USD |
| EBIT | 862M EUR | 17.2M USD |
| Interest Expense | 0 EUR | 296K USD |
| Net Income | 604M EUR | 15.3M USD |
| EPS | 0.11 EUR | 0.51 USD |
| Fiscal Year | 2025 | 2024 |
Income Statement Analysis: The Bottom-Line Duel
This income statement comparison reveals which company runs a more efficient and resilient corporate engine through revenue and profit dynamics.
Nokia Oyj Analysis
Nokia’s revenue declined modestly by 0.6% in 2025 to €19.1B, continuing a downward trend over five years. Net income dropped sharply by 52.4% year-over-year to €604M, reflecting pressure on profitability. Gross margin remains favorable at 42.1%, but net margin weakened to 3.16%, signaling margin compression and operational challenges in sustaining earnings momentum.
AudioCodes Ltd. Analysis
AudioCodes posted a slight 0.9% revenue decline in 2024 to $242M amid a longer-term 9.7% growth trend. Net income surged 74% year-over-year to $15.3M, boosting net margin to 6.32%. Its gross margin stands robust at 65.3%, and EBIT margin is stable at 7.1%, illustrating effective cost control and improving profitability despite recent top-line softness.
Margin Strength vs. Revenue Scale
AudioCodes outperforms Nokia on margin health and recent net income growth, despite its smaller scale. Nokia’s larger revenue base struggles with declining profitability and shrinking earnings. For investors prioritizing margin expansion and earnings momentum, AudioCodes presents a more attractive profile, while Nokia’s scale offers less efficient returns amid ongoing headwinds.
Financial Ratios Comparison
These vital ratios act as a diagnostic tool to expose the underlying fiscal health, valuation premiums, and capital efficiency of the companies compared below:
| Ratios | Nokia Oyj (NOK) | AudioCodes Ltd. (AUDC) |
|---|---|---|
| ROE | 2.88% | 7.98% |
| ROIC | 3.82% | 6.51% |
| P/E | 49.36 | 19.21 |
| P/B | 1.42 | 1.53 |
| Current Ratio | 1.58 | 2.09 |
| Quick Ratio | 1.36 | 1.69 |
| D/E | 0.25 | 0.19 |
| Debt-to-Assets | 13.86% | 10.85% |
| Interest Coverage | 0.00 | 58.08 |
| Asset Turnover | 0.51 | 0.72 |
| Fixed Asset Turnover | 7.68 | 4.05 |
| Payout Ratio | 119.7% | 71.16% |
| Dividend Yield | 2.43% | 3.70% |
| Fiscal Year | 2025 | 2024 |
Efficiency & Valuation Duel: The Vital Signs
Ratios act as a company’s DNA, revealing hidden risks and operational excellence behind headline numbers.
Nokia Oyj
Nokia shows weak profitability with a low ROE of 2.88% and net margin at 3.16%, signaling operational challenges. The stock trades expensive at a P/E of 49.36 but maintains a solid P/B of 1.42. Nokia rewards shareholders with a 2.43% dividend yield, balancing reinvestment in R&D at 23% of revenue.
AudioCodes Ltd.
AudioCodes delivers moderate profitability with a 7.98% ROE and a neutral net margin of 6.32%. Valuation appears reasonable at a P/E of 19.21 and P/B of 1.53. The company supports shareholders through a 3.7% dividend yield, reflecting stable cash flow amid focused R&D investment at 21.5% of revenue.
Premium Valuation vs. Operational Stability
Nokia’s high valuation contrasts with weak profitability, increasing risk despite dividend income. AudioCodes offers a more balanced profile with healthier margins and moderate valuation. Risk-tolerant investors seeking growth might prefer Nokia’s reinvestment strategy, while income-focused investors may favor AudioCodes’ steadier returns.
Which one offers the Superior Shareholder Reward?
I compare Nokia Oyj (NOK) and AudioCodes Ltd. (AUDC) on dividends, payout ratios, and buybacks. NOK yields 2.43% in 2025 with a payout ratio over 100%, signaling dividend risk. AUDC yields 3.70% with a 71% payout ratio, more sustainable given its higher free cash flow. NOK’s buybacks appear modest, while AUDC’s aggressive dividend and buyback strategy drives total return. I see AUDC’s balanced distribution and strong cash flow underpin long-term shareholder value better. Thus, AudioCodes offers the superior total return profile for 2026 investors.
Comparative Score Analysis: The Strategic Profile
The radar chart reveals the fundamental DNA and trade-offs of Nokia Oyj and AudioCodes Ltd., highlighting their financial strengths and valuation approaches:
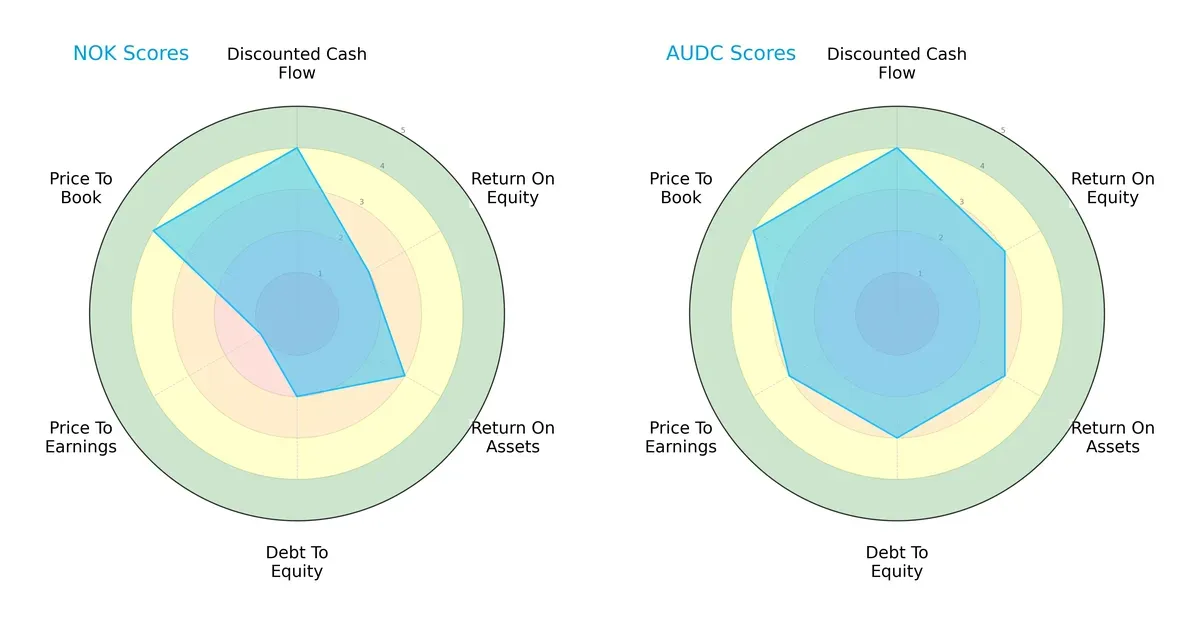
AudioCodes holds a more balanced profile with favorable overall and DCF scores, stronger ROE, and better debt management. Nokia excels in discounted cash flow and price-to-book metrics but suffers from weak price-to-earnings, indicating valuation concerns. AudioCodes leans on operational efficiency, while Nokia depends on selective valuation edges.
Bankruptcy Risk: Solvency Showdown
The Altman Z-Score gap shows both firms reside in the grey zone, signaling moderate bankruptcy risk amid current market cycles:
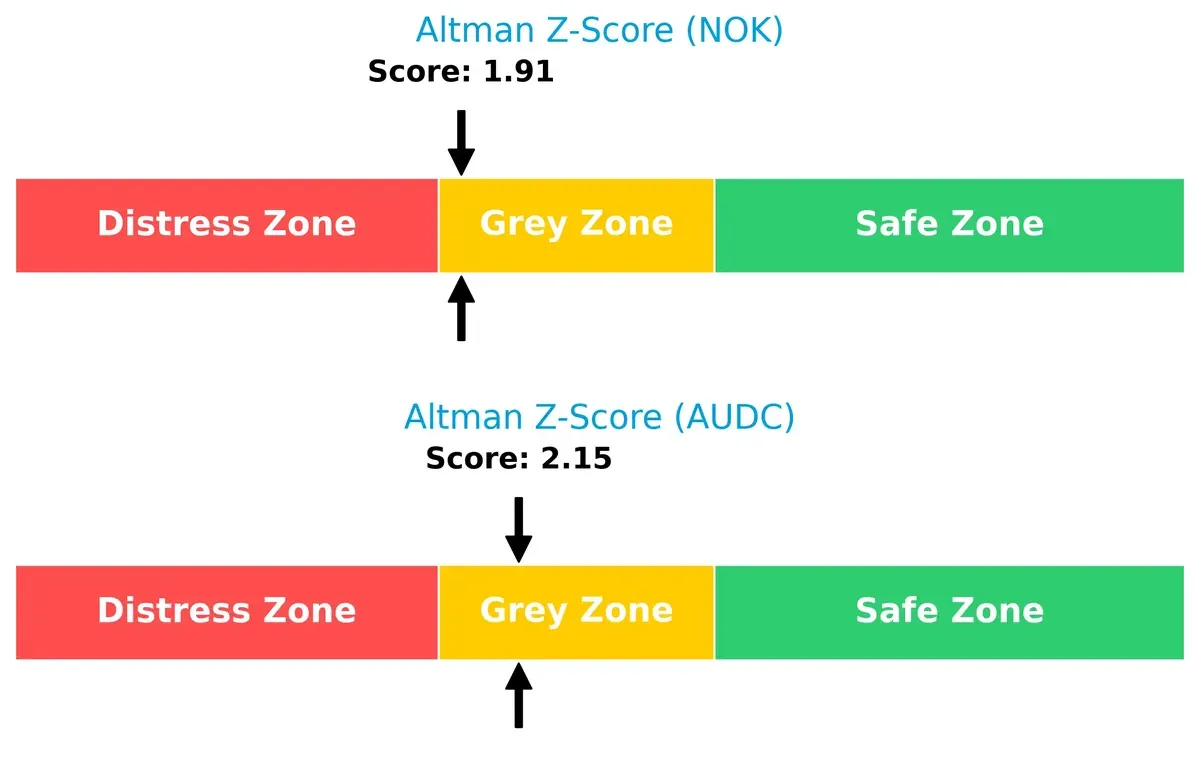
AudioCodes posts a higher score (2.15) than Nokia (1.91), suggesting slightly better long-term solvency and financial resilience under stress.
Financial Health: Quality of Operations
AudioCodes’ Piotroski F-Score of 7 outperforms Nokia’s 5, marking stronger internal financial health and operational quality:
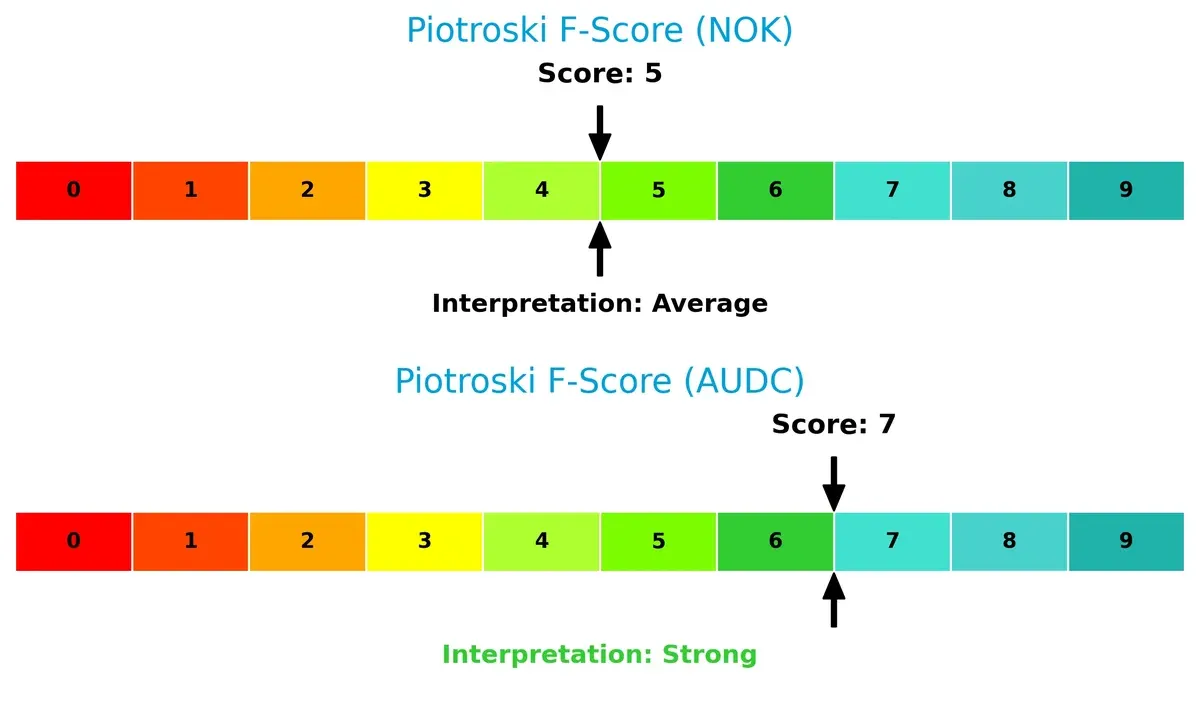
This difference flags Nokia’s weaker internal metrics and operational risks, while AudioCodes demonstrates more robust profitability, liquidity, and efficiency signals.
How are the two companies positioned?
This section dissects the operational DNA of Nokia and AudioCodes by comparing their revenue distribution and internal dynamics. The goal is to confront their economic moats to reveal which business model delivers the most resilient competitive advantage today.
Revenue Segmentation: The Strategic Mix
This visual comparison dissects how Nokia Oyj and AudioCodes Ltd. diversify their income streams and where their primary sector bets lie:
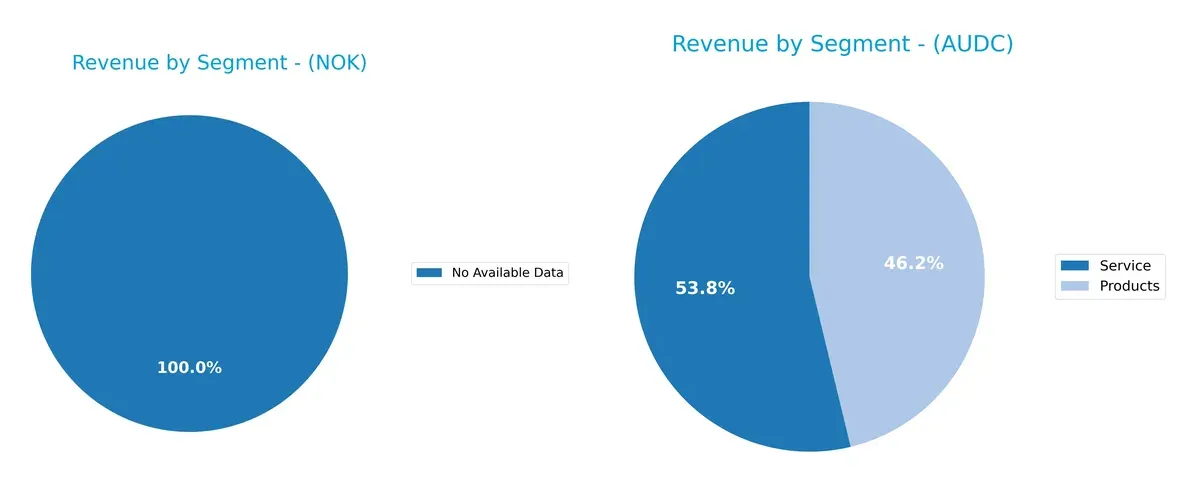
Nokia Oyj lacks available segment data, preventing revenue mix analysis. AudioCodes Ltd. balances roughly $112M in Products and $130M in Services for 2024, showing a diversified mix. This split reduces concentration risk and supports ecosystem lock-in via hardware and recurring service revenues. AudioCodes pivots away from single-segment reliance, enhancing resilience amid volatile tech cycles. Meanwhile, Nokia’s missing segmentation data is a red flag for transparency and strategic clarity.
Strengths and Weaknesses Comparison
This table compares the strengths and weaknesses of Nokia Oyj and AudioCodes Ltd. based on key financial and strategic criteria:
Nokia Oyj Strengths
- Favorable capital structure with low debt-to-assets at 13.86%
- Strong liquidity ratios, current 1.58 and quick 1.36
- High fixed asset turnover at 7.68
- Global presence with diversified geographic revenue streams across Europe, North America, Asia Pacific, and more
- Dividend yield at 2.43%
- Price-to-book favorable at 1.42
AudioCodes Ltd. Strengths
- Favorable liquidity with current ratio 2.09 and quick ratio 1.69
- Low debt-to-assets at 10.85% and good interest coverage at 58.08
- Balanced revenue from products and services segments
- Dividend yield higher at 3.7%
- Global sales spread across Americas, Europe, Eastern Asia, and Israel
- Reasonable valuation with PE at 19.21
Nokia Oyj Weaknesses
- Unfavorable profitability metrics: net margin 3.16%, ROE 2.88%, ROIC 3.82% below WACC 5.69%
- High PE ratio at 49.36 indicates possible overvaluation
- Moderate asset turnover at 0.51
- Limited product segment details
AudioCodes Ltd. Weaknesses
- Neutral net margin at 6.32% and ROIC at 6.51% slightly above WACC 8.05
- ROE unfavorable at 7.98%
- High proportion of neutral ratios reduces clarity on financial strength
- Smaller market share and geographic reach compared to Nokia
Nokia exhibits solid financial stability and broad global reach but struggles with profitability and valuation concerns. AudioCodes shows stronger liquidity and a balanced business mix but has a narrower market footprint and mixed profitability signals. These contrasts highlight different strategic challenges and opportunities for each company.
The Moat Duel: Analyzing Competitive Defensibility
A structural moat is the only reliable shield that protects a company’s long-term profits from relentless competition erosion:
Nokia Oyj: Intangible Assets and Scale Moat
Nokia’s competitive advantage stems from its vast intellectual property and global network infrastructure. This shows in its stable gross margins but declining ROIC signals a weakening moat. Expansion into cloud and 5G could deepen this moat if execution improves in 2026.
AudioCodes Ltd.: Specialized Product Innovation Moat
AudioCodes leverages niche software solutions and VoiceAI to differentiate. Unlike Nokia’s scale, its moat is rooted in innovation and customer-specific products, reflected by superior margins and improving EBIT growth. Its focus on Microsoft Teams integration offers growth potential in 2026.
Scale and Intangibles vs. Innovation and Niche Focus
Both companies are currently value destroyers with declining ROIC, but Nokia’s scale and IP create a broader moat. AudioCodes wins on innovation but with a narrower reach. Nokia remains better positioned to defend market share if it stabilizes profitability.
Which stock offers better returns?
The past year shows Nokia’s stock surging sharply while AudioCodes declined significantly, highlighting starkly divergent trading dynamics.
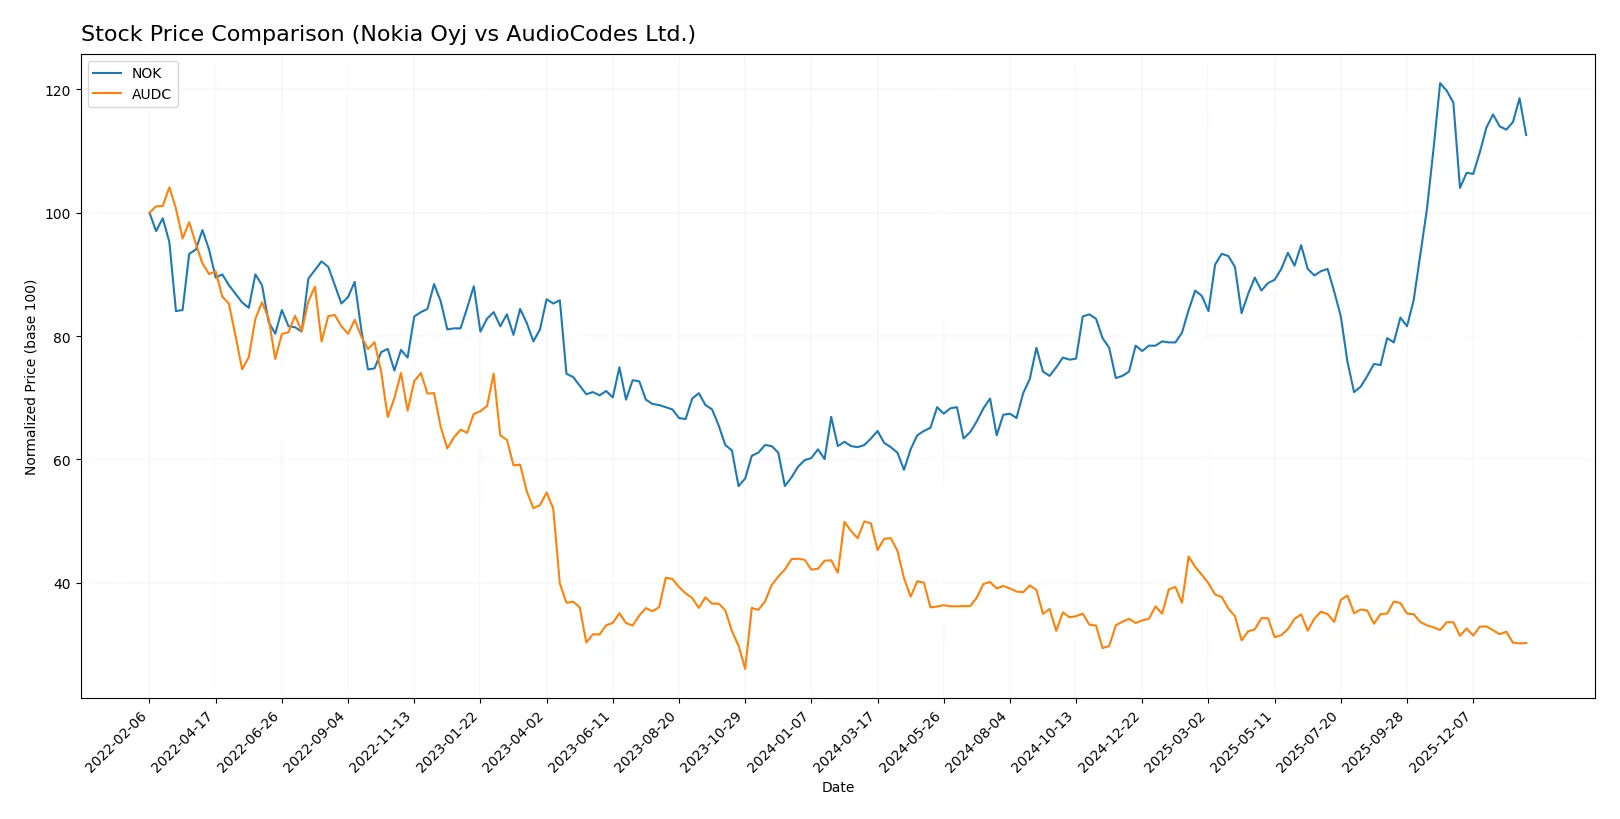
Trend Comparison
Nokia Oyj’s stock gained 77.62% over 12 months, indicating a bullish trend with accelerating momentum from a low of 3.33 to a peak of 6.91. Volatility remained moderate (std dev 0.9).
AudioCodes Ltd.’s stock fell 39.05% over the same period, marking a bearish trend with decelerating losses. The price ranged between 8.12 and 13.7, with slightly higher volatility (std dev 1.08).
Comparing both, Nokia delivered the highest market performance, outperforming AudioCodes by a wide margin on total price appreciation.
Target Prices
Analysts present a clear target price consensus for Nokia Oyj and AudioCodes Ltd.
| Company | Target Low | Target High | Consensus |
|---|---|---|---|
| Nokia Oyj | 5.00 | 8.50 | 6.69 |
| AudioCodes Ltd. | 14.00 | 24.00 | 19.00 |
Nokia’s consensus target price at $6.69 slightly exceeds its current $6.43, signaling modest upside potential. AudioCodes shows strong analyst optimism with a $19 consensus, well above its $8.35 market price.

Don’t Let Luck Decide Your Entry Point
Optimize your entry points with our advanced ProRealTime indicators. You’ll get efficient buy signals with precise price targets for maximum performance. Start outperforming now!
How do institutions grade them?
The following tables summarize the latest grades assigned to Nokia Oyj and AudioCodes Ltd. by recognized financial institutions:
Nokia Oyj Grades
This table presents recent grades from reputable institutions analyzing Nokia Oyj’s stock:
| Grading Company | Action | New Grade | Date |
|---|---|---|---|
| JP Morgan | Maintain | Overweight | 2025-12-01 |
| Jefferies | Upgrade | Buy | 2025-10-28 |
| JP Morgan | Maintain | Overweight | 2025-10-24 |
| JP Morgan | Maintain | Overweight | 2025-07-29 |
| JP Morgan | Maintain | Overweight | 2025-02-21 |
| Craig-Hallum | Maintain | Buy | 2025-01-06 |
| JP Morgan | Upgrade | Overweight | 2024-12-09 |
| JP Morgan | Maintain | Neutral | 2024-10-21 |
| Northland Capital Markets | Maintain | Outperform | 2024-10-18 |
| Northland Capital Markets | Maintain | Outperform | 2024-09-04 |
AudioCodes Ltd. Grades
This table lists the latest grades from recognized firms evaluating AudioCodes Ltd.:
| Grading Company | Action | New Grade | Date |
|---|---|---|---|
| Needham | Maintain | Buy | 2025-05-07 |
| Needham | Maintain | Buy | 2025-02-05 |
| Barclays | Maintain | Underweight | 2025-02-05 |
| Needham | Maintain | Buy | 2025-01-21 |
| Barclays | Maintain | Underweight | 2024-11-07 |
| Needham | Maintain | Buy | 2024-11-07 |
| Needham | Maintain | Buy | 2024-07-31 |
| Needham | Maintain | Buy | 2024-05-09 |
| Barclays | Maintain | Underweight | 2024-05-08 |
| Barclays | Maintain | Underweight | 2024-02-07 |
Which company has the best grades?
Nokia Oyj has consistently received positive grades such as Overweight and Buy from multiple top-tier firms. AudioCodes Ltd. shows a split, with Needham maintaining Buy ratings but Barclays holding an Underweight stance. Nokia’s stronger consensus may suggest greater institutional confidence, potentially impacting investor sentiment favorably.
Risks specific to each company
The following categories identify critical pressure points and systemic threats facing both firms in the 2026 market environment:
1. Market & Competition
Nokia Oyj
- Operates globally in highly competitive telecom equipment; faces pressure from webscales and hyperscalers.
AudioCodes Ltd.
- Focuses on niche communication software and Microsoft Teams integration; competes in a specialized but evolving market.
2. Capital Structure & Debt
Nokia Oyj
- Low debt-to-equity at 0.25 signals conservative leverage; interest coverage is infinite, indicating strong debt service capacity.
AudioCodes Ltd.
- Slightly lower debt-to-equity at 0.19; interest coverage ratio of 58 shows solid ability to meet interest obligations.
3. Stock Volatility
Nokia Oyj
- Beta of 0.51 reflects lower volatility than market, appealing to risk-averse investors.
AudioCodes Ltd.
- Beta near 1.05 suggests stock moves roughly in line with market; higher volatility risk for traders.
4. Regulatory & Legal
Nokia Oyj
- Subject to global telecom regulations, including EU data and network security laws; risks from policy shifts in major markets.
AudioCodes Ltd.
- Faces regulatory scrutiny in telecom software and cloud services; geopolitical risks due to Israeli base with global sales.
5. Supply Chain & Operations
Nokia Oyj
- Large, complex supply chain servicing hardware and software; vulnerable to component shortages and geopolitical disruptions.
AudioCodes Ltd.
- Smaller scale supply chain focused on software and hardware appliances; less exposed but dependent on key technology partners.
6. ESG & Climate Transition
Nokia Oyj
- Established ESG programs aligned with EU standards; pressure to reduce carbon footprint in manufacturing and network infrastructure.
AudioCodes Ltd.
- Emerging ESG initiatives; faces challenges integrating sustainability in software delivery and data center operations.
7. Geopolitical Exposure
Nokia Oyj
- Global footprint includes exposure to EU, US-China tensions, and Russian markets; sensitive to sanctions and trade restrictions.
AudioCodes Ltd.
- Israeli headquarters bring exposure to Middle East geopolitical risks; global sales add complexity amid rising trade frictions.
Which company shows a better risk-adjusted profile?
Nokia’s largest risk lies in intense global competition and complex supply chains that strain margins. AudioCodes faces significant geopolitical exposure and stock volatility amid niche market challenges. Nokia’s lower beta and stronger capital structure offer a more stable risk-adjusted profile. Notably, Nokia’s infinite interest coverage contrasts with AudioCodes’ high but finite ratio, underscoring Nokia’s superior debt resilience.
Final Verdict: Which stock to choose?
Nokia Oyj’s superpower lies in its robust balance sheet and operational resilience, making it a steady cash generator despite recent profit pressure. Its point of vigilance is the declining profitability trend, which could challenge long-term value creation. Nokia fits well in portfolios seeking stable income with moderate growth exposure.
AudioCodes Ltd. boasts a strategic moat through its niche in communication technology and solid gross margins, supported by a strong liquidity position. It offers a comparatively safer profile than Nokia’s cyclical earnings. AudioCodes suits investors focusing on growth at a reasonable price with a tilt toward innovation-driven sectors.
If you prioritize capital preservation and steady cash flow, Nokia outshines with its solid financial footing and dividend yield. However, if you seek growth potential with a technology edge and better margin profiles, AudioCodes offers superior stability amid market volatility. Both carry risks linked to declining returns on invested capital, demanding careful monitoring.
Disclaimer: Investment carries a risk of loss of initial capital. The past performance is not a reliable indicator of future results. Be sure to understand risks before making an investment decision.
Go Further
I encourage you to read the complete analyses of Nokia Oyj and AudioCodes Ltd. to enhance your investment decisions: