Home > Comparison > Industrials > PH vs ATS
The competitive dynamic between Parker-Hannifin Corporation and ATS Corporation shapes the industrial machinery landscape. Parker-Hannifin operates as a diversified industrial giant with a broad aerospace segment, while ATS focuses on automation solutions and digital factory management. This contrasting operational model highlights a pivotal battle between traditional industrial manufacturing and advanced automation innovation. This analysis will clarify which company presents a superior risk-adjusted opportunity for investors seeking industrial sector exposure.
Table of contents
Companies Overview
Parker-Hannifin and ATS Corporation are pivotal industrial machinery players shaping automation and control markets globally.
Parker-Hannifin Corporation: Leader in Motion and Control Technologies
Parker-Hannifin dominates the industrial machinery sector with a diversified portfolio spanning motion and control technologies. Its core revenue stems from selling hydraulic, pneumatic, and electromechanical components to OEMs and distributors. In 2026, it focuses on expanding aerospace systems while enhancing industrial segment solutions for aggressive market penetration.
ATS Corporation: Specialist in Automation Solutions
ATS Corporation excels as a provider of custom automation systems worldwide. It generates revenue by designing, building, and servicing automated manufacturing and assembly systems across diverse sectors. The company’s 2026 strategy emphasizes integrating digital factory floor management to boost operational efficiency and sustain production improvements.
Strategic Collision: Similarities & Divergences
Both firms thrive on industrial innovation but differ in scope. Parker-Hannifin pursues a broad-based product ecosystem covering aerospace and industrial machinery. ATS prioritizes bespoke automation with a software-driven approach for factory digitization. Their battleground lies in serving OEMs needing advanced manufacturing solutions. Investors encounter distinct profiles: Parker-Hannifin offers scale and diversification, while ATS delivers focused automation expertise.
Income Statement Comparison
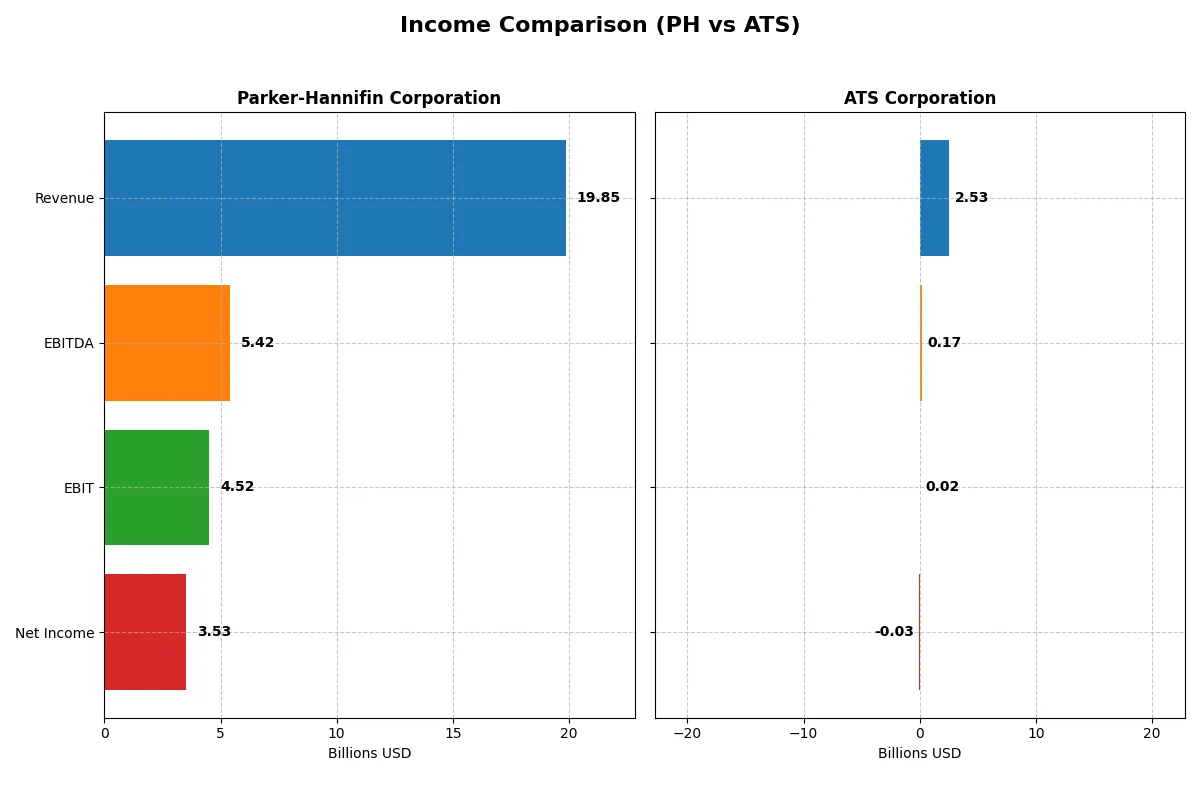
This data dissects the core profitability and scalability of both corporate engines to reveal who dominates the bottom line:
| Metric | Parker-Hannifin Corporation (PH) | ATS Corporation (ATS) |
|---|---|---|
| Revenue | 19.85B | 2.53B |
| Cost of Revenue | 12.54B | 1.89B |
| Operating Expenses | 3.26B | 637M |
| Gross Profit | 7.32B | 647M |
| EBITDA | 5.42B | 168M |
| EBIT | 4.52B | 15.3M |
| Interest Expense | 409M | 98.2M |
| Net Income | 3.53B | -28.0M |
| EPS | 27.52 | -0.29 |
| Fiscal Year | 2025 | 2025 |
Income Statement Analysis: The Bottom-Line Duel
This income statement comparison reveals which company runs a more efficient and profitable operation through recent financial cycles.
Parker-Hannifin Corporation Analysis
Parker-Hannifin posts steady revenue near $19.9B, with net income climbing from $1.75B in 2021 to $3.53B in 2025. Its gross margin holds strong at 36.85%, while net margin improves to 17.79%. The latest year shows a slight revenue dip but a robust 24.6% net margin growth, underscoring margin expansion and operational momentum.
ATS Corporation Analysis
ATS’s revenue rose 77% from 2021 to 2025, reaching CAD 2.53B, but it reported a net loss of CAD 28M in 2025, reversing prior profits. Gross margin fell to 25.53%, and net margin turned negative at -1.11%. The last year saw a sharp 16.5% revenue decline and a steep drop in EBIT and EPS, signaling operational and profitability challenges.
Margin Strength vs. Topline Growth
Parker-Hannifin delivers superior profitability with expanding margins and consistent net income growth, despite modest revenue softness. ATS shows impressive revenue growth over five years but suffers severe margin compression and a recent downturn to net losses. For investors focused on fundamental earnings quality, Parker-Hannifin’s profile offers clearer financial resilience and efficiency.
Financial Ratios Comparison
These vital ratios act as a diagnostic tool to expose the underlying fiscal health, valuation premiums, and capital efficiency for each company:
| Ratios | Parker-Hannifin (PH) | ATS Corporation (ATS) |
|---|---|---|
| ROE | 25.8% | -1.6% |
| ROIC | 13.7% | 0.1% |
| P/E | 25.4 | -125.3 |
| P/B | 6.55 | 2.06 |
| Current Ratio | 1.19 | 1.69 |
| Quick Ratio | 0.71 | 1.41 |
| D/E | 0.69 | 1.00 |
| Debt-to-Assets | 32.2% | 36.8% |
| Interest Coverage | 9.93 | 0.09 |
| Asset Turnover | 0.67 | 0.55 |
| Fixed Asset Turnover | 6.76 | 5.66 |
| Payout ratio | 24.4% | 0% |
| Dividend yield | 0.96% | 0% |
| Fiscal Year | 2025 | 2025 |
Efficiency & Valuation Duel: The Vital Signs
Financial ratios act as a company’s DNA, exposing hidden risks and operational strengths that define its investment appeal and resilience.
Parker-Hannifin Corporation
Parker-Hannifin demonstrates strong profitability with a 25.8% ROE and a solid 17.8% net margin, signaling operational excellence. Its valuation appears stretched, with a P/E of 25.4 and a P/B of 6.55, above sector norms. The company returns value through modest dividends (0.96% yield), prioritizing steady shareholder income over aggressive reinvestment.
ATS Corporation
ATS struggles with negative profitability: a -1.6% ROE and -1.1% net margin reveal operational challenges. Despite a low and technically favorable P/E, this reflects earnings instability rather than undervaluation. ATS maintains a solid liquidity position (current ratio 1.69) but offers no dividends, indicating reinvestment efforts amidst financial headwinds.
Premium Valuation vs. Operational Safety
Parker-Hannifin balances superior profitability and operational efficiency despite a premium valuation. ATS’s weak profitability and earnings volatility increase risk despite better liquidity. Investors seeking stable returns may prefer Parker-Hannifin, while those tolerant of risk might consider ATS’s turnaround potential.
Which one offers the Superior Shareholder Reward?
I see Parker-Hannifin (PH) pays a modest dividend yield near 1%, with a well-covered 24% payout ratio supported by strong free cash flow (26B FCF/share). It also executes steady buybacks, boosting total returns sustainably. ATS Corporation (ATS) pays no dividends and delivers negative free cash flow, relying on reinvestment to fuel growth. Its buyback activity is negligible, reflecting a capital allocation under pressure amid thin profitability and cash constraints. Historically, PH’s balanced distribution through dividends and buybacks offers a more dependable total shareholder return in 2026. I conclude PH provides the superior shareholder reward, blending income and capital return with stronger financial footing.
Comparative Score Analysis: The Strategic Profile
The radar chart reveals the fundamental DNA and trade-offs of Parker-Hannifin and ATS Corporation, highlighting their core financial strengths and weaknesses:
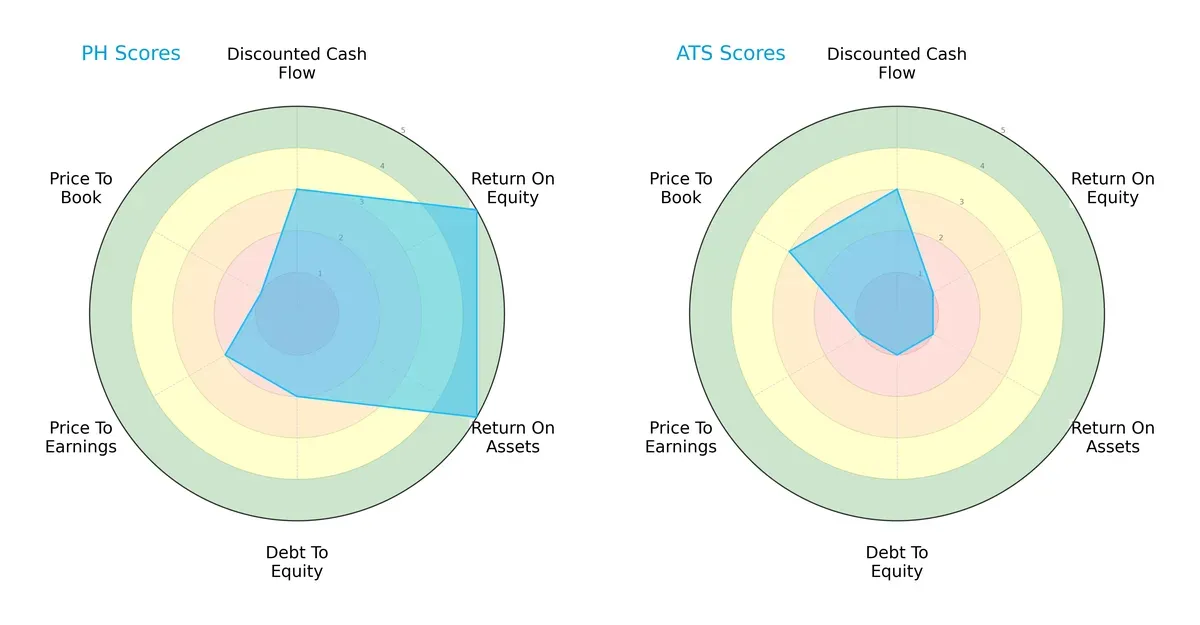
Parker-Hannifin boasts superior profitability metrics with ROE and ROA scores at 5, demonstrating efficient capital and asset utilization. ATS lags significantly here, scoring 1 in both. ATS’s strength lies modestly in valuation, scoring 3 on price-to-book, whereas Parker-Hannifin scores poorly at 1. Debt management favors Parker-Hannifin (2 vs. ATS’s 1), indicating a more balanced financial profile. Overall, Parker-Hannifin presents a diversified strategic position, while ATS relies on a narrow valuation advantage.
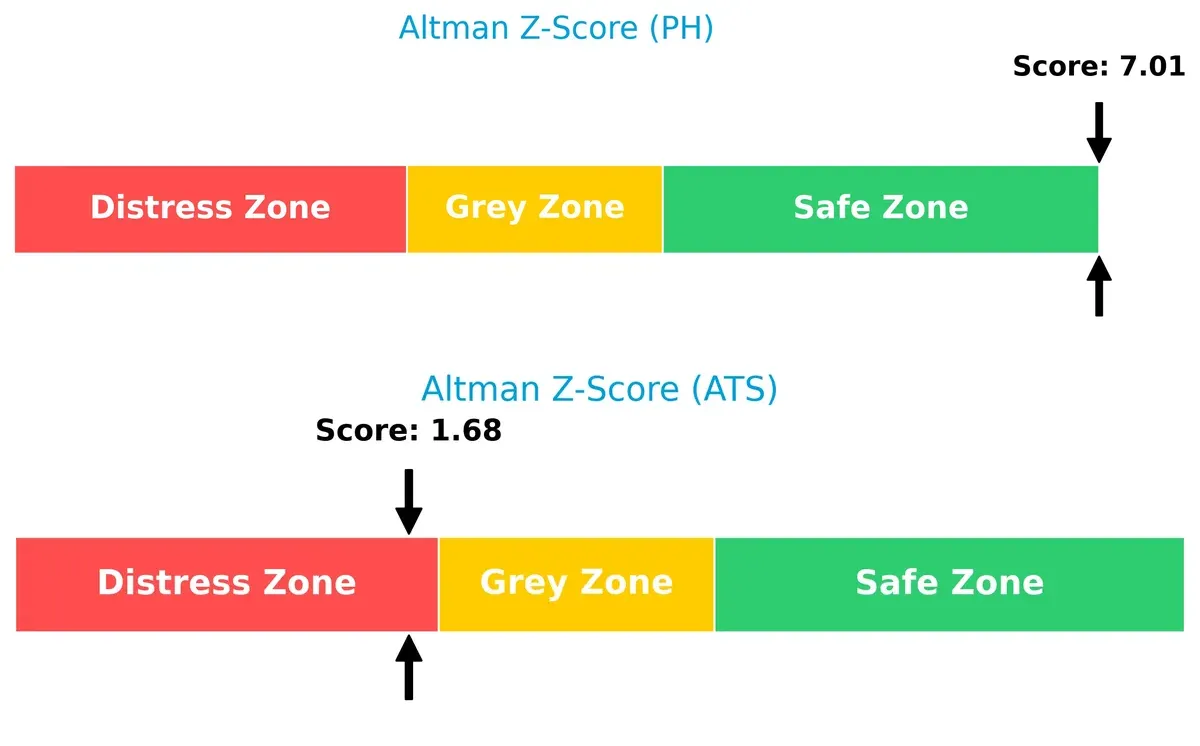
Bankruptcy Risk: Solvency Showdown
Parker-Hannifin’s Altman Z-Score of 7.0 firmly places it in the safe zone, signaling robust financial health and low bankruptcy risk. ATS, with a score of 1.7, sits in the distress zone, indicating elevated default risk under current market pressures:
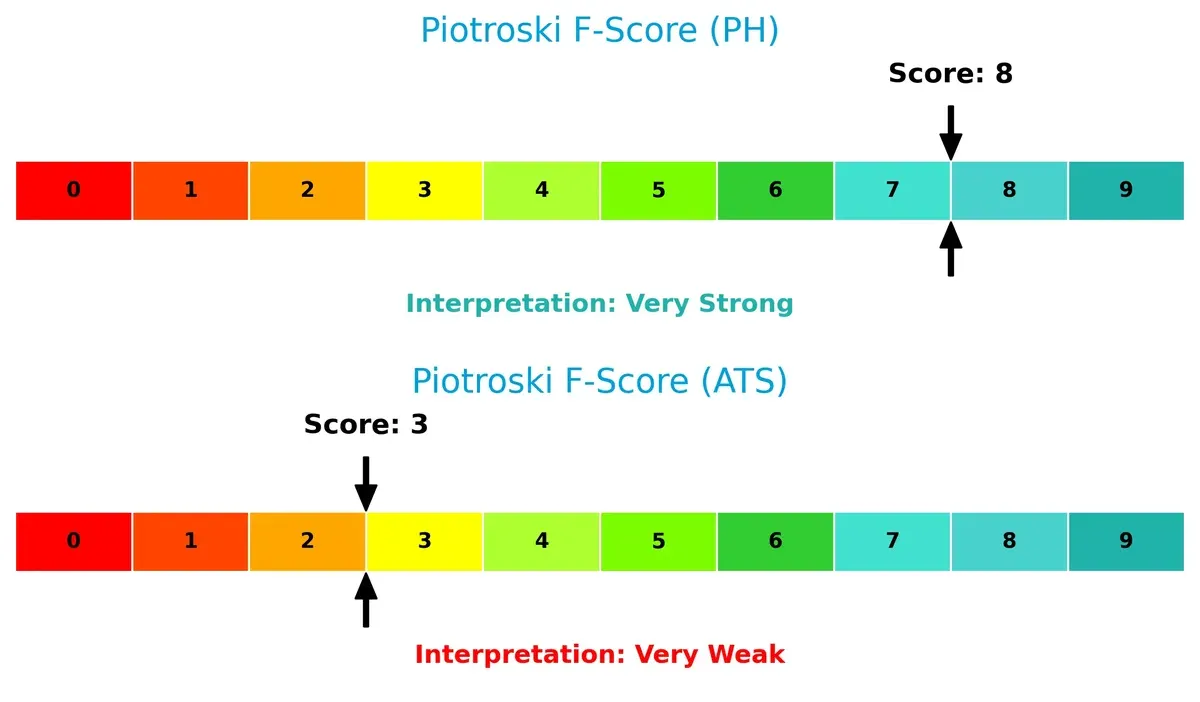
Financial Health: Quality of Operations
Parker-Hannifin’s Piotroski F-Score of 8 signals very strong operational quality and internal financial discipline. ATS’s score of 3 flags potential red flags in profitability and efficiency, suggesting weaker fundamental resilience:
How are the two companies positioned?
This section dissects PH and ATS’s operational DNA by comparing revenue distribution and internal dynamics—strengths and weaknesses. The goal is to confront their economic moats to reveal which model offers the most resilient competitive advantage today.
Revenue Segmentation: The Strategic Mix
This visual comparison dissects how Parker-Hannifin Corporation and ATS Corporation diversify their income streams and where their primary sector bets lie:
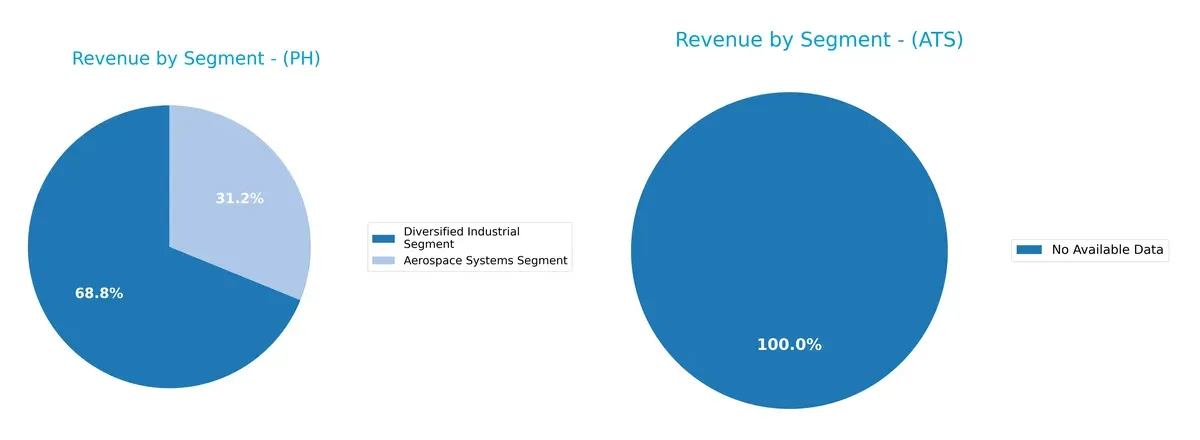
Parker-Hannifin anchors revenue in two major segments: Diversified Industrial at $13.7B and Aerospace Systems at $6.2B in 2025. This mix shows a balanced, though Industrial-heavy portfolio, reducing concentration risk. ATS lacks segment data, so I cannot assess its diversification. Parker-Hannifin’s dual-segment approach leverages strong industrial infrastructure and aerospace niche dominance, providing resilience amid sector cyclicality.
Strengths and Weaknesses Comparison
This table compares the Strengths and Weaknesses of Parker-Hannifin Corporation (PH) and ATS Corporation (ATS):
PH Strengths
- Diversified revenue from Aerospace and Industrial segments
- Strong profitability with 17.79% net margin and 25.81% ROE
- High fixed asset turnover at 6.76
- Solid global presence including $13.4B North America and $3.9B Europe sales
ATS Strengths
- Favorable liquidity ratios, current ratio 1.69 and quick ratio 1.41
- Some geographic diversification with US, Germany, Italy, and other Europe sales
- Favorable PE ratio and moderate PB at 2.06
- Favorable fixed asset turnover at 5.66
PH Weaknesses
- Unfavorable valuation multiples, PE 25.38 and PB 6.55 indicate possible overvaluation
- Quick ratio low at 0.71, signaling liquidity risk
- Dividend yield under 1% may deter income investors
- Moderate debt levels at 32.16% debt to assets
ATS Weaknesses
- Negative profitability with net margin -1.11% and ROE -1.64%
- Very weak interest coverage at 0.16, signaling risk in meeting debt costs
- No dividend yield
- Slightly higher debt to assets at 36.79%
Parker-Hannifin demonstrates robust profitability and global scale but faces valuation and liquidity concerns. ATS shows liquidity strength but struggles with profitability and interest coverage. Each company’s profile suggests distinct strategic priorities and risk exposures.
The Moat Duel: Analyzing Competitive Defensibility
A structural moat is the only reliable shield protecting long-term profits from relentless competitive erosion. Let’s dissect the moats of two industrial machinery players:
Parker-Hannifin Corporation: Durable Efficiency and Innovation Moat
Parker-Hannifin’s moat stems from its advanced motion and control technologies, delivering a high ROIC consistently above WACC by 4.4%. This reflects efficient capital use and margin stability, supported by 22.75% EBIT margin. Their diverse industrial and aerospace markets offer growth avenues, deepening the moat in 2026 through innovation.
ATS Corporation: Automation Niche with Volatile Profitability
ATS relies on specialized automation solutions, a narrower moat compared to Parker-Hannifin’s diversified tech edge. Its ROIC trails WACC by 7.9%, signaling value destruction and declining profitability. ATS faces a critical challenge to stabilize margins and leverage digital solutions to expand beyond its core markets in 2026.
Innovation Leadership vs. Automation Specialization: The Moat Face-off
Parker-Hannifin holds the wider and deeper moat, demonstrated by strong, growing ROIC and robust financials. ATS’s declining profitability exposes vulnerability. Parker-Hannifin is clearly better positioned to defend and grow its market share amidst intensifying competition.
Which stock offers better returns?
Over the past year, Parker-Hannifin Corporation’s stock surged sharply, exhibiting strong upward momentum, while ATS Corporation faced a notable decline with signs of recent recovery.
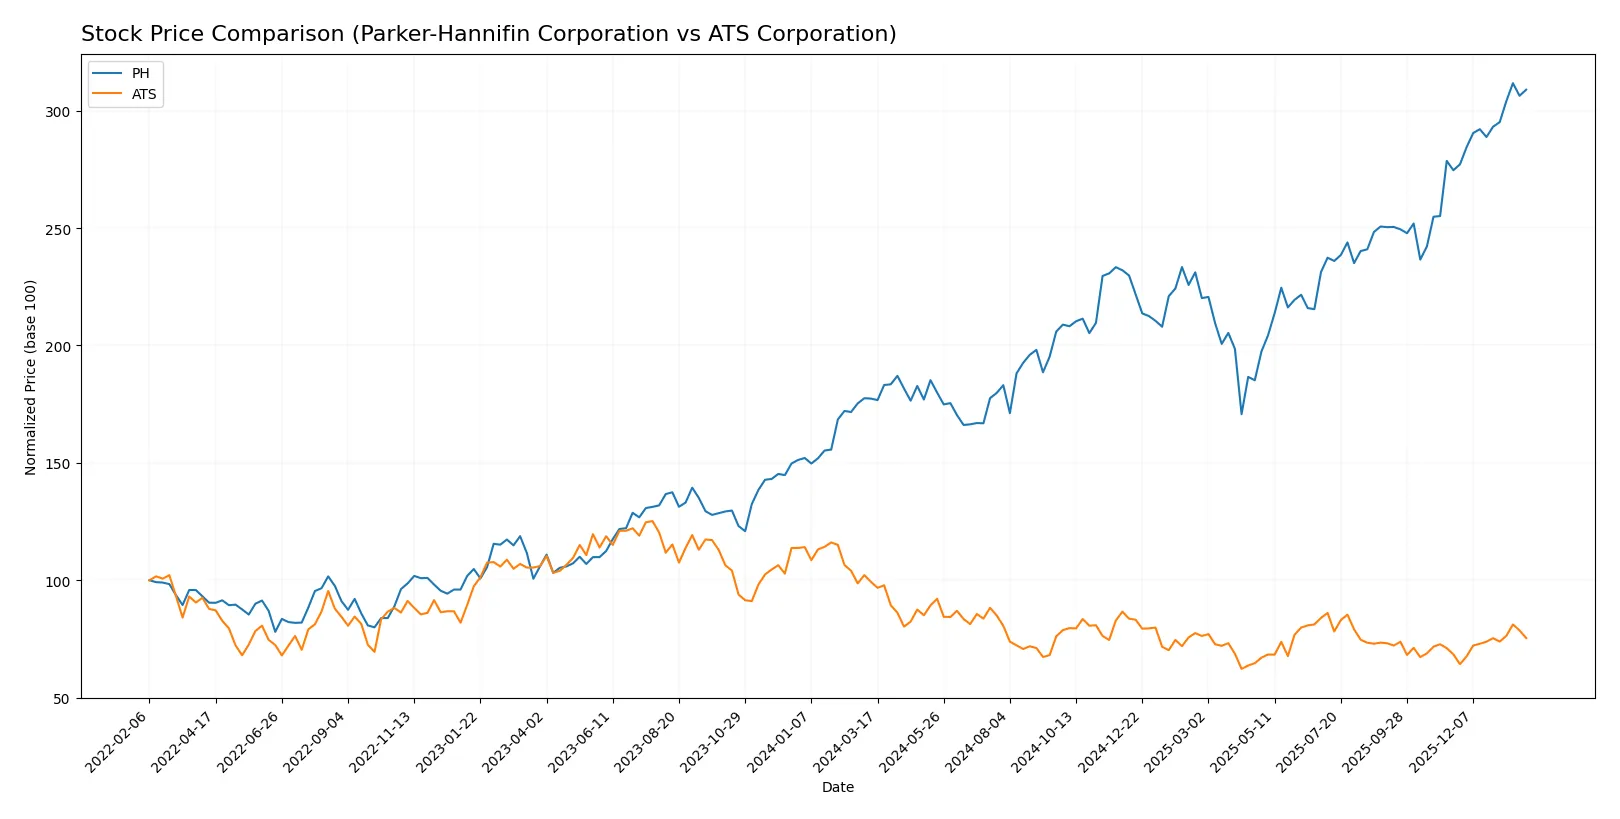
Trend Comparison
Parker-Hannifin’s stock gained 74.16% over the past year, showing a bullish trend with accelerating price increases and a high volatility of 112.58. The stock hit a low of 503.3 and climbed to a peak of 944.27.
ATS Corporation’s stock fell 24.09% over the same period, marking a bearish trend despite recent acceleration. Volatility remained low at 2.83, with prices ranging from 23.5 to 37.49.
Parker-Hannifin clearly outperformed ATS over the last year, delivering significantly higher returns with strong upward momentum and volume dominance.
Target Prices
Analysts set a clear target price consensus for Parker-Hannifin Corporation and ATS Corporation.
| Company | Target Low | Target High | Consensus |
|---|---|---|---|
| Parker-Hannifin Corporation | 825 | 1,139 | 995.46 |
| ATS Corporation | 34 | 34 | 34 |
The consensus target for Parker-Hannifin trades about 6% above its current price, signaling modest upside potential. ATS’s single target price implies a roughly 19% premium to its current level.

Don’t Let Luck Decide Your Entry Point
Optimize your entry points with our advanced ProRealTime indicators. You’ll get efficient buy signals with precise price targets for maximum performance. Start outperforming now!
How do institutions grade them?
Parker-Hannifin Corporation Grades
The following table summarizes recent institutional grades for Parker-Hannifin Corporation.
| Grading Company | Action | New Grade | Date |
|---|---|---|---|
| Wells Fargo | Maintain | Overweight | 2026-01-30 |
| Stifel | Maintain | Hold | 2026-01-30 |
| JP Morgan | Maintain | Overweight | 2026-01-30 |
| Jefferies | Maintain | Buy | 2026-01-30 |
| Barclays | Maintain | Overweight | 2026-01-30 |
| Citigroup | Maintain | Buy | 2026-01-30 |
| Stifel | Maintain | Hold | 2026-01-23 |
| JP Morgan | Maintain | Overweight | 2026-01-16 |
| Morgan Stanley | Maintain | Equal Weight | 2026-01-14 |
| Barclays | Maintain | Overweight | 2026-01-07 |
ATS Corporation Grades
The following table summarizes recent institutional grades for ATS Corporation.
| Grading Company | Action | New Grade | Date |
|---|---|---|---|
| JP Morgan | Maintain | Neutral | 2026-01-16 |
| JP Morgan | Maintain | Neutral | 2024-08-13 |
| Goldman Sachs | Maintain | Sell | 2024-08-13 |
| JP Morgan | Maintain | Neutral | 2024-05-24 |
Which company has the best grades?
Parker-Hannifin consistently receives overweight and buy ratings from multiple firms. ATS has mostly neutral and one sell rating. Investors may perceive Parker-Hannifin as stronger based on these grades.
Risks specific to each company
The following categories identify critical pressure points and systemic threats facing Parker-Hannifin Corporation and ATS Corporation in the 2026 market environment:
1. Market & Competition
Parker-Hannifin Corporation
- Dominates diversified industrial and aerospace sectors with strong product breadth, facing intense OEM competition
ATS Corporation
- Competes in automation solutions with narrower scope, challenged by innovation pace and market penetration
2. Capital Structure & Debt
Parker-Hannifin Corporation
- Moderate leverage with debt/equity 0.69; interest coverage strong at 11.04, indicating manageable debt risk
ATS Corporation
- Higher leverage with debt/equity 1.0; interest coverage very low at 0.16, exposing financial vulnerability
3. Stock Volatility
Parker-Hannifin Corporation
- Beta of 1.253 indicates moderate volatility, reflecting stable investor confidence
ATS Corporation
- Slightly higher beta of 1.268 suggests greater price swings and market sensitivity
4. Regulatory & Legal
Parker-Hannifin Corporation
- Operates globally, facing aerospace and industrial regulatory complexity but with established compliance systems
ATS Corporation
- Exposure to multiple sectors requires adherence to diverse regulations, with potential compliance cost pressures
5. Supply Chain & Operations
Parker-Hannifin Corporation
- Complex global supply chains for aerospace and industrial parts vulnerable to geopolitical disruptions
ATS Corporation
- Automation manufacturing reliant on specialized components and services, susceptible to supply bottlenecks
6. ESG & Climate Transition
Parker-Hannifin Corporation
- Focus on industrial efficiency and aerospace emissions reduction aligns with climate goals, but transition costs remain
ATS Corporation
- Increasing pressure to adopt sustainable automation solutions, with risk of lagging behind ESG-driven competitors
7. Geopolitical Exposure
Parker-Hannifin Corporation
- US-based with global footprint; trade tensions and aerospace export controls pose risks
ATS Corporation
- Canadian base with exposure to US and global markets; geopolitical trade shifts impact supply chain and contracts
Which company shows a better risk-adjusted profile?
Parker-Hannifin faces moderate debt and regulatory complexity but benefits from strong profitability and financial stability. ATS shows higher financial distress signals with weak earnings and fragile interest coverage. Parker-Hannifin’s Altman Z-Score of 7.0 places it safely above bankruptcy risk, whereas ATS’s 1.68 flags serious financial distress. ATS’s negative net margin and low Piotroski score reinforce its risk vulnerability. Based on these metrics, Parker-Hannifin presents a superior risk-adjusted profile amid 2026 uncertainties.
Final Verdict: Which stock to choose?
Parker-Hannifin’s superpower lies in its robust value creation and durable competitive advantage, demonstrated by a growing ROIC well above its cost of capital. Its main point of vigilance is a stretched valuation, which demands confidence in sustained growth. It fits well in portfolios targeting steady, aggressive growth.
ATS leverages a strategic moat rooted in niche automation solutions, offering a safety cushion through solid liquidity ratios compared to Parker-Hannifin. However, it currently struggles with profitability and value destruction signals. It might suit investors seeking speculative turnaround opportunities or GARP profiles with a tolerance for risk.
If you prioritize consistent value creation and strong profitability, Parker-Hannifin outshines ATS with its durable moat and favorable income trends. However, if you seek a higher risk-reward dynamic and appreciate better liquidity safety, ATS offers a speculative play despite its challenges. Each scenario demands careful risk assessment aligned with your investment strategy.
Disclaimer: Investment carries a risk of loss of initial capital. The past performance is not a reliable indicator of future results. Be sure to understand risks before making an investment decision.
Go Further
I encourage you to read the complete analyses of Parker-Hannifin Corporation and ATS Corporation to enhance your investment decisions: