Atlassian Corporation and The Trade Desk, Inc. are two prominent players in the software application industry, each driving innovation in distinct yet overlapping markets: collaborative work management and data-driven digital advertising. Atlassian excels in productivity tools connecting teams, while The Trade Desk pioneers programmatic ad technology. This comparison will help you understand which company presents the most compelling investment opportunity in today’s evolving tech landscape. Let’s explore their strengths and potential for growth.
Table of contents
Companies Overview
I will begin the comparison between Atlassian Corporation and The Trade Desk by providing an overview of these two companies and their main differences.
Atlassian Corporation Overview
Atlassian Corporation, founded in 2002 and based in Sydney, Australia, develops and licenses software products designed to improve team collaboration and project management. Its portfolio includes Jira Software, Trello, and Confluence, among others, serving both technical and business teams globally. Atlassian focuses on enhancing workplace productivity through tools that facilitate planning, tracking, and managing work across diverse teams.
The Trade Desk Overview
The Trade Desk, Inc., established in 2009 and headquartered in Ventura, California, operates a cloud-based platform enabling buyers to create and optimize digital advertising campaigns across multiple formats and devices. Serving advertising agencies and service providers worldwide, The Trade Desk emphasizes data-driven marketing solutions that cover display, video, audio, native, and social channels. The company aims to enhance advertising efficiency through a self-service technology platform.
Key similarities and differences
Both Atlassian and The Trade Desk operate within the technology sector, focusing on software solutions that enhance business operations. Atlassian emphasizes collaboration and project management tools, while The Trade Desk specializes in digital advertising technology. Atlassian’s products serve internal business teams, whereas The Trade Desk targets advertisers and agencies, highlighting a difference in customer base and application despite their shared industry.
Income Statement Comparison
The table below presents a side-by-side comparison of key income statement metrics for Atlassian Corporation and The Trade Desk, Inc. for their most recent fiscal years.
| Metric | Atlassian Corporation (TEAM) | The Trade Desk, Inc. (TTD) |
|---|---|---|
| Market Cap | 31.1B | 17.3B |
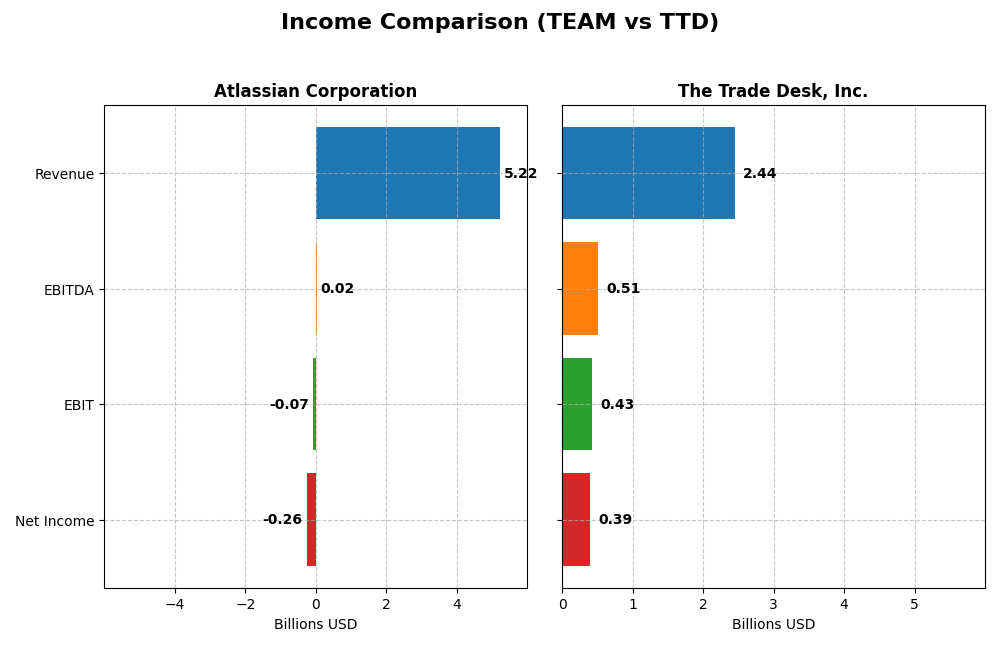
| Revenue | 5.22B | 2.44B |
| EBITDA | 24.0M | 515M |
| EBIT | -68.3M | 427M |
| Net Income | -257M | 393M |
| EPS | -0.98 | 0.80 |
| Fiscal Year | 2025 | 2024 |
Income Statement Interpretations
Atlassian Corporation
Atlassian’s revenue grew significantly from $2.1B in 2021 to $5.2B in 2025, with net income losses narrowing from -$579M to -$257M. Gross margin remained strong at 82.8%, though EBIT and net margins were negative. In 2025, revenue growth slowed to 19.7%, but net margin improved by 28.6%, indicating a gradual profitability recovery despite ongoing losses.
The Trade Desk, Inc.
The Trade Desk’s revenue advanced from $837M in 2020 to $2.4B in 2024, with net income rising from $242M to $393M. Gross margin stayed stable around 80.7%, while EBIT and net margins were positive and improved further. In 2024, the company posted strong 25.6% revenue growth and a 74.9% increase in net margin, reflecting robust expansion and margin enhancement.
Which one has the stronger fundamentals?
The Trade Desk shows stronger fundamentals with consistent profitability, positive EBIT and net margins, and a higher proportion of favorable income metrics. Atlassian, despite strong revenue growth and improving net margins, still reports negative EBIT and net income. Both companies demonstrate favorable revenue expansion, but The Trade Desk’s earnings performance and margin stability appear more robust.
Financial Ratios Comparison
The table below presents a side-by-side comparison of key financial ratios for Atlassian Corporation (TEAM) and The Trade Desk, Inc. (TTD) based on their most recent fiscal year data.
| Ratios | Atlassian Corporation (TEAM) FY 2025 | The Trade Desk, Inc. (TTD) FY 2024 |
|---|---|---|
| ROE | -19.1% | 13.3% |
| ROIC | -4.5% | 10.0% |
| P/E | -207.1 | 146.8 |
| P/B | 39.5 | 19.6 |
| Current Ratio | 1.22 | 1.86 |
| Quick Ratio | 1.22 | 1.86 |
| D/E (Debt to Equity) | 0.92 | 0.11 |
| Debt-to-Assets | 20.5% | 5.1% |
| Interest Coverage | -4.27 | 0 (not reported) |
| Asset Turnover | 0.86 | 0.40 |
| Fixed Asset Turnover | 19.0 | 5.17 |
| Payout Ratio | 0 | 0 |
| Dividend Yield | 0 | 0 |
Interpretation of the Ratios
Atlassian Corporation
Atlassian shows several unfavorable ratios including net margin at -4.92% and return on equity at -19.08%, indicating profitability and efficiency challenges. The quick ratio is favorable at 1.22, supporting liquidity, but interest coverage is negative, suggesting financial stress. The company does not pay dividends, likely reflecting reinvestment priorities or growth focus.
The Trade Desk, Inc.
The Trade Desk presents mostly favorable ratios such as a net margin of 16.08% and return on invested capital at 10.02%, signaling solid profitability and capital use. Its current and quick ratios around 1.86 demonstrate strong liquidity. The firm also does not pay dividends, possibly due to reinvestment strategy or high growth, with no dividend yield reported.
Which one has the best ratios?
The Trade Desk has a more favorable overall ratio profile with 57.14% favorable metrics compared to Atlassian’s 35.71%. While The Trade Desk struggles with valuation multiples, its profitability, liquidity, and leverage ratios are stronger. Atlassian faces more unfavorable profitability and coverage ratios, leading to a slightly unfavorable global evaluation.
Strategic Positioning
This section compares the strategic positioning of Atlassian Corporation and The Trade Desk, Inc., including their market position, key segments, and exposure to disruption:
Atlassian Corporation
- Market leader in software applications with 31B market cap, facing moderate competitive pressure.
- Focused on software products for project management, collaboration, and developer tools driving revenue growth.
- Operates in software with diverse product portfolio, facing technological shifts in cloud and collaboration tools.
The Trade Desk, Inc.
- Mid-sized technology company with 17B market cap, operating in a competitive ad tech industry.
- Concentrated on a self-service platform for data-driven digital advertising campaigns across multiple channels.
- Exposed to rapid ad tech innovation and evolving digital advertising formats across devices and channels.
Atlassian Corporation vs The Trade Desk, Inc. Positioning
Atlassian pursues a diversified software product strategy across teams and developers, offering broad market coverage. The Trade Desk concentrates on digital advertising technology, creating a niche platform with focused business drivers. Diversification offers resilience; concentration can deliver specialized expertise.
Which has the best competitive advantage?
Both companies are shedding value with declining ROIC trends; Atlassian’s moat is very unfavorable, while The Trade Desk’s is slightly unfavorable, indicating neither currently sustains a strong competitive advantage based on recent MOAT evaluations.
Stock Comparison
The stock prices of Atlassian Corporation (TEAM) and The Trade Desk, Inc. (TTD) both experienced significant declines over the past 12 months, reflecting bearish trends and notable deceleration in price movements.
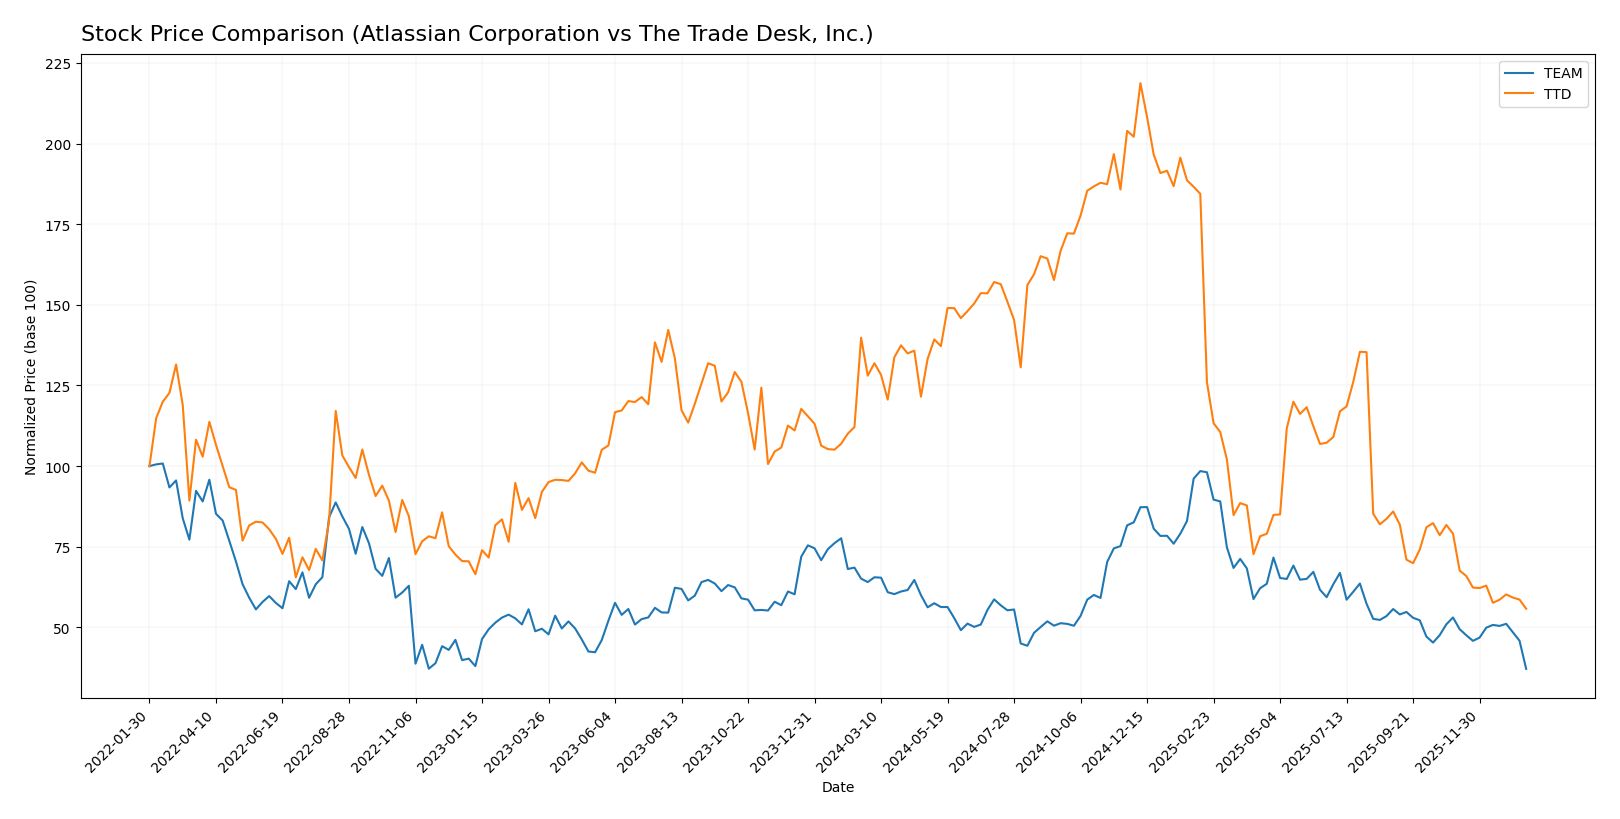
Trend Analysis
Atlassian Corporation’s stock showed a bearish trend over the past year with a price decline of 42.01%, accompanied by high volatility (std deviation 41.22) and a deceleration in the downward trend. Recent months reflect a continued decline of 30.03%.
The Trade Desk, Inc. experienced a steeper bearish trend, dropping 56.43% over the year, with moderate volatility (std deviation 28.36) and deceleration. Its recent decline was 29.44%, showing a slower slope compared to TEAM.
Comparing the two, Atlassian’s stock outperformed The Trade Desk by delivering a smaller percentage loss over the past year, despite both showing bearish trends and seller dominance in volume.
Target Prices
The consensus target prices for Atlassian Corporation and The Trade Desk, Inc. indicate varying analyst expectations.
| Company | Target High | Target Low | Consensus |
|---|---|---|---|
| Atlassian Corporation | 290 | 185 | 234.14 |
| The Trade Desk, Inc. | 98 | 39 | 56.73 |
Analysts expect Atlassian’s stock to trade significantly higher than its current price of $118.55, while The Trade Desk’s consensus target of $56.73 also suggests upside from the current $35.48. Overall, both stocks show potential growth according to expert forecasts.
Analyst Opinions Comparison
This section compares analysts’ ratings and grades for Atlassian Corporation and The Trade Desk, Inc.:
Rating Comparison
TEAM Rating
- Rating: C, considered very favorable overall.
- Discounted Cash Flow Score: 5, very favorable, indicating strong valuation.
- ROE Score: 1, very unfavorable, showing weak profit generation on equity.
- ROA Score: 1, very unfavorable, indicating poor asset utilization.
- Debt To Equity Score: 1, very unfavorable, suggesting high financial risk.
- Overall Score: 2, moderate overall financial standing.
TTD Rating
- Rating: B, considered very favorable overall.
- Discounted Cash Flow Score: 4, favorable, indicating good valuation.
- ROE Score: 4, favorable, showing efficient profit generation on equity.
- ROA Score: 4, favorable, indicating effective asset utilization.
- Debt To Equity Score: 3, moderate, indicating reasonable financial stability.
- Overall Score: 3, moderate overall financial standing.
Which one is the best rated?
Based strictly on the provided data, The Trade Desk, Inc. (TTD) is better rated than Atlassian Corporation (TEAM), showing stronger scores in discounted cash flow, profitability, and financial stability metrics.
Scores Comparison
Here is a comparison of the financial scores for Atlassian Corporation and The Trade Desk, Inc.:
TEAM Scores
- Altman Z-Score: 4.70, indicating a safe financial zone, low bankruptcy risk.
- Piotroski Score: 5, reflecting average financial strength and value potential.
TTD Scores
- Altman Z-Score: 4.30, indicating a safe financial zone, low bankruptcy risk.
- Piotroski Score: 5, reflecting average financial strength and value potential.
Which company has the best scores?
Both Atlassian and The Trade Desk have Altman Z-Scores in the safe zone, with Atlassian slightly higher. Their Piotroski Scores are identical at 5, indicating equal average financial strength.
Grades Comparison
Here is the comparison of recent grades and ratings for Atlassian Corporation and The Trade Desk, Inc.:
Atlassian Corporation Grades
This table summarizes the recent grades assigned by reputable grading companies for Atlassian Corporation.
| Grading Company | Action | New Grade | Date |
|---|---|---|---|
| BTIG | Maintain | Buy | 2026-01-13 |
| Piper Sandler | Maintain | Overweight | 2026-01-05 |
| Bernstein | Maintain | Outperform | 2025-11-18 |
| Macquarie | Maintain | Outperform | 2025-11-03 |
| Mizuho | Maintain | Outperform | 2025-10-31 |
| Bernstein | Maintain | Outperform | 2025-10-31 |
| TD Cowen | Maintain | Hold | 2025-10-27 |
| BMO Capital | Maintain | Outperform | 2025-10-24 |
| UBS | Maintain | Neutral | 2025-10-24 |
| Keybanc | Maintain | Overweight | 2025-10-23 |
Overall, Atlassian’s grades predominantly show a strong positive outlook, with multiple “Outperform” and “Buy” ratings, indicating consistent confidence by analysts.
The Trade Desk, Inc. Grades
This table presents the latest grades from established grading companies for The Trade Desk, Inc.
| Grading Company | Action | New Grade | Date |
|---|---|---|---|
| Morgan Stanley | Maintain | Equal Weight | 2026-01-13 |
| Wells Fargo | Maintain | Equal Weight | 2026-01-12 |
| Cantor Fitzgerald | Maintain | Neutral | 2026-01-08 |
| Wolfe Research | Maintain | Outperform | 2026-01-06 |
| Guggenheim | Maintain | Buy | 2026-01-05 |
| Jefferies | Maintain | Hold | 2025-12-11 |
| Wedbush | Maintain | Neutral | 2025-12-08 |
| DA Davidson | Maintain | Buy | 2025-11-10 |
| Truist Securities | Maintain | Buy | 2025-11-07 |
| Wells Fargo | Maintain | Equal Weight | 2025-11-07 |
The Trade Desk’s grades reflect a more mixed consensus, with a number of “Buy” ratings balanced by several “Equal Weight” and “Neutral” assessments.
Which company has the best grades?
Atlassian Corporation has received generally stronger grades, with multiple “Outperform” and “Buy” ratings, compared to The Trade Desk’s blend of “Buy” and “Equal Weight” grades. This suggests a more optimistic analyst outlook for Atlassian, potentially indicating stronger growth expectations or lower perceived risk.
Strengths and Weaknesses
Here is a comparative overview of the strengths and weaknesses of Atlassian Corporation (TEAM) and The Trade Desk, Inc. (TTD) based on recent financial performance, market positioning, and innovation metrics.
| Criterion | Atlassian Corporation (TEAM) | The Trade Desk, Inc. (TTD) |
|---|---|---|
| Diversification | Moderate: Revenue mainly from License and Service (approx. $4.93B in 2025) with some product/service variety but limited beyond core software offerings | Limited product segmentation data; primarily focused on digital advertising technology |
| Profitability | Weak: Negative net margin (-4.92%), negative ROIC (-4.48%), and declining profitability with unfavorable ROE (-19.08%) | Stronger: Positive net margin (16.08%), favorable ROIC (10.02%), though ROIC trend slightly declining |
| Innovation | Moderate: Maintains significant product development and service offerings but profitability challenges suggest execution issues | High: Maintains competitive edge in ad tech with strong profitability metrics |
| Global presence | Strong: Well-established global software presence but facing value destruction concerns | Strong: Global ad platform with efficient capital use, though some financial ratios like asset turnover are less favorable |
| Market Share | Significant in collaboration software but facing value erosion and negative market sentiment (high PB ratio 39.51) | Growing presence in digital advertising with favorable liquidity and leverage ratios, but high valuation multiples (PE 146.77) |
Key takeaways: Atlassian struggles with profitability and value creation despite strong market presence and product diversity, indicating risk in investment. The Trade Desk shows better profitability and operational efficiency, yet its high valuation and slightly declining ROIC trend require cautious monitoring.
Risk Analysis
Below is a comparative risk table for Atlassian Corporation (TEAM) and The Trade Desk, Inc. (TTD) based on the latest 2025-2026 data:
| Metric | Atlassian Corporation (TEAM) | The Trade Desk, Inc. (TTD) |
|---|---|---|
| Market Risk | Beta 0.89 (moderate volatility) | Beta 1.11 (higher volatility) |
| Debt level | Debt/Equity 0.92 (neutral) | Debt/Equity 0.11 (low risk) |
| Regulatory Risk | Moderate (operates globally, subject to various regulations) | Moderate (US-focused, digital ad regulations evolving) |
| Operational Risk | Medium (complex software ecosystem) | Medium (platform reliant on ad market) |
| Environmental Risk | Low (software sector, minimal direct impact) | Low (software sector, minimal direct impact) |
| Geopolitical Risk | Moderate (headquartered in Australia, global exposure) | Moderate (US-based, global ad clients) |
The most likely and impactful risks are market volatility and regulatory changes. TEAM’s higher debt and negative profitability metrics increase financial risk, while TTD benefits from lower leverage but faces challenges from high valuation multiples and evolving digital ad regulations. Both companies maintain solid financial stability with Altman Z-Scores in the safe zone, indicating low bankruptcy risk.
Which Stock to Choose?
Atlassian Corporation (TEAM) has shown favorable income growth with a 19.7% revenue increase in 2025 and overall positive income metrics. However, its profitability ratios including ROE at -19.08% and net margin at -4.92% remain unfavorable. The company carries moderate debt levels with a debt-to-assets ratio of 20.51% and a neutral to slightly unfavorable global financial ratio evaluation. Its rating is very favorable overall, despite mixed component scores.
The Trade Desk, Inc. (TTD) exhibits strong income growth with 25.6% revenue growth in 2024 and robust profitability, including a 16.08% net margin and 13.33% ROE. Financial ratios are mostly favorable, with low debt levels, a debt-to-assets ratio of 5.11%, and a favorable global ratio opinion. TTD holds a very favorable rating with generally positive financial scores but a high P/E ratio as an unfavorable aspect.
Considering ratings and comprehensive evaluations, TTD might appear more favorable for investors seeking profitability and financial stability, while TEAM could be more aligned with those tolerating higher risk amid improving income trends. Investors focused on growth might find TEAM’s revenue expansion attractive, whereas those prioritizing consistent profitability and lower leverage might lean toward TTD.
Disclaimer: Investment carries a risk of loss of initial capital. The past performance is not a reliable indicator of future results. Be sure to understand risks before making an investment decision.
Go Further
I encourage you to read the complete analyses of Atlassian Corporation and The Trade Desk, Inc. to enhance your investment decisions: