Atlassian Corporation and ServiceTitan, Inc. are two prominent players in the software application industry, each driving innovation in distinct yet overlapping market segments. Atlassian excels in collaborative project management tools, while ServiceTitan focuses on field service software for residential and commercial maintenance. Comparing these companies offers valuable insights into their growth potential and strategic positioning. Join me as we explore which of these tech firms presents the most compelling opportunity for investors in 2026.
Table of contents
Companies Overview
I will begin the comparison between Atlassian Corporation and ServiceTitan, Inc. by providing an overview of these two companies and their main differences.
Atlassian Corporation Overview
Atlassian Corporation, headquartered in Sydney, Australia, designs and develops software products that enhance team collaboration and project management. Its portfolio includes well-known tools such as Jira, Confluence, and Trello, aimed at connecting technical and business teams. Founded in 2002, Atlassian serves a global market with a focus on improving workflow efficiency and enterprise agility.
ServiceTitan, Inc. Overview
ServiceTitan, based in Glendale, California, provides software solutions that support field service operations for residential and commercial infrastructure maintenance. Founded in 2008, the company specializes in managing service activities such as installation and upkeep. ServiceTitan focuses on helping service teams streamline their operations through technology tailored to fieldwork.
Key similarities and differences
Both Atlassian and ServiceTitan operate in the software application industry within the technology sector, offering solutions that enhance operational efficiency. Atlassian targets broad project management and collaboration needs across industries, while ServiceTitan concentrates on field service management for infrastructure. Atlassian has a significantly larger market capitalization and workforce, reflecting its broader product range and global reach compared to ServiceTitan’s more specialized focus.
Income Statement Comparison
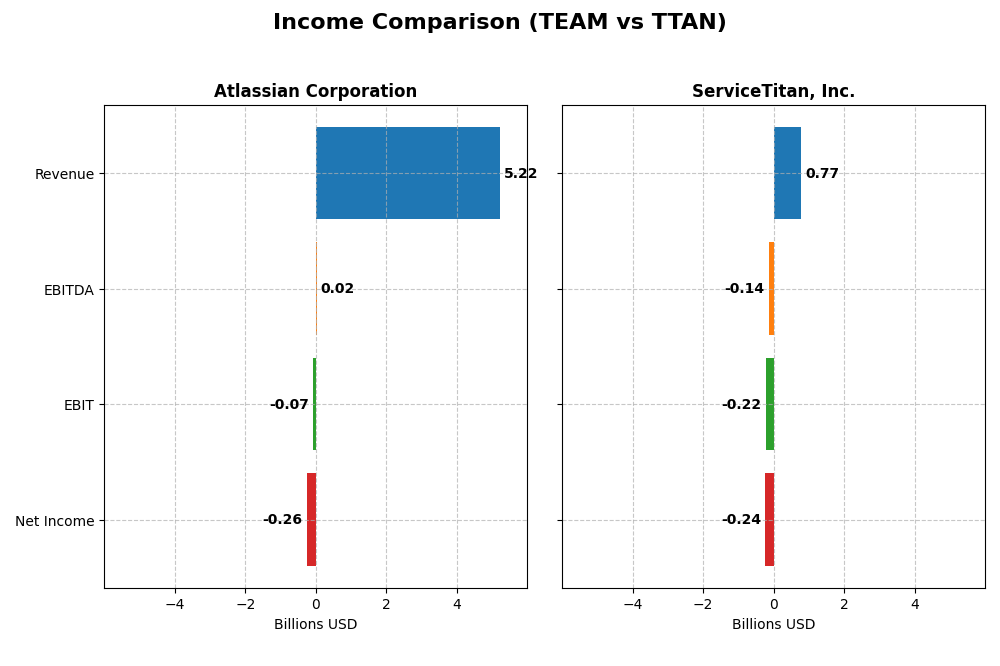
The table below presents a side-by-side comparison of the most recent fiscal year income statement metrics for Atlassian Corporation and ServiceTitan, Inc., reflecting their financial performance in 2025.
| Metric | Atlassian Corporation | ServiceTitan, Inc. |
|---|---|---|
| Market Cap | 31.1B | 8.5B |
| Revenue | 5.22B | 772M |
| EBITDA | 24.0M | -141.0M |
| EBIT | -68.3M | -221.3M |
| Net Income | -257.0M | -239.1M |
| EPS | -0.98 | -8.53 |
| Fiscal Year | 2025 | 2025 |
Income Statement Interpretations
Atlassian Corporation
Atlassian’s revenue increased significantly from $2.1B in 2021 to $5.2B in 2025, with net losses narrowing from -$579M to -$257M. Gross margins remained strong and favorable around 82.8%, but operating and net margins stayed negative, despite recent improvement. The 2025 fiscal year showed revenue growth of 19.7%, gross profit up 21.5%, and net margin growth of 28.6%, signaling improving profitability trends.
ServiceTitan, Inc.
ServiceTitan’s revenue rose from $468M in 2023 to $772M in 2025, reflecting steady growth, while net losses also narrowed from -$283M to -$240M. The company maintained a favorable gross margin near 64.9%, yet operating and net margins were deeply negative, with slight net margin improvement in 2025. Despite a 25.6% revenue increase in 2025, EPS declined sharply, indicating ongoing profitability challenges.
Which one has the stronger fundamentals?
Atlassian exhibits stronger fundamentals with higher revenue scale, better gross margins, and more consistent improvement in net income and EPS over the period. ServiceTitan shows solid growth but faces larger relative losses and deteriorating EPS. Both firms have unfavorable operating margins, yet Atlassian’s larger market cap and margin trends suggest comparatively stronger income statement fundamentals.
Financial Ratios Comparison
The table below compares key financial ratios for Atlassian Corporation (TEAM) and ServiceTitan, Inc. (TTAN) based on their most recent fiscal year data.
| Ratios | Atlassian Corporation (TEAM) FY 2025 | ServiceTitan, Inc. (TTAN) FY 2025 |
|---|---|---|
| ROE | -19.1% | -16.4% |
| ROIC | -4.48% | -14.1% |
| P/E | -207.1 | -18.1 |
| P/B | 39.5 | 3.0 |
| Current Ratio | 1.22 | 3.74 |
| Quick Ratio | 1.22 | 3.74 |
| D/E | 0.92 | 0.11 |
| Debt-to-Assets | 20.5% | 9.4% |
| Interest Coverage | -4.27 | -14.8 |
| Asset Turnover | 0.86 | 0.44 |
| Fixed Asset Turnover | 19.0 | 9.6 |
| Payout ratio | 0 | 0 |
| Dividend yield | 0% | 0% |
Interpretation of the Ratios
Atlassian Corporation
Atlassian shows several unfavorable profitability ratios, with a net margin of -4.92%, ROE at -19.08%, and ROIC at -4.48%, indicating ongoing losses and weak returns. Liquidity and leverage ratios are mixed, with a neutral current ratio of 1.22 and favorable debt-to-assets at 20.51%. The company does not pay dividends, likely reflecting reinvestment in growth and R&D priorities.
ServiceTitan, Inc.
ServiceTitan also displays weak profitability with a net margin of -30.98%, ROE at -16.44%, and ROIC at -14.11%, showing significant losses. Liquidity ratios are mixed; the current ratio is high at 3.74 but considered unfavorable, while the quick ratio and debt-to-equity are favorable, indicating solid liquidity and low leverage. ServiceTitan does not pay dividends, likely focusing on reinvestment and expansion.
Which one has the best ratios?
Both companies face profitability challenges with negative margins and returns. Atlassian has a slightly better balance between liquidity and leverage, while ServiceTitan exhibits stronger liquidity but weaker asset efficiency and higher unfavorable ratios. Both are assessed as slightly unfavorable overall, reflecting notable risks in their financial profiles.
Strategic Positioning
This section compares the strategic positioning of Atlassian Corporation and ServiceTitan, including Market position, Key segments, and disruption:
Atlassian Corporation
- Leading software application provider with 31B market cap facing typical tech sector competition.
- Focus on diverse software products: project management, collaboration, code management, and service desk solutions.
- Exposure to technological disruption through continual product innovation across software development and collaboration tools.
ServiceTitan, Inc.
- Smaller software application company with 8.5B market cap, operating in field service software.
- Concentrates on field service platform and subscription revenue for residential and commercial infrastructure services.
- Faces technological disruption risks related to field service software and platform integration innovations.
Atlassian Corporation vs ServiceTitan, Inc. Positioning
Atlassian pursues a diversified strategy across software segments supporting development, collaboration, and service management, offering broad market applications. ServiceTitan concentrates on a niche in field service software, focusing on platform and subscription revenues. Atlassian’s scale contrasts with ServiceTitan’s more focused approach, impacting competitive dynamics and growth drivers.
Which has the best competitive advantage?
Both companies currently shed value as their ROIC is below WACC; Atlassian shows a very unfavorable declining profitability, while ServiceTitan has a stable but unfavorable value destruction, indicating limited competitive moat for both.
Stock Comparison
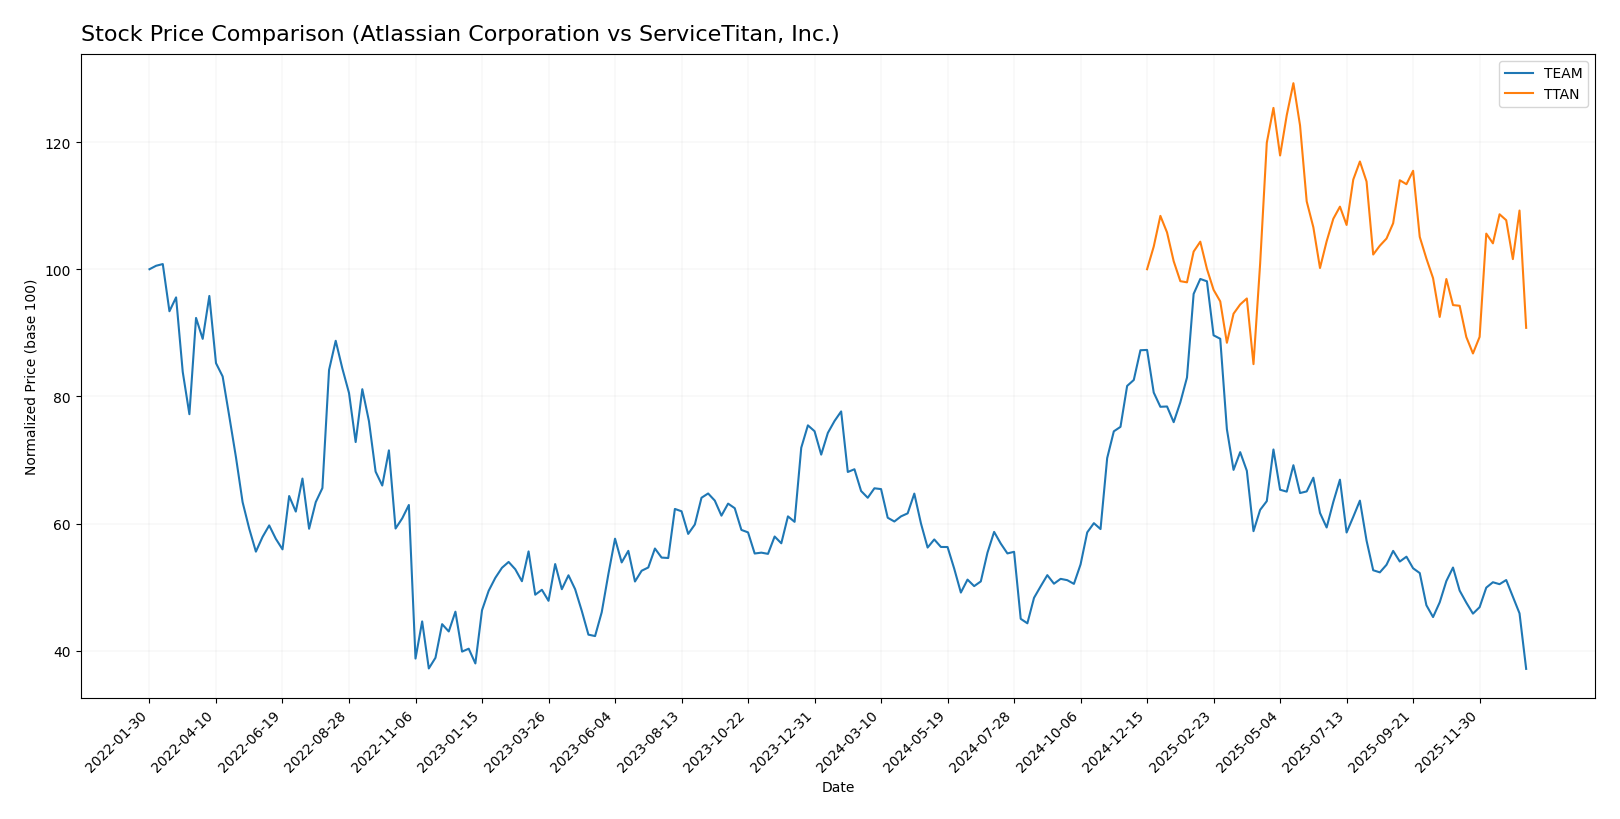
The stock price movements of Atlassian Corporation and ServiceTitan, Inc. over the past 12 months reveal distinct bearish trends with varying degrees of decline and trading activity shifts.
Trend Analysis
Atlassian Corporation (TEAM) experienced a -42.01% price drop over the past year, indicating a strong bearish trend with deceleration. The stock reached a high of 314.28 and a low of 118.55, showing significant volatility (std deviation 41.22).
ServiceTitan, Inc. (TTAN) showed a -9.22% decrease in price over the same period, also bearish but with accelerating downward momentum. Its price fluctuated between 85.07 and 129.26, with lower volatility (std deviation 9.86).
Comparing both, TEAM’s stock underperformed TTAN’s, delivering the lowest market performance amid higher volatility and a more pronounced bearish trend.
Target Prices
The target consensus for Atlassian Corporation and ServiceTitan, Inc. reflects optimistic analyst expectations for both stocks.
| Company | Target High | Target Low | Consensus |
|---|---|---|---|
| Atlassian Corporation | 290 | 185 | 234.14 |
| ServiceTitan, Inc. | 145 | 117 | 132.44 |
Analysts expect significant upside for Atlassian, with the consensus target nearly double its current price of 118.55 USD. ServiceTitan’s target consensus also suggests a strong potential gain from its current price around 90.78 USD.
Analyst Opinions Comparison
This section compares analysts’ ratings and grades for Atlassian Corporation and ServiceTitan, Inc.:
Rating Comparison
Atlassian Corporation Rating
- Rating: C, assessed as Very Favorable
- Discounted Cash Flow Score: 5, indicating Very Favorable
- ROE Score: 1, classified as Very Unfavorable
- ROA Score: 1, Very Unfavorable
- Debt To Equity Score: 1, Very Unfavorable
- Overall Score: 2, Moderate
ServiceTitan, Inc. Rating
- Rating: C-, also considered Very Favorable
- Discounted Cash Flow Score: 1, marked Very Unfavorable
- ROE Score: 1, also Very Unfavorable
- ROA Score: 1, Very Unfavorable
- Debt To Equity Score: 3, considered Moderate
- Overall Score: 1, Very Unfavorable
Which one is the best rated?
Atlassian Corporation holds a higher overall score and a significantly better discounted cash flow score than ServiceTitan. However, both companies share very unfavorable scores in ROE and ROA, with ServiceTitan showing a more moderate debt-to-equity score.
Scores Comparison
Here is a comparison of the Altman Z-Score and Piotroski Score for the two companies:
Atlassian Corporation Scores
- Altman Z-Score: 4.70, indicating a safe zone from bankruptcy risk.
- Piotroski Score: 5, representing an average financial strength.
ServiceTitan, Inc. Scores
- Altman Z-Score: 15.74, strongly in the safe zone from bankruptcy risk.
- Piotroski Score: 6, indicating a slightly stronger than average financial health.
Which company has the best scores?
ServiceTitan shows a higher Altman Z-Score and a better Piotroski Score than Atlassian, reflecting stronger financial stability and slightly better financial health based on the provided data.
Grades Comparison
Here is a detailed comparison of the most recent grades awarded to Atlassian Corporation and ServiceTitan, Inc.:
Atlassian Corporation Grades
This table summarizes the latest grades from reputable grading companies for Atlassian Corporation:
| Grading Company | Action | New Grade | Date |
|---|---|---|---|
| BTIG | Maintain | Buy | 2026-01-13 |
| Piper Sandler | Maintain | Overweight | 2026-01-05 |
| Bernstein | Maintain | Outperform | 2025-11-18 |
| Macquarie | Maintain | Outperform | 2025-11-03 |
| Mizuho | Maintain | Outperform | 2025-10-31 |
| Bernstein | Maintain | Outperform | 2025-10-31 |
| TD Cowen | Maintain | Hold | 2025-10-27 |
| BMO Capital | Maintain | Outperform | 2025-10-24 |
| UBS | Maintain | Neutral | 2025-10-24 |
| Keybanc | Maintain | Overweight | 2025-10-23 |
Atlassian’s grades predominantly indicate strong positive sentiment, with multiple “Outperform” and “Buy” ratings and no downgrades in recent months.
ServiceTitan, Inc. Grades
This table details the latest grades from recognized grading firms for ServiceTitan, Inc.:
| Grading Company | Action | New Grade | Date |
|---|---|---|---|
| Piper Sandler | Maintain | Overweight | 2025-12-05 |
| BMO Capital | Maintain | Outperform | 2025-12-05 |
| TD Cowen | Maintain | Buy | 2025-12-05 |
| Morgan Stanley | Maintain | Equal Weight | 2025-12-05 |
| BMO Capital | Maintain | Outperform | 2025-11-20 |
| Wells Fargo | Maintain | Overweight | 2025-09-19 |
| Stifel | Maintain | Buy | 2025-09-19 |
| Piper Sandler | Maintain | Overweight | 2025-09-19 |
| Canaccord Genuity | Maintain | Buy | 2025-09-19 |
| Citigroup | Maintain | Neutral | 2025-09-09 |
ServiceTitan’s ratings are largely favorable, reflecting consistent “Buy,” “Overweight,” and “Outperform” recommendations, tempered by a few “Equal Weight” and “Neutral” opinions.
Which company has the best grades?
Both Atlassian Corporation and ServiceTitan, Inc. hold predominantly positive grades, with consensus “Buy” ratings. Atlassian has a slightly higher frequency of “Outperform” grades, while ServiceTitan shows a balanced mix of “Buy” and “Overweight” ratings. Investors may interpret these patterns to gauge relative analyst confidence and potential risk profiles.
Strengths and Weaknesses
Below is a comparative overview of key strengths and weaknesses for Atlassian Corporation (TEAM) and ServiceTitan, Inc. (TTAN) based on the most recent financial performance and market data.
| Criterion | Atlassian Corporation (TEAM) | ServiceTitan, Inc. (TTAN) |
|---|---|---|
| Diversification | Moderate revenue streams focused on software licenses and services, growing License and Service revenue of $4.93B in 2025 | Revenue mainly from platform and subscription, total $1.31B in 2025, less diversified product base |
| Profitability | Negative net margin (-4.92%), negative ROIC (-4.48%), shedding value with declining profitability | Larger losses with net margin at -30.98%, ROIC at -14.11%, also shedding value but with stable ROIC trend |
| Innovation | Strong product development reflected in high fixed asset turnover (19.02) and ongoing license/service growth | Moderate innovation indicators, with lower asset turnover (0.44) but stable subscription growth |
| Global presence | Broad global reach typical of SaaS leaders, though profitability challenges persist | Growing presence in service management platforms, but smaller scale and less global penetration |
| Market Share | Significant market share in collaboration/software tools but challenged by competition and valuation concerns (high PB 39.51) | Smaller market share in niche service software market, with more conservative valuation (PB 2.98) |
Key takeaways: Both companies currently face profitability challenges and are shedding value, with Atlassian showing a sharper decline in returns on invested capital. Atlassian benefits from stronger diversification and innovation metrics, while ServiceTitan maintains a more stable but smaller footprint. Caution is advised given their negative profitability and valuation risks.
Risk Analysis
Below is a comparison of key risks for Atlassian Corporation (TEAM) and ServiceTitan, Inc. (TTAN) based on the most recent 2025 financial data and market conditions:
| Metric | Atlassian Corporation (TEAM) | ServiceTitan, Inc. (TTAN) |
|---|---|---|
| Market Risk | Moderate (Beta 0.89, price down 7.7%) | Moderate (Beta -0.85, slight price increase 0.74%) |
| Debt level | Moderate (Debt-to-Equity 0.92, debt/assets 20.5%) | Low (Debt-to-Equity 0.11, debt/assets 9.35%) |
| Regulatory Risk | Moderate, operating globally including Australia with evolving data security laws | Moderate, US-focused with potential regulatory changes in field service software |
| Operational Risk | Moderate, complex product portfolio and integration challenges | Moderate, smaller scale but dependent on field service market growth |
| Environmental Risk | Low, primarily software with limited direct environmental impact | Low, software-based with limited environmental footprint |
| Geopolitical Risk | Moderate, exposure to Australia and global markets | Moderate, US-centric but also exposed to international trade tensions |
The most likely and impactful risks are market volatility and operational challenges. Atlassian faces pressure from a notable recent share price decline and unfavorable profitability ratios, while ServiceTitan, though smaller, struggles with very negative margins and asset turnover. Both remain in the safe zone for bankruptcy risk but show average financial strength, warranting cautious risk management.
Which Stock to Choose?
Atlassian Corporation (TEAM) shows strong revenue growth of 149.64% over 2021-2025 with favorable gross margin at 82.84%, but struggles with negative profitability ratios including ROE at -19.08% and net margin at -4.92%. Its debt position is moderate with a debt-to-assets ratio of 20.51%, and the overall rating is very favorable despite some financial weaknesses. The company is currently destroying value as ROIC is below WACC with a declining trend, indicating decreased profitability.
ServiceTitan, Inc. (TTAN) also exhibits revenue growth of 65.02% over 2023-2025 and a gross margin of 64.9%, yet suffers from more pronounced negative profitability metrics such as ROE at -16.44% and net margin at -30.98%. Its debt load is lighter with a debt-to-assets ratio of 9.35%, and the rating is very favorable but with a very unfavorable overall score. The firm is shedding value as ROIC remains below WACC, though its profitability trend appears stable.
Investors focused on growth might find Atlassian’s stronger income growth and favorable rating appealing, while those prioritizing a more stable debt profile and less volatile profitability might see ServiceTitan as more suitable. Overall, both stocks show value destruction and bear risks that cautious investors may wish to weigh carefully.
Disclaimer: Investment carries a risk of loss of initial capital. The past performance is not a reliable indicator of future results. Be sure to understand risks before making an investment decision.
Go Further
I encourage you to read the complete analyses of Atlassian Corporation and ServiceTitan, Inc. to enhance your investment decisions: