Home > Comparison > Technology > NOW vs TEAM
The strategic rivalry between ServiceNow, Inc. and Atlassian Corporation defines the current trajectory of the enterprise software sector. ServiceNow operates as a capital-intensive cloud workflow automation leader, while Atlassian excels as a high-margin collaborative software innovator. This head-to-head pits scale and operational breadth against agility and product diversity. This analysis aims to determine which corporate trajectory offers superior risk-adjusted returns for a diversified technology portfolio.
Table of contents
Companies Overview
ServiceNow and Atlassian stand as influential players in the enterprise software market, shaping digital workflows globally.
ServiceNow, Inc.: Leader in Enterprise Workflow Automation
ServiceNow dominates the enterprise cloud computing space by automating workflows across IT, HR, legal, and customer service. Its Now platform integrates AI, machine learning, and robotic process automation to streamline operations. In 2026, it strategically deepened partnerships like Celonis to enhance process automation prioritization and broadened its industry-specific solutions.
Atlassian Corporation: Pioneer in Collaborative Software Solutions
Atlassian specializes in collaborative software that connects technical and business teams through products like Jira, Trello, and Confluence. Its revenue stems from licensing and cloud subscriptions that enable agile project management and service delivery. Atlassian’s 2026 focus remains on expanding enterprise agility tools alongside enhanced security and developer experience platforms.
Strategic Collision: Similarities & Divergences
Both companies drive operational efficiency but diverge in approach: ServiceNow builds a comprehensive workflow ecosystem, while Atlassian emphasizes an open suite of collaboration tools. Their primary battleground is enterprise digital transformation, targeting IT and business process orchestration. Investors face distinct profiles—ServiceNow’s scale and automation leadership versus Atlassian’s innovation in team productivity and developer tools.
Income Statement Comparison
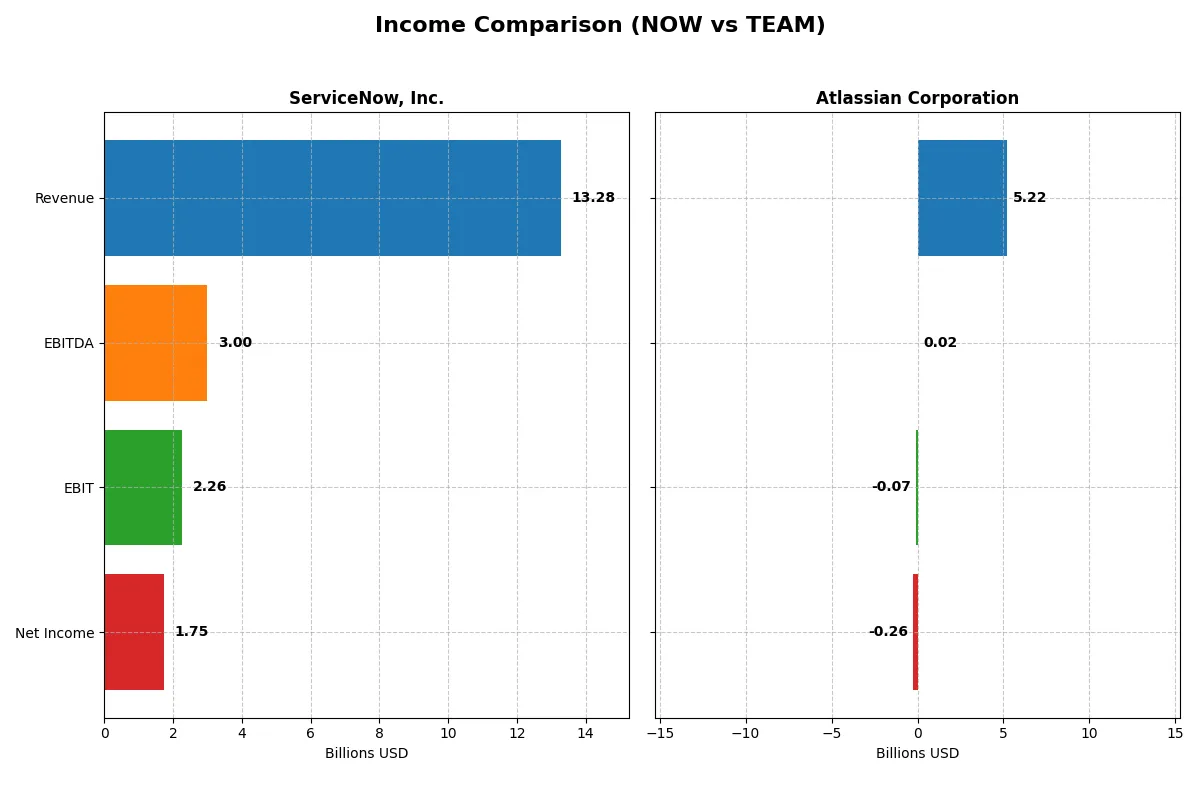
This data dissects the core profitability and scalability of both corporate engines to reveal who dominates the bottom line:
| Metric | ServiceNow, Inc. (NOW) | Atlassian Corporation (TEAM) |
|---|---|---|
| Revenue | 13.3B | 5.2B |
| Cost of Revenue | 3.0B | 895M |
| Operating Expenses | 8.5B | 4.5B |
| Gross Profit | 10.3B | 4.3B |
| EBITDA | 3.0B | 24M |
| EBIT | 2.3B | -68M |
| Interest Expense | 0 | 31M |
| Net Income | 1.7B | -257M |
| EPS | 1.69 | -0.98 |
| Fiscal Year | 2025 | 2025 |
Income Statement Analysis: The Bottom-Line Duel
This income statement comparison reveals which company converts revenue into profit most efficiently and sustains healthy margins over time.
ServiceNow, Inc. Analysis
ServiceNow’s revenue surged from 5.9B in 2021 to 13.3B in 2025, with net income rising from 230M to 1.75B, signaling robust growth. Its gross margin holds strong at 77.5%, while the net margin remains favorable at 13.2%. The 2025 results display accelerating operating income and an improving EBIT margin, reflecting efficient cost management and scaling momentum.
Atlassian Corporation Analysis
Atlassian’s revenue climbed from 2.1B in 2021 to 5.2B in mid-2025, with net losses narrowing from -579M to -257M. The company boasts a higher gross margin at 82.8%, yet it struggles with negative EBIT (-1.3%) and net margins (-4.9%). Despite revenue and gross profit growth, operating expenses outpace gains, weighing on profitability and indicating ongoing investments or inefficiencies.
Margin Mastery vs. Growth Struggles
ServiceNow demonstrates superior margin control and consistent profitability, with a rising net margin and strong EBIT growth. Atlassian, while growing revenue rapidly and maintaining excellent gross margins, still faces fundamental profitability challenges. For investors prioritizing solid earnings and margin sustainability, ServiceNow offers a more attractive profile given its clear path to scalable profits.
Financial Ratios Comparison
These vital ratios act as a diagnostic tool to expose the underlying fiscal health, valuation premiums, and capital efficiency of the companies analyzed:
| Ratios | ServiceNow, Inc. (NOW) | Atlassian Corporation (TEAM) |
|---|---|---|
| ROE | 13.5% | -19.1% |
| ROIC | 9.0% | -4.5% |
| P/E | 90.9 | -207.1 |
| P/B | 12.3 | 39.5 |
| Current Ratio | 0.95 | 1.22 |
| Quick Ratio | 0.95 | 1.22 |
| D/E | 0.25 | 0.92 |
| Debt-to-Assets | 12.3% | 20.5% |
| Interest Coverage | 0 | -4.3 |
| Asset Turnover | 0.51 | 0.86 |
| Fixed Asset Turnover | 4.29 | 19.02 |
| Payout Ratio | 0 | 0 |
| Dividend Yield | 0 | 0 |
| Fiscal Year | 2025 | 2025 |
Efficiency & Valuation Duel: The Vital Signs
Financial ratios serve as a company’s DNA, exposing hidden risks and operational strengths that shape investor outcomes.
ServiceNow, Inc.
ServiceNow posts a moderate ROE of 13.48% and a net margin of 13.16%, indicating solid profitability. Its P/E ratio at 90.88 signals a stretched valuation, while P/S remains high. The firm refrains from dividends, instead channeling cash into robust R&D and growth, aiming to fuel long-term shareholder value.
Atlassian Corporation
Atlassian shows negative profitability with a -19.08% ROE and a -4.92% net margin, reflecting operational challenges. Despite a negative P/E, its P/B ratio at 39.51 is expensive. The company pays no dividends, opting to invest heavily in R&D for future growth, though this strategy carries heightened risk given current financials.
Premium Valuation vs. Operational Safety
ServiceNow balances profitability with a premium valuation, presenting moderate risk and reward. Atlassian’s negative returns and costly valuation contrast sharply, increasing risk without current profitability. Investors prioritizing stability may lean towards ServiceNow, while those seeking growth and able to tolerate volatility might consider Atlassian’s profile.
Which one offers the Superior Shareholder Reward?
ServiceNow (NOW) and Atlassian (TEAM) both forgo dividends, focusing on reinvestment and buybacks. NOW delivers strong free cash flow (4.4/share) and modest buybacks, sustaining growth with a 0% payout ratio. TEAM also avoids dividends but boasts higher free cash flow (5.4/share) and more aggressive buybacks. However, TEAM’s persistent net losses and negative profit margins raise sustainability concerns. I see NOW’s disciplined capital allocation and positive margins as offering a more reliable total return profile in 2026.
Comparative Score Analysis: The Strategic Profile
The radar chart reveals the fundamental DNA and trade-offs of both firms, highlighting their financial strengths and valuation challenges:
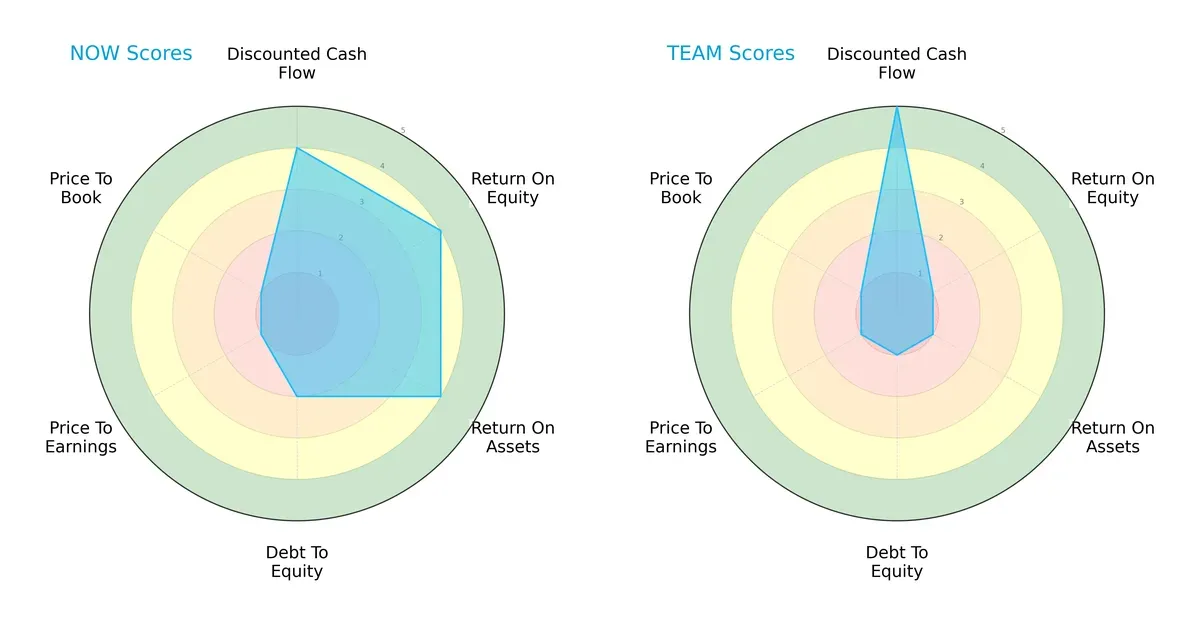
ServiceNow demonstrates a balanced profile with strong DCF, ROE, and ROA scores, signaling efficient capital use and profitability. Atlassian excels in discounted cash flow but lags significantly in return metrics and leverage, relying heavily on future growth expectations. ServiceNow’s moderate debt-to-equity score contrasts with Atlassian’s weak financial stability indicators.
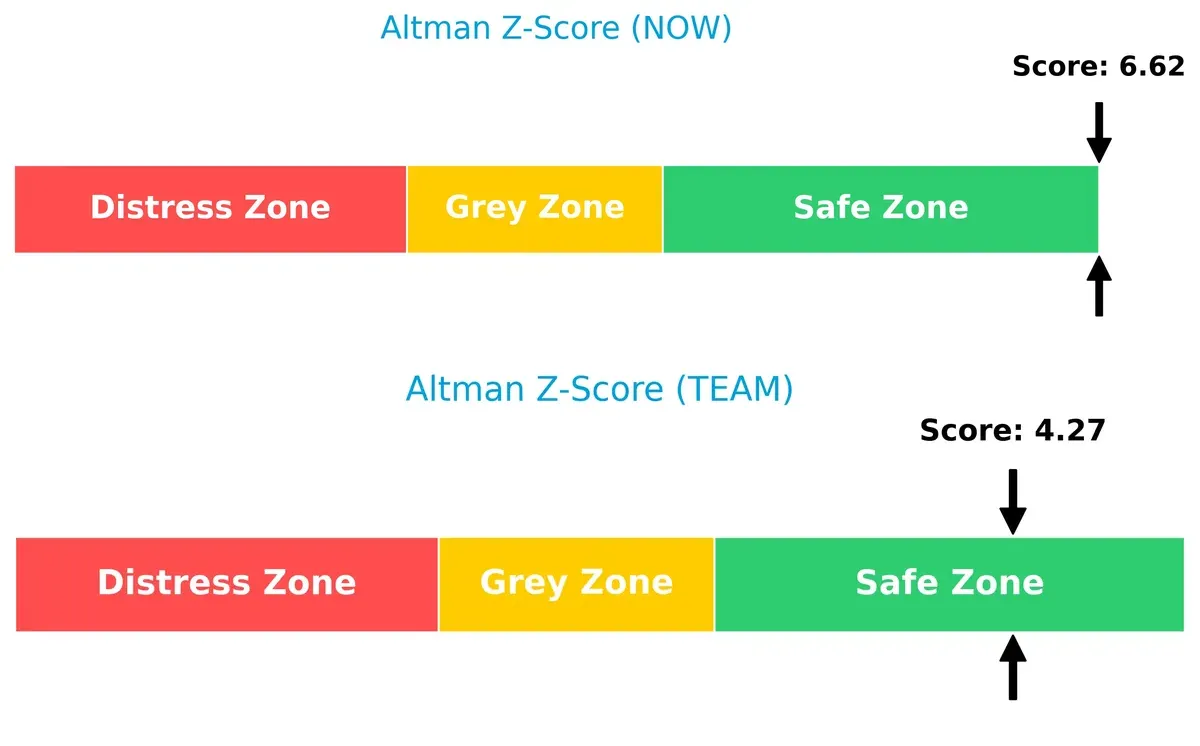
Bankruptcy Risk: Solvency Showdown
ServiceNow’s Altman Z-Score of 6.62 versus Atlassian’s 4.27 places both companies safely above distress levels, but ServiceNow enjoys a wider solvency margin, implying better resilience in economic downturns:
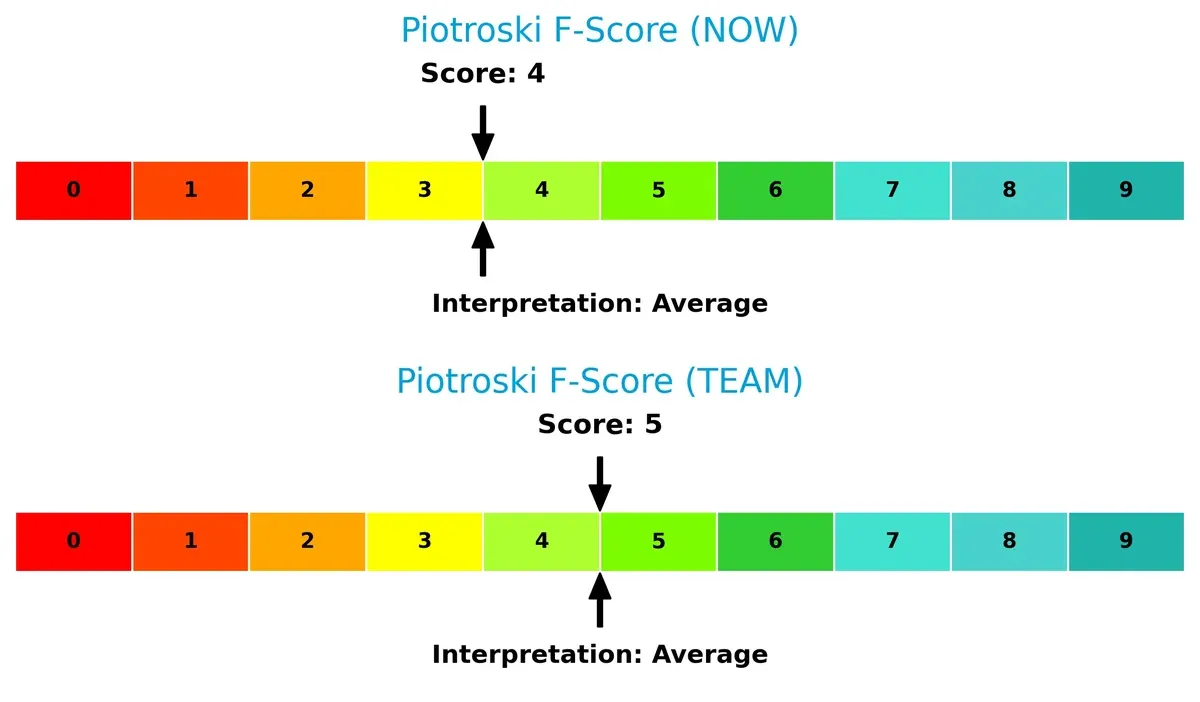
Financial Health: Quality of Operations
ServiceNow’s Piotroski F-Score of 4 and Atlassian’s 5 both indicate average operational quality. Neither company shows peak financial health, but Atlassian’s marginally higher score suggests a slightly better internal metric consistency:
How are the two companies positioned?
This section dissects the operational DNA of ServiceNow and Atlassian by comparing their revenue distribution and internal dynamics. The goal is to confront their economic moats to reveal which model delivers a more resilient, sustainable advantage today.
Revenue Segmentation: The Strategic Mix
The following visual comparison dissects how both firms diversify their income streams and where their primary sector bets lie:
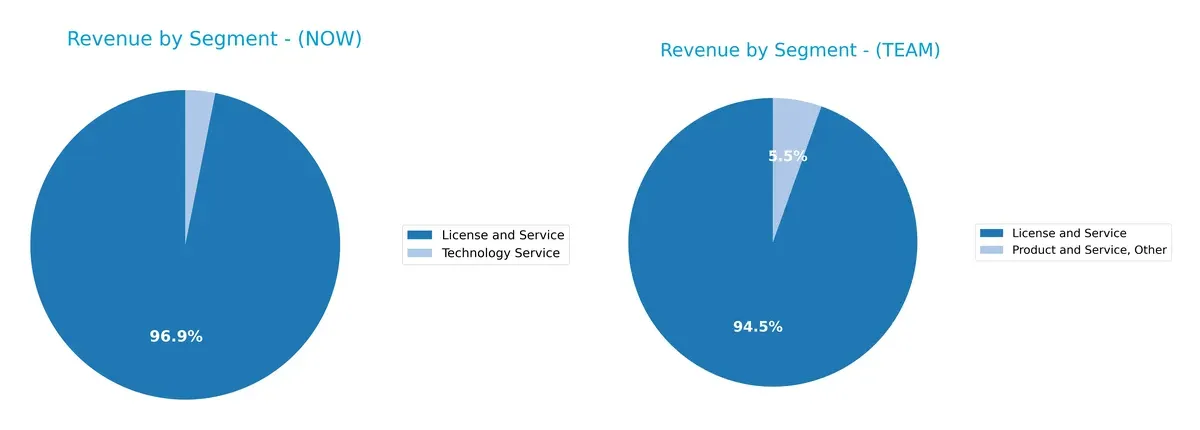
ServiceNow anchors its revenue predominantly in License and Service, totaling $12.9B in 2025, with Technology Service trailing at $414M. Atlassian, generating $4.9B from License and Service and $285M from Product and Service, Other, shows a broader mix but still leans heavily on licensing. ServiceNow’s concentration signals strong ecosystem lock-in, while Atlassian’s diversification reduces concentration risk but may dilute infrastructure dominance.
Strengths and Weaknesses Comparison
This table compares the Strengths and Weaknesses of ServiceNow, Inc. and Atlassian Corporation:
ServiceNow Strengths
- Strong net margin at 13.16%
- Favorable debt metrics with 0.25 debt/equity
- High fixed asset turnover at 4.29
- Significant global presence with $8.3B North America revenue
- Diverse product revenue streams exceeding $12B
- Slightly favorable overall financial ratios
Atlassian Strengths
- Favorable weighted average cost of capital at 7.8%
- High fixed asset turnover at 19.02
- Favorable quick ratio at 1.22
- Debt to assets at 20.51% is favorable
- Expanding global revenues across Americas and EMEA
- Diverse revenue streams near $5B
ServiceNow Weaknesses
- Unfavorable high P/E ratio at 90.88
- Low current ratio below 1 at 0.95
- Price to book ratio elevated at 12.25
- No dividend yield
- Neutral ROIC close to WACC at 8.98%
- Neutral asset turnover at 0.51
Atlassian Weaknesses
- Negative profitability with net margin -4.92%
- Negative ROE at -19.08% and ROIC at -4.48%
- Unfavorable interest coverage at -2.24
- High price to book ratio at 39.51
- No dividend yield
- Slightly unfavorable overall financial ratios
Both companies show strengths in asset efficiency and global reach but diverge sharply in profitability and financial stability. ServiceNow’s profitability and debt management stand out, while Atlassian struggles with negative returns and interest coverage, which may pressure its strategic financial decisions.
The Moat Duel: Analyzing Competitive Defensibility
A structural moat is the only true shield guarding long-term profits from relentless competitive erosion. Let’s examine how these two software giants defend their turf:
ServiceNow, Inc.: Workflow Automation with Expanding Profitability
ServiceNow’s moat stems from its high switching costs embedded in enterprise workflow automation. Its growing ROIC and strong 77.5% gross margin show stable pricing power. New AI-driven features in 2026 could deepen this advantage.
Atlassian Corporation: Collaboration Platform Facing Profitability Challenges
Atlassian relies on network effects from its suite of team collaboration tools, contrasting ServiceNow’s switching-cost moat. However, declining ROIC and negative EBIT margin reveal profit pressures. Expansion into enterprise agility offers growth but risks margin dilution.
Verdict: Switching Costs vs. Network Effects in Profit Sustainability
ServiceNow’s expanding profitability and rising ROIC indicate a wider, more sustainable moat than Atlassian’s shrinking returns. I see ServiceNow as better positioned to defend market share amid intensifying competition.
Which stock offers better returns?
The past year saw both ServiceNow and Atlassian stocks decline sharply, with persistent seller dominance and decelerating downward trends shaping trading dynamics.
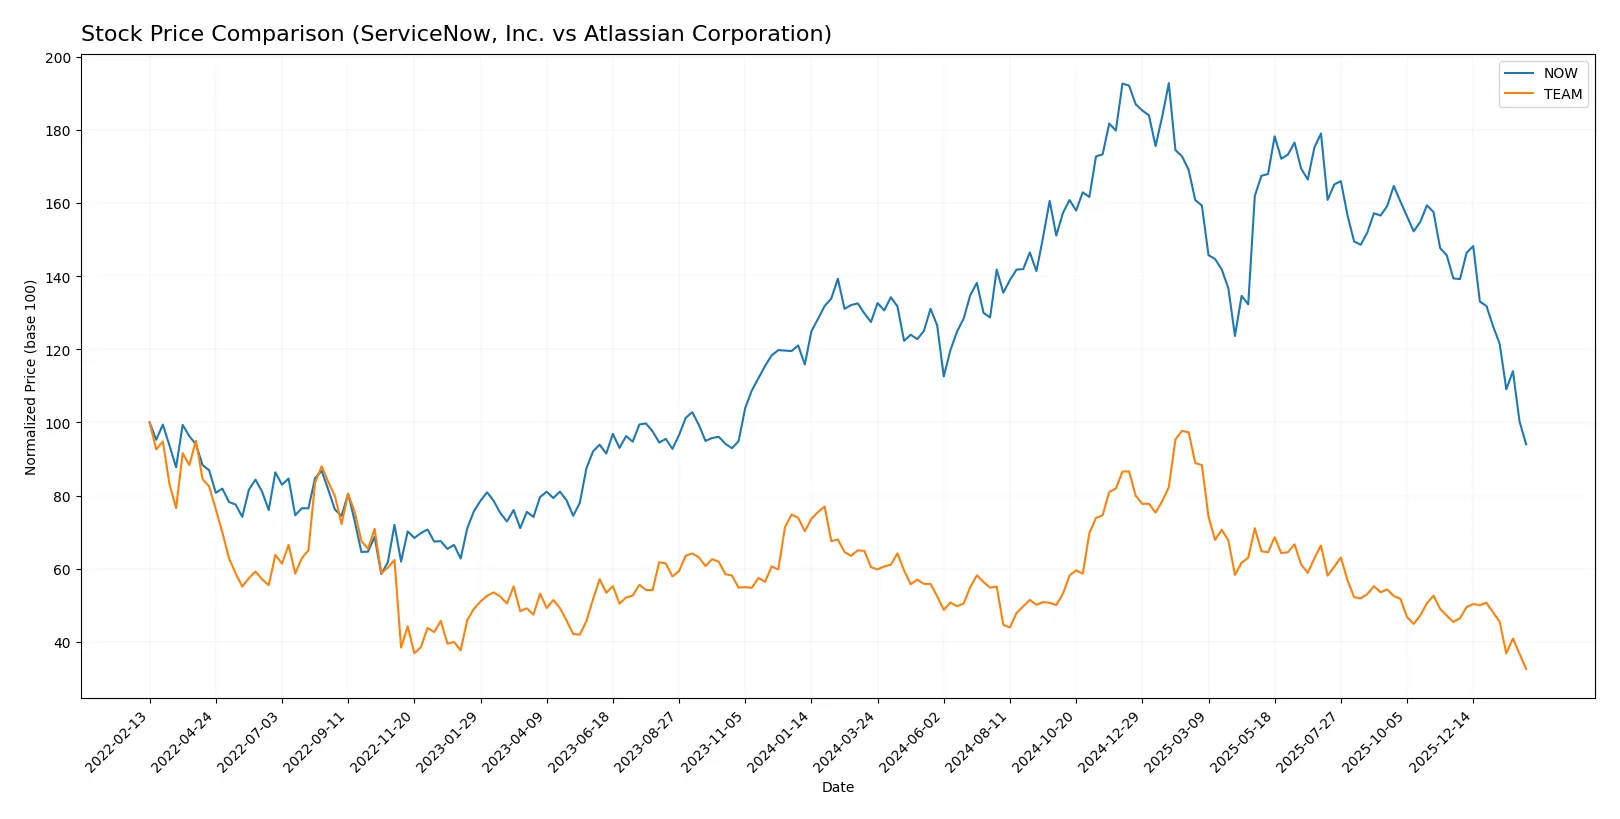
Trend Comparison
ServiceNow, Inc. experienced a bearish trend with a -26.22% price decline over 12 months, showing deceleration and a volatility of 25.07. The stock peaked at 225.0 and bottomed at 109.77.
Atlassian Corporation’s stock also declined sharply, down 46.0% over the same period. It experienced deceleration in its bearish trend and higher volatility at 43.25, hitting a high of 314.28 and a low of 105.0.
Both stocks show bearish, decelerating trends with seller dominance. Atlassian posted the larger loss, underperforming ServiceNow in market returns over the past year.
Target Prices
Analysts present a wide but optimistic target consensus for ServiceNow and Atlassian, signaling expectations of substantial upside.
| Company | Target Low | Target High | Consensus |
|---|---|---|---|
| ServiceNow, Inc. | 115 | 1315 | 440.64 |
| Atlassian Corporation | 145 | 290 | 226.29 |
The consensus targets for ServiceNow and Atlassian exceed current prices of $109.77 and $105 respectively, implying significant growth potential despite recent volatility.

Don’t Let Luck Decide Your Entry Point
Optimize your entry points with our advanced ProRealTime indicators. You’ll get efficient buy signals with precise price targets for maximum performance. Start outperforming now!
How do institutions grade them?
The following tables summarize recent institutional grades for ServiceNow, Inc. and Atlassian Corporation:
ServiceNow, Inc. Grades
The table below shows the latest grades from various reputable financial institutions for ServiceNow, Inc.:
| Grading Company | Action | New Grade | Date |
|---|---|---|---|
| Citigroup | Maintain | Buy | 2026-01-30 |
| Evercore ISI Group | Maintain | Outperform | 2026-01-29 |
| Macquarie | Maintain | Neutral | 2026-01-29 |
| BTIG | Maintain | Buy | 2026-01-29 |
| RBC Capital | Maintain | Outperform | 2026-01-29 |
| Keybanc | Maintain | Underweight | 2026-01-29 |
| Stifel | Maintain | Buy | 2026-01-29 |
| DA Davidson | Maintain | Buy | 2026-01-29 |
| Cantor Fitzgerald | Maintain | Overweight | 2026-01-29 |
| Needham | Maintain | Buy | 2026-01-29 |
Atlassian Corporation Grades
Below are the most recent institutional grades for Atlassian Corporation from established grading firms:
| Grading Company | Action | New Grade | Date |
|---|---|---|---|
| Baird | Maintain | Outperform | 2026-01-26 |
| Mizuho | Maintain | Outperform | 2026-01-21 |
| TD Cowen | Maintain | Hold | 2026-01-20 |
| Citigroup | Maintain | Buy | 2026-01-16 |
| BTIG | Maintain | Buy | 2026-01-13 |
| Piper Sandler | Maintain | Overweight | 2026-01-05 |
| Bernstein | Maintain | Outperform | 2025-11-18 |
| Macquarie | Maintain | Outperform | 2025-11-03 |
| Bernstein | Maintain | Outperform | 2025-10-31 |
| Mizuho | Maintain | Outperform | 2025-10-31 |
Which company has the best grades?
ServiceNow, Inc. shows a broad consensus of “Buy” and “Outperform” ratings, with a few exceptions including one “Underweight” from Keybanc. Atlassian Corporation also holds predominantly “Outperform” and “Buy” grades, with a single “Hold” from TD Cowen. Both companies enjoy strong institutional support, but ServiceNow’s ratings include more “Buy” calls, potentially signaling stronger near-term confidence from analysts. Investors should consider how these grades align with their risk tolerance and market outlook.
Risks specific to each company
The following categories identify the critical pressure points and systemic threats facing both firms in the 2026 market environment:
1. Market & Competition
ServiceNow, Inc.
- Faces intense competition in enterprise cloud workflows from large incumbents and emerging startups.
Atlassian Corporation
- Competes in project management and collaboration software with rapid innovation but niche focus limits scale.
2. Capital Structure & Debt
ServiceNow, Inc.
- Maintains a conservative debt-to-equity ratio of 0.25, signaling strong financial stability.
Atlassian Corporation
- Higher leverage with debt-to-equity near 0.92 increases financial risk amid operating losses.
3. Stock Volatility
ServiceNow, Inc.
- Beta near 0.98 shows market-level volatility, typical for large tech firms.
Atlassian Corporation
- Slightly lower beta at 0.88 indicates marginally less sensitivity to market swings.
4. Regulatory & Legal
ServiceNow, Inc.
- Operates globally with exposure to data privacy and compliance regulations impacting cloud services.
Atlassian Corporation
- Also faces cross-border regulatory risks with expanding SaaS offerings and data security mandates.
5. Supply Chain & Operations
ServiceNow, Inc.
- Relies heavily on cloud infrastructure and strategic partnerships, requiring robust operational resilience.
Atlassian Corporation
- Software delivery model reduces supply chain risk but depends on continuous software innovation.
6. ESG & Climate Transition
ServiceNow, Inc.
- Increasing pressure to enhance sustainability disclosures and reduce carbon footprint in data centers.
Atlassian Corporation
- Faces growing investor scrutiny on ESG metrics amid global climate initiatives.
7. Geopolitical Exposure
ServiceNow, Inc.
- US-based but with global operations, exposed to trade policies and geopolitical tensions.
Atlassian Corporation
- Australian headquarters with international sales, susceptible to Asia-Pacific geopolitical dynamics.
Which company shows a better risk-adjusted profile?
ServiceNow’s key risk is its stretched valuation and tight liquidity position, despite strong financial stability. Atlassian struggles with negative profitability and high leverage, exposing it to operational and financial distress. Overall, ServiceNow presents a better risk-adjusted profile given its safer balance sheet and higher Altman Z-score, even as both face competitive and regulatory headwinds. Recent data highlights Atlassian’s unfavorable interest coverage of -2.24, signaling acute solvency risk that demands investor caution.
Final Verdict: Which stock to choose?
ServiceNow’s superpower lies in its robust income growth and improving profitability, signaling rising operational efficiency. Its point of vigilance is the stretched valuation and a current ratio slightly below 1, which may pressure liquidity in tight markets. This makes it suitable for aggressive growth portfolios focused on innovation leaders.
Atlassian’s strategic moat centers on its recurring revenue model and cloud-centric product ecosystem, providing steady demand. It offers a safer balance sheet profile relative to ServiceNow, despite current margin pressures and declining profitability metrics. This positions Atlassian well for GARP investors valuing long-term subscription stability.
If you prioritize accelerating profitability and market leadership, ServiceNow is the compelling choice due to its improving ROIC trend and strong income statement. However, if you seek resilience with recurring revenue and moderate risk, Atlassian offers better stability despite current operational challenges. Each appeals to distinct investor profiles navigating the tech sector’s evolving landscape.
Disclaimer: Investment carries a risk of loss of initial capital. The past performance is not a reliable indicator of future results. Be sure to understand risks before making an investment decision.
Go Further
I encourage you to read the complete analyses of ServiceNow, Inc. and Atlassian Corporation to enhance your investment decisions: