In the fast-paced semiconductor industry, QUALCOMM Incorporated and Astera Labs, Inc. stand out with distinct yet overlapping innovations. QUALCOMM, a seasoned giant, drives wireless technology worldwide, while Astera Labs, a newer player, focuses on connectivity solutions for cloud and AI infrastructure. Both companies shape the future of tech, making their comparison crucial for investors. Join me as we analyze which stock offers the most compelling opportunity in 2026.

Table of contents
Companies Overview
I will begin the comparison between QUALCOMM and Astera Labs by providing an overview of these two companies and their main differences.
QUALCOMM Overview
QUALCOMM Incorporated is a leading player in the wireless technology industry, focusing on the development and commercialization of foundational technologies for global wireless communication. The company operates through three segments: integrated circuits and system software, technology licensing, and strategic initiatives, including investments in 5G, AI, automotive, and IoT. Headquartered in San Diego, CA, QUALCOMM has a market cap of $175B and employs approximately 49,000 people.
Astera Labs Overview
Astera Labs, Inc. specializes in semiconductor-based connectivity solutions targeting cloud and AI infrastructure. Its Intelligent Connectivity Platform integrates data, network, and memory connectivity products based on a software-defined architecture to enhance performance at scale. Founded in 2017 and based in Santa Clara, CA, Astera Labs has a market cap of $29B and a workforce of around 440 employees, reflecting its status as a smaller, newer market entrant.
Key similarities and differences
Both QUALCOMM and Astera Labs operate in the semiconductor industry, focusing on advanced technologies critical for wireless and cloud infrastructure. QUALCOMM’s business model includes a diversified revenue stream from product sales, licensing, and strategic investments, while Astera Labs concentrates on innovative connectivity solutions within cloud and AI sectors. The key difference lies in scale and maturity: QUALCOMM is a well-established giant with broad industry influence, whereas Astera Labs is a specialized, rapidly growing player in a niche market.
Income Statement Comparison
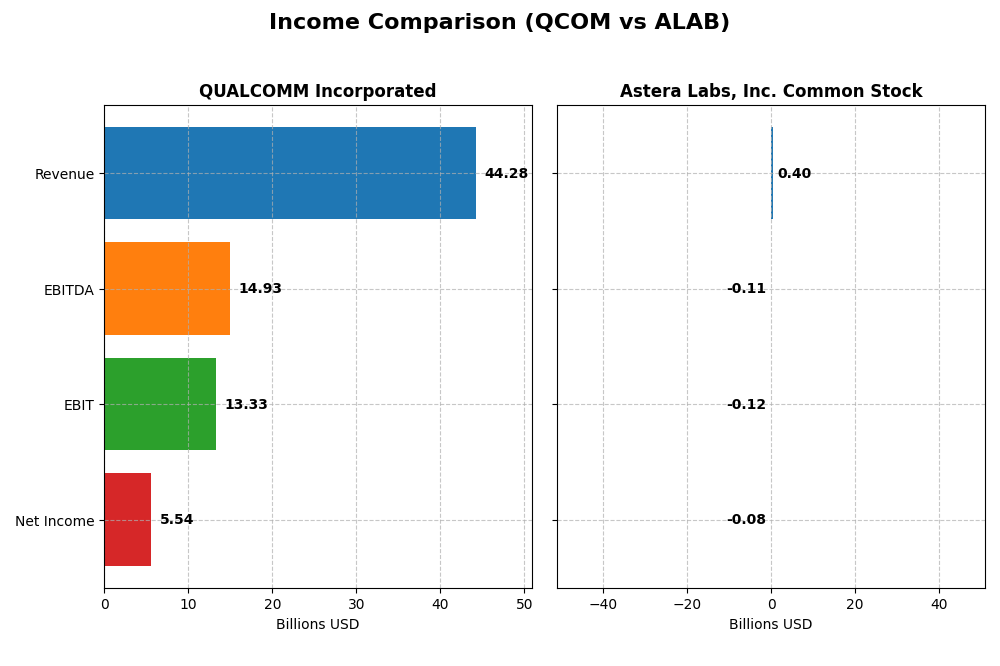
This table presents a side-by-side comparison of key income statement metrics for QUALCOMM Incorporated and Astera Labs, Inc. Common Stock for their most recent fiscal years.
| Metric | QUALCOMM Incorporated | Astera Labs, Inc. Common Stock |
|---|---|---|
| Market Cap | 175.3B | 29.2B |
| Revenue | 44.3B (2025) | 396M (2024) |
| EBITDA | 14.9B (2025) | -113M (2024) |
| EBIT | 13.3B (2025) | -116M (2024) |
| Net Income | 5.54B (2025) | -83.4M (2024) |
| EPS | 5.06 (2025) | -0.64 (2024) |
| Fiscal Year | 2025 | 2024 |
Income Statement Interpretations
QUALCOMM Incorporated
QUALCOMM’s revenue grew steadily from $33.6B in 2021 to $44.3B in 2025, a 31.9% increase over five years. Net income fluctuated, peaking at $12.9B in 2022 but declining to $5.5B in 2025. Margins remained largely favorable, with a gross margin around 55% and EBIT margin near 30%. The latest year showed revenue growth of 13.7%, but net margin and EPS declined sharply.
Astera Labs, Inc. Common Stock
Astera Labs experienced rapid revenue growth from $80M in 2022 to $396M in 2024, a 396% increase overall. Despite this, net losses persisted, with net income worsening to -$83M in 2024. The gross margin was strong at 76%, but EBIT and net margins remained negative, reflecting ongoing operating losses. The latest year showed strong revenue growth but unfavorable operating expense increase.
Which one has the stronger fundamentals?
QUALCOMM demonstrates stronger fundamentals with consistent revenue growth, positive net income, and generally favorable margins, despite recent net margin pressure. Astera Labs, while showing impressive top-line growth and a high gross margin, continues to post significant losses and negative EBIT margin. The mixed performance of Astera Labs contrasts with QUALCOMM’s more stable profitability profile.
Financial Ratios Comparison
The table below presents the most recent key financial ratios for QUALCOMM Incorporated and Astera Labs, Inc., facilitating a direct comparison of their financial performance and stability.
| Ratios | QUALCOMM Incorporated (QCOM) | Astera Labs, Inc. Common Stock (ALAB) |
|---|---|---|
| ROE | 26.1% | -8.6% |
| ROIC | 13.2% | -12.0% |
| P/E | 32.7 | -208.4 |
| P/B | 8.54 | 18.0 |
| Current Ratio | 2.82 | 11.7 |
| Quick Ratio | 2.10 | 11.2 |
| D/E | 0.70 | 0.0013 |
| Debt-to-Assets | 29.5% | 0.12% |
| Interest Coverage | 18.6 | 0 |
| Asset Turnover | 0.88 | 0.38 |
| Fixed Asset Turnover | 9.44 | 11.1 |
| Payout Ratio | 68.7% | 0 |
| Dividend Yield | 2.10% | 0 |
Interpretation of the Ratios
QUALCOMM Incorporated
QUALCOMM shows strong financial health with favorable net margin at 12.51%, ROE at 26.13%, and ROIC at 13.19%, indicating efficient profitability and capital use. The current ratio of 2.82 and interest coverage of 20.07 reflect solid liquidity and debt service capacity. However, high PE (32.7) and PB (8.54) ratios raise valuation concerns. The company pays dividends with a 2.1% yield, supported by sustainable free cash flow and balanced share buybacks.
Astera Labs, Inc. Common Stock
Astera Labs has weak profitability ratios, including a negative net margin of -21.05%, ROE of -8.65%, and ROIC of -11.97%, reflecting ongoing losses and operational challenges. Despite a very high current ratio of 11.71 indicating liquidity strength, other indicators like zero interest coverage and low asset turnover of 0.38 are unfavorable. The company does not pay dividends, likely due to negative earnings and prioritizes reinvestment for growth and R&D.
Which one has the best ratios?
QUALCOMM demonstrates more favorable ratios overall, with a majority indicating profitability, liquidity, and capital efficiency, albeit at a higher valuation. Astera Labs shows predominantly unfavorable profitability and operational ratios, consistent with its non-dividend-paying, growth-focused profile. Based on the ratio evaluations, QUALCOMM has the stronger financial metrics.
Strategic Positioning
This section compares the strategic positioning of QUALCOMM and Astera Labs, including market position, key segments, and exposure to technological disruption:
QUALCOMM
- Leading semiconductor company with large market cap; faces competitive pressure in wireless tech sector
- Operates three segments: QCT (integrated circuits), QTL (technology licensing), and QSI (strategic investments)
- Positioned in wireless and mobile technology; invests in AI, automotive, cloud, and IoT; exposure to evolving wireless standards
Astera Labs
- Smaller market cap semiconductor firm focused on cloud and AI infrastructure connectivity; niche competitive environment
- Focused on semiconductor-based connectivity solutions for cloud and AI infrastructure with software-defined architecture
- Exposed to cloud and AI infrastructure connectivity innovation; relies on software-defined platform to address high-performance demands
QUALCOMM vs Astera Labs Positioning
QUALCOMM has a diversified approach with multiple business segments including licensing and strategic investments, providing broad exposure. Astera Labs is more concentrated on semiconductor connectivity for cloud and AI, targeting a specific high-growth niche. QUALCOMM benefits from scale, while Astera Labs focuses on emerging infrastructure needs.
Which has the best competitive advantage?
QUALCOMM shows a slightly favorable moat with value creation despite declining profitability, reflecting established competitive advantages. Astera Labs has a slightly unfavorable moat, shedding value but improving profitability, indicating growth potential but less established competitive strength.
Stock Comparison
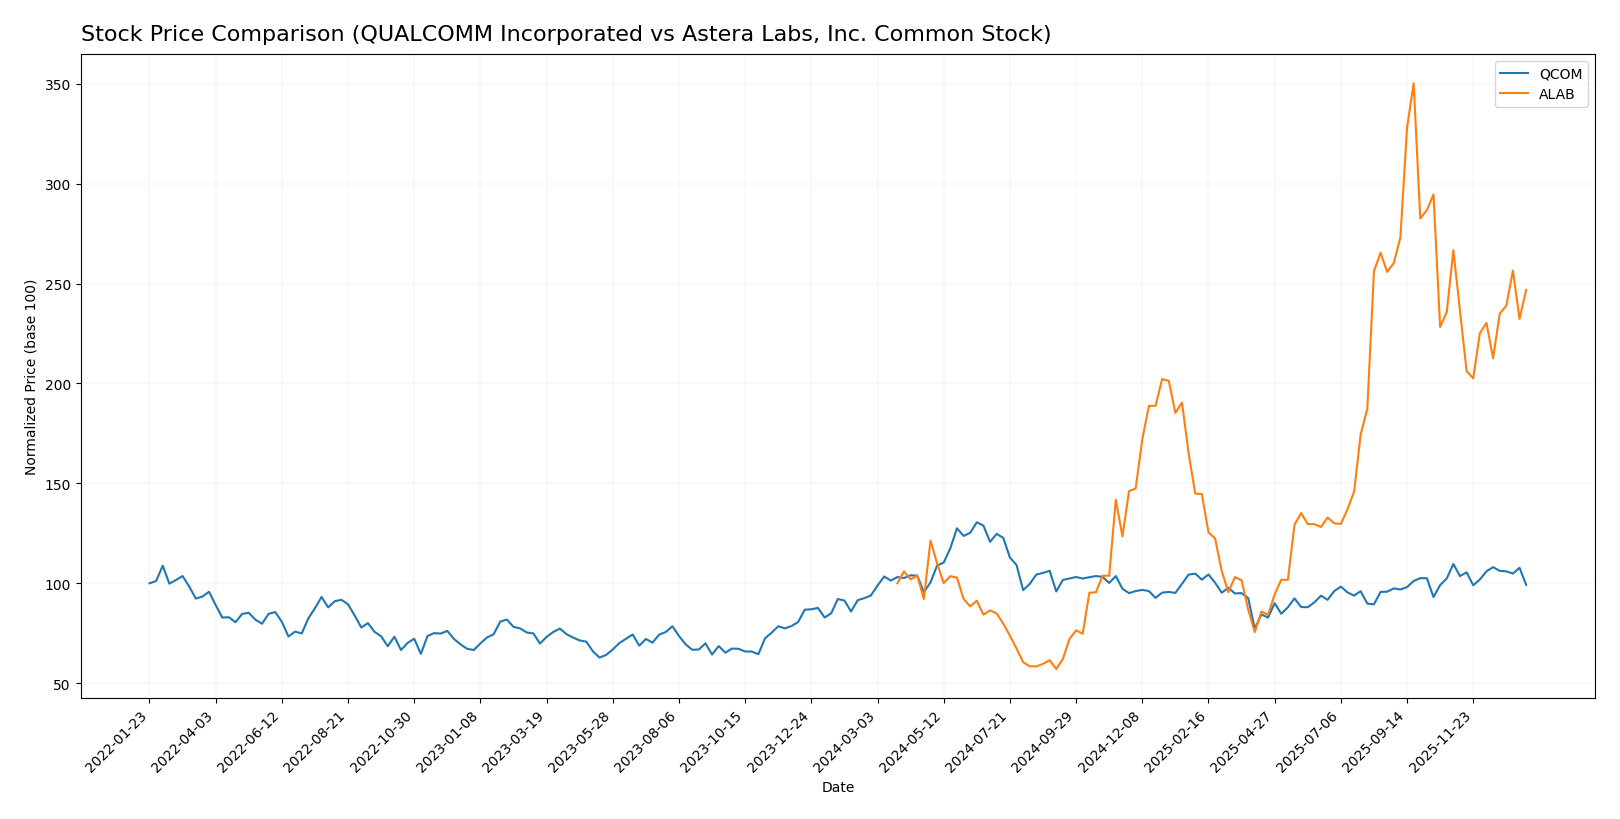
The stock price movements over the past 12 months reveal significant bullish trends for both QUALCOMM Incorporated and Astera Labs, Inc., with differing acceleration and volume dynamics shaping their trading landscapes.
Trend Analysis
QUALCOMM Incorporated’s stock showed a 5.66% increase over the past year, indicating a bullish trend with acceleration. The price fluctuated between 127.46 and 215.33, with notable volatility at a 16.08 standard deviation. Recent months saw a -9.52% decline, indicating a short-term bearish phase.
Astera Labs, Inc. Common Stock experienced a strong 146.83% gain over the year, also bullish but with deceleration. Price ranged from 40.0 to 245.2, accompanied by high volatility (50.12 std deviation). The recent -7.45% drop showed a slight upward slope, suggesting a minor recovery phase.
Comparing the two, Astera Labs delivered substantially higher market performance over the past year. QUALCOMM’s growth was modest in contrast, despite its steadier acceleration and volume trends.
Target Prices
Analysts present a bullish consensus for both QUALCOMM Incorporated and Astera Labs, Inc. Common Stock.
| Company | Target High | Target Low | Consensus |
|---|---|---|---|
| QUALCOMM Incorporated | 210 | 165 | 185.71 |
| Astera Labs, Inc. Common Stock | 225 | 165 | 202.14 |
The consensus target prices suggest upside potential above current prices of $163.67 for QUALCOMM and $173.01 for Astera Labs, indicating overall positive analyst sentiment on both semiconductor stocks.
Analyst Opinions Comparison
This section compares analysts’ ratings and grades for QUALCOMM Incorporated and Astera Labs, Inc. Common Stock:
Rating Comparison
QUALCOMM Incorporated Rating
- Rating: B+, considered very favorable by analysts.
- Discounted Cash Flow Score: 4, indicating favorable cash flow.
- ROE Score: 5, very favorable efficiency in generating profit.
- ROA Score: 5, very favorable asset utilization.
- Debt To Equity Score: 1, very unfavorable due to higher debt.
- Overall Score: 3, considered moderate overall assessment.
Astera Labs, Inc. Common Stock Rating
- Rating: B, also considered very favorable by analysts.
- Discounted Cash Flow Score: 1, indicating very unfavorable cash flow.
- ROE Score: 4, favorable profit generation from equity.
- ROA Score: 5, very favorable asset utilization.
- Debt To Equity Score: 4, favorable financial stability.
- Overall Score: 3, considered moderate overall assessment.
Which one is the best rated?
Based strictly on the provided data, QUALCOMM holds a higher rating (B+) and stronger scores in discounted cash flow and return on equity. Astera Labs shows better debt-to-equity management but lags in cash flow evaluation. Overall, QUALCOMM is better rated.
Scores Comparison
The following table compares the Altman Z-Score and Piotroski Score for QUALCOMM and Astera Labs, Inc. Common Stock:
QCOM Scores
- Altman Z-Score: 6.37, indicating a safe zone status
- Piotroski Score: 7, assessed as strong financial health
ALAB Scores
- Altman Z-Score: 136.88, indicating a safe zone
- Piotroski Score: 6, assessed as average financial health
Which company has the best scores?
ALAB has a significantly higher Altman Z-Score than QCOM, both in the safe zone, while QCOM’s Piotroski Score is stronger, reflecting better financial health by this measure.
Grades Comparison
The following is a comparison of the latest grades assigned by recognized grading companies for QUALCOMM Incorporated and Astera Labs, Inc. Common Stock:
QUALCOMM Incorporated Grades
This table summarizes recent grades from established financial institutions for QUALCOMM Incorporated.
| Grading Company | Action | New Grade | Date |
|---|---|---|---|
| Mizuho | Downgrade | Neutral | 2026-01-09 |
| Rosenblatt | Maintain | Buy | 2025-11-06 |
| B of A Securities | Maintain | Buy | 2025-11-06 |
| Mizuho | Maintain | Outperform | 2025-11-06 |
| Wells Fargo | Maintain | Underweight | 2025-11-06 |
| Piper Sandler | Maintain | Overweight | 2025-11-06 |
| UBS | Maintain | Neutral | 2025-11-06 |
| JP Morgan | Maintain | Overweight | 2025-11-04 |
| Citigroup | Maintain | Neutral | 2025-10-28 |
| Rosenblatt | Maintain | Buy | 2025-10-28 |
Overall, QUALCOMM shows a mixture of Buy, Neutral, Overweight, and Outperform ratings with one recent downgrade to Neutral, indicating a generally positive but cautious outlook.
Astera Labs, Inc. Common Stock Grades
This table presents recent grades from notable grading companies for Astera Labs, Inc. Common Stock.
| Grading Company | Action | New Grade | Date |
|---|---|---|---|
| Northland Capital Markets | Maintain | Outperform | 2025-12-09 |
| Northland Capital Markets | Upgrade | Outperform | 2025-11-17 |
| Stifel | Maintain | Buy | 2025-11-05 |
| Morgan Stanley | Maintain | Overweight | 2025-11-05 |
| Roth Capital | Maintain | Buy | 2025-11-05 |
| Needham | Maintain | Buy | 2025-11-05 |
| JP Morgan | Maintain | Overweight | 2025-11-05 |
| TD Cowen | Maintain | Hold | 2025-11-05 |
| Barclays | Downgrade | Equal Weight | 2025-10-20 |
| Stifel | Maintain | Buy | 2025-10-17 |
Astera Labs exhibits a predominantly positive rating pattern, with multiple Buy and Outperform grades and only one recent downgrade to Equal Weight, indicating strong confidence from analysts.
Which company has the best grades?
Both QUALCOMM and Astera Labs have received predominantly positive grades, with a consensus “Buy” rating for each. Astera Labs shows a higher concentration of Outperform and Buy ratings, while QUALCOMM presents more variety including Neutral and Underweight grades. This suggests Astera Labs may be viewed more favorably by analysts, which could influence investor sentiment and portfolio weighting differently.
Strengths and Weaknesses
Below is a comparison of QUALCOMM Incorporated and Astera Labs, Inc. across key business criteria based on the latest data available in 2026.
| Criterion | QUALCOMM Incorporated (QCOM) | Astera Labs, Inc. Common Stock (ALAB) |
|---|---|---|
| Diversification | Strong diversification with QCT segment generating $38.4B and QTL $5.6B in 2025 | Limited diversification, $393M product revenue mainly |
| Profitability | High profitability: net margin 12.5%, ROIC 13.2%, ROE 26.1% (favorable) | Negative profitability: net margin -21.1%, ROIC -12.0%, ROE -8.7% (unfavorable) |
| Innovation | Consistent R&D investment, strong market position in mobile and wireless tech | Growing innovation with improving ROIC trend but still value destructive |
| Global presence | Extensive global presence supported by large revenues and established partnerships | Smaller scale, primarily technology service and product sales |
| Market Share | Significant market share in chipset and licensing markets | Emerging player with limited market penetration |
Key takeaways: QUALCOMM exhibits strong profitability, diversification, and global reach, sustaining a slightly favorable moat despite a declining ROIC trend. Astera Labs shows promising innovation and ROIC growth but currently operates at a loss with limited scale, presenting higher investment risk.
Risk Analysis
Below is a comparative table highlighting key risks for QUALCOMM Incorporated (QCOM) and Astera Labs, Inc. Common Stock (ALAB) based on the most recent data from 2025 and 2024 respectively:
| Metric | QUALCOMM Incorporated (QCOM) | Astera Labs, Inc. (ALAB) |
|---|---|---|
| Market Risk | Moderate (Beta 1.21) | High (Beta 1.51) |
| Debt Level | Moderate (Debt/Equity 0.7) | Very Low (Debt/Equity 0) |
| Regulatory Risk | Moderate (Tech/IP focus) | Moderate (Emerging tech) |
| Operational Risk | Low (Established, 49K employees) | Moderate (Small size, 440 employees) |
| Environmental Risk | Moderate (Tech industry impact) | Moderate (Semiconductor sector) |
| Geopolitical Risk | Moderate (Global supply chain) | Moderate (Tech supply chain dependencies) |
Risk synthesis: QUALCOMM faces moderate market and regulatory risks but benefits from strong operational stability and manageable debt. Astera Labs carries higher market risk and operational risk due to its smaller scale and emerging status, despite negligible debt. Market volatility and supply chain geopolitical factors remain the most impactful risks for both firms in 2026.
Which Stock to Choose?
QUALCOMM Incorporated (QCOM) shows a favorable income evolution with strong margins and profitability despite some declining net margin growth. Its financial ratios are mostly favorable, supported by moderate debt levels and a very favorable rating of B+. The company creates value with a slightly favorable moat, though its ROIC trend is declining.
Astera Labs, Inc. (ALAB) exhibits strong revenue and gross profit growth but suffers from negative profitability and unfavorable financial ratios overall. It carries minimal debt and holds a very favorable rating of B. However, the company is currently destroying value with a slightly unfavorable moat, despite improving profitability trends.
Investors prioritizing quality and stable value creation may find QCOM’s consistent profitability and favorable ratios more attractive. Conversely, those with a higher risk tolerance and growth focus might see potential in ALAB’s rapid revenue expansion and improving profitability, though its financial metrics remain challenging.
Disclaimer: Investment carries a risk of loss of initial capital. The past performance is not a reliable indicator of future results. Be sure to understand risks before making an investment decision.
Go Further
I encourage you to read the complete analyses of QUALCOMM Incorporated and Astera Labs, Inc. Common Stock to enhance your investment decisions: