Home > Comparison > Technology > ASML vs QCOM
The strategic rivalry between ASML Holding N.V. and QUALCOMM Incorporated shapes the semiconductor industry’s evolution. ASML, a capital-intensive leader in advanced lithography systems, contrasts QUALCOMM’s diversified model focused on wireless technologies and intellectual property licensing. This head-to-head reflects a battle between manufacturing innovation and communication technology dominance. This analysis aims to identify which company presents a superior risk-adjusted profile for investors seeking exposure to the dynamic technology sector.
Table of contents
Companies Overview
ASML Holding N.V. and QUALCOMM Incorporated stand as pivotal forces in the semiconductor industry, shaping advanced technology markets globally.
ASML Holding N.V.: Advanced Lithography Leader
ASML dominates the semiconductor equipment market by developing and selling cutting-edge lithography systems essential for chip manufacturing. Its revenue hinges on extreme ultraviolet and deep ultraviolet lithography systems, plus metrology and inspection tools. In 2026, ASML sharpens its focus on enhancing computational lithography and expanding system upgrades, reinforcing its technological moat.
QUALCOMM Incorporated: Wireless Technology Pioneer
QUALCOMM drives growth through its leadership in wireless technology and patents. Its core revenue comes from chipsets for 3G/4G/5G devices and lucrative licensing of its extensive patent portfolio. In 2026, QUALCOMM emphasizes advancing 5G innovation and strategic investments in AI, automotive, and IoT sectors to widen its influence beyond traditional wireless markets.
Strategic Collision: Similarities & Divergences
Both firms excel in semiconductors but pursue divergent models: ASML focuses on capital-intensive equipment sales, while QUALCOMM leverages intellectual property and diversified technology licensing. Their battle for dominance centers on enabling next-generation chips and connectivity. Investors face contrasting profiles—ASML offers precision manufacturing leadership, QUALCOMM provides broad wireless ecosystem control and innovation exposure.
Income Statement Comparison
This data dissects the core profitability and scalability of both corporate engines to reveal who dominates the bottom line:
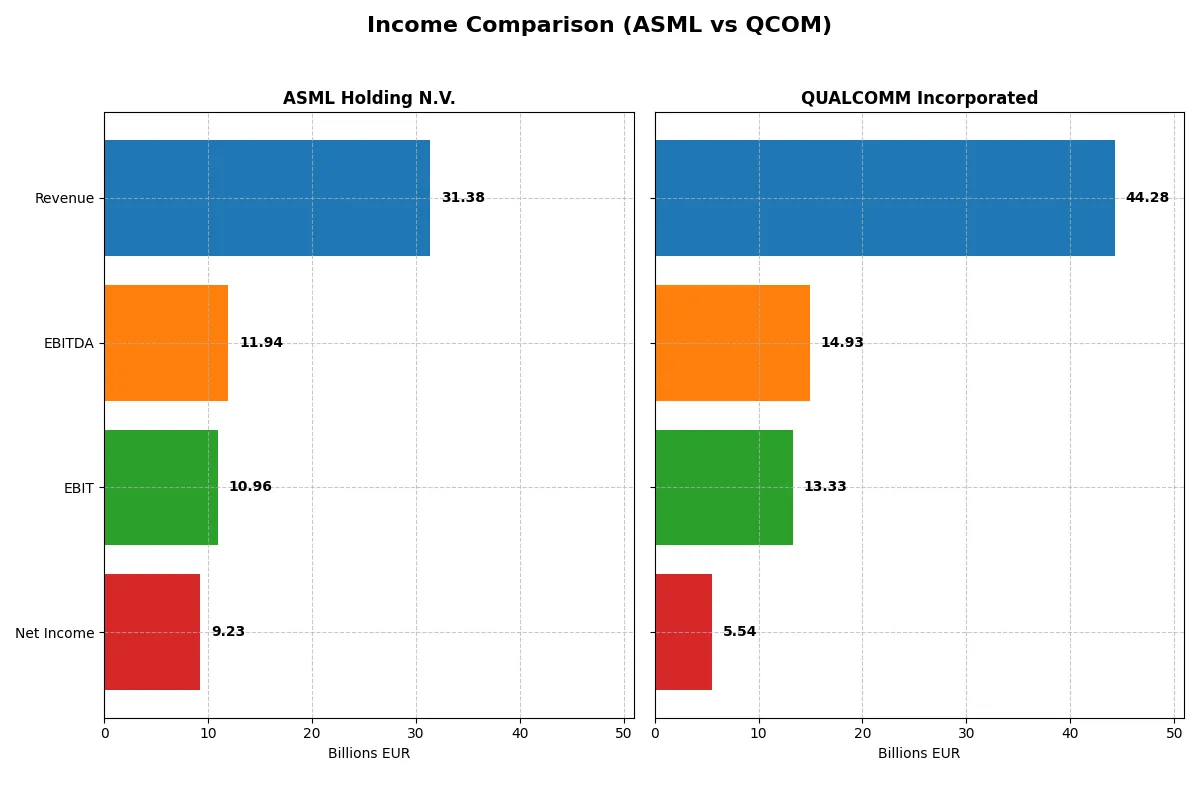
| Metric | ASML Holding N.V. (ASML) | QUALCOMM Incorporated (QCOM) |
|---|---|---|
| Revenue | 31.4B EUR | 44.3B USD |
| Cost of Revenue | 14.8B EUR | 19.7B USD |
| Operating Expenses | 5.7B EUR | 12.2B USD |
| Gross Profit | 16.6B EUR | 24.5B USD |
| EBITDA | 11.9B EUR | 14.9B USD |
| EBIT | 11.0B EUR | 13.3B USD |
| Interest Expense | 0 | 664M USD |
| Net Income | 9.2B EUR | 5.5B USD |
| EPS | 23.76 EUR | 5.06 USD |
| Fiscal Year | 2025 | 2025 |
Income Statement Analysis: The Bottom-Line Duel
This income statement comparison reveals which company runs a more efficient and profitable engine amid evolving market conditions.
ASML Holding N.V. Analysis
ASML’s revenue rose steadily from €18.6B in 2021 to €31.4B in 2025, reflecting robust growth. Net income followed suit, climbing to €9.2B in 2025. Its gross margin holds strong at 52.8%, and net margin expanded to 29.4%, signaling excellent cost control and operational efficiency. The latest year shows solid momentum with double-digit growth in revenue and EBIT.
QUALCOMM Incorporated Analysis
QUALCOMM’s revenue grew from $33.6B in 2021 to $44.3B in 2025, outpacing ASML’s absolute scale but with a more volatile net income trend. Net income fell sharply to $5.5B in 2025 from a peak of $12.9B in 2022. Despite a healthy gross margin of 55.4%, its net margin slipped to 12.5%, reflecting margin pressure. The latest year shows revenue growth but a concerning decline in net profitability and EPS.
Margin Leadership vs. Revenue Scale
ASML delivers consistent margin expansion and profit growth, while QUALCOMM offers larger revenue but declining net income and margins. ASML’s efficiency and margin stability mark it as the fundamental winner. For investors prioritizing profitability and margin health, ASML’s profile appears more attractive amid cyclical and competitive pressures.
Financial Ratios Comparison
These vital ratios serve as a diagnostic tool to expose underlying fiscal health, valuation premiums, and capital efficiency for the companies analyzed:
| Ratios | ASML Holding N.V. (ASML) | QUALCOMM Incorporated (QCOM) |
|---|---|---|
| ROE | 47.1% | 26.1% |
| ROIC | 34.1% | 13.2% |
| P/E | 38.3 | 32.7 |
| P/B | 18.0 | 8.54 |
| Current Ratio | 1.26 | 2.82 |
| Quick Ratio | 0.79 | 2.10 |
| D/E | 0.14 | 0.70 |
| Debt-to-Assets | 5.4% | 29.5% |
| Interest Coverage | N/A | 18.6 |
| Asset Turnover | 0.62 | 0.88 |
| Fixed Asset Turnover | 3.81 | 9.44 |
| Payout ratio | 26.5% | 68.7% |
| Dividend yield | 0.69% | 2.10% |
| Fiscal Year | 2025 | 2025 |
Efficiency & Valuation Duel: The Vital Signs
Financial ratios serve as a company’s DNA, exposing hidden risks and operational strengths that shape investment outcomes.
ASML Holding N.V.
ASML boasts an exceptional 47.1% ROE and a robust 29.4% net margin, signaling operational excellence. However, its valuation is stretched with a P/E of 38.3 and P/B of 18.1, reflecting high market expectations. Shareholders receive a modest 0.69% dividend as the company prioritizes reinvestment in R&D for long-term growth.
QUALCOMM Incorporated
QUALCOMM delivers solid profitability with a 26.1% ROE and a 12.5% net margin, supported by efficient capital use. The stock trades at a relatively lower P/E of 32.7 and P/B of 8.5, less stretched than ASML. It rewards investors with a healthy 2.1% dividend yield, balancing income with growth through sustained R&D investment.
Premium Valuation vs. Operational Safety
ASML commands a premium valuation justified by its superior profitability but carries valuation risk. QUALCOMM offers a more balanced risk-reward profile with solid returns and stronger liquidity ratios. Growth-focused investors may prefer ASML’s high operational efficiency, while income-oriented investors might favor QUALCOMM’s stable dividends and financial stability.
Which one offers the Superior Shareholder Reward?
I observe ASML Holding N.V. and QUALCOMM Incorporated each adopt distinct distribution strategies. ASML yields a modest 0.97% dividend with a 34% payout ratio, balancing dividends and steady buybacks to sustain growth. QUALCOMM offers a higher 2.1% yield but pays out nearly 69% of earnings, signaling less reinvestment. ASML’s free cash flow per share is €27.4 with buybacks supporting long-term value. QUALCOMM’s free cash flow per share is $11.7, with aggressive dividends but less buyback intensity. Historically, ASML’s balanced approach aligns better with durable shareholder rewards in cyclical tech sectors. I conclude ASML presents a more sustainable total return profile for 2026 investors.
Comparative Score Analysis: The Strategic Profile
The radar chart reveals the fundamental DNA and trade-offs of ASML Holding N.V. and QUALCOMM Incorporated, highlighting their strategic strengths and vulnerabilities:
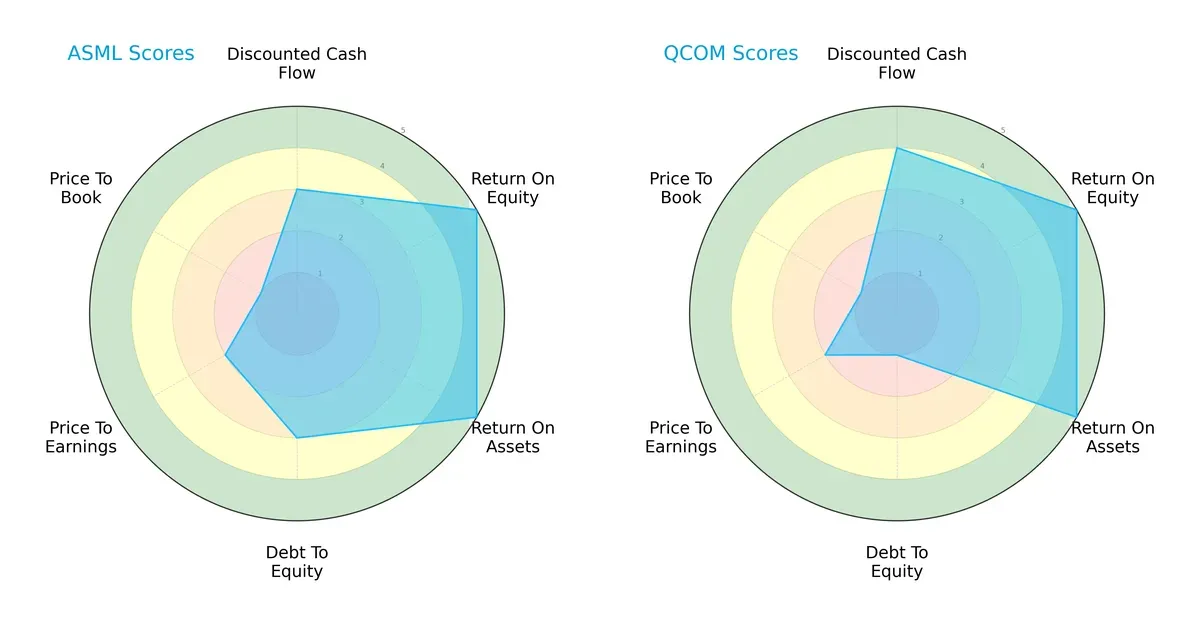
ASML and QUALCOMM share strong ROE and ROA scores (5 each), reflecting efficient profit generation and asset utilization. QUALCOMM leads in discounted cash flow (DCF) with a favorable score of 4 versus ASML’s moderate 3, signaling a better valuation on future cash flows. However, ASML holds a more balanced debt-to-equity profile (3) compared to QUALCOMM’s weaker score of 1, indicating less financial risk. Both companies face valuation challenges, scoring low on price-to-book (1) and moderate on price-to-earnings (2). Overall, ASML presents a steadier capital structure, while QUALCOMM leans on its DCF advantage.
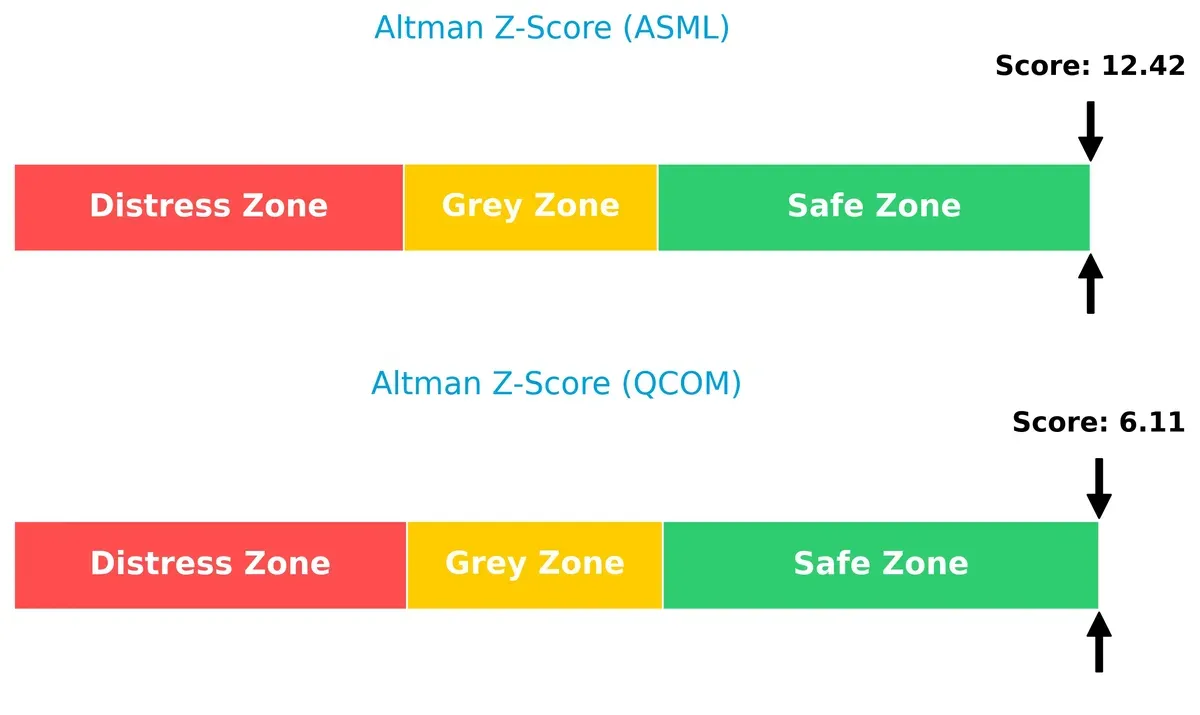
Bankruptcy Risk: Solvency Showdown
The Altman Z-Score differential reveals both firms are in a safe zone; ASML at 12.4 and QUALCOMM at 6.1, underscoring robust long-term survival prospects in this cycle:
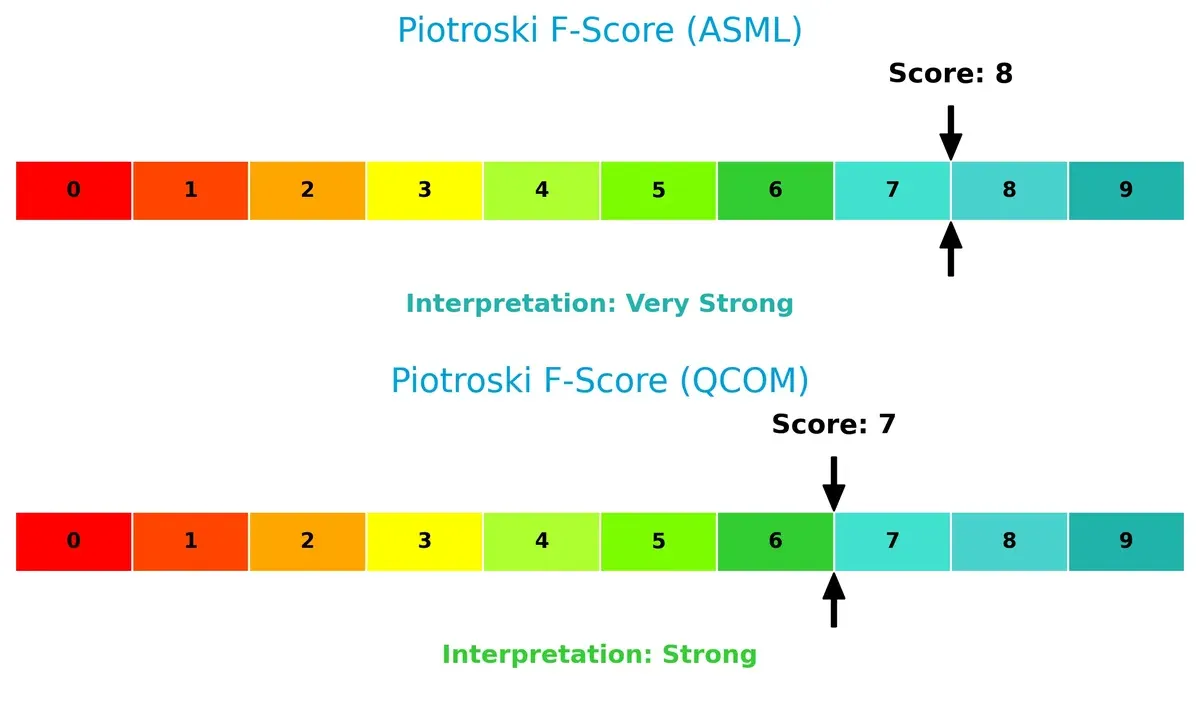
Financial Health: Quality of Operations
ASML’s Piotroski F-Score of 8 surpasses QUALCOMM’s 7, indicating superior internal financial health and operational quality. QUALCOMM’s slightly lower score suggests minor red flags worth monitoring:
How are the two companies positioned?
This section dissects ASML and QCOM’s operational DNA by comparing their revenue distribution and internal dynamics. The goal is to confront their economic moats to reveal which model offers the most resilient and sustainable advantage today.
Revenue Segmentation: The Strategic Mix
This visual comparison dissects how ASML Holding N.V. and QUALCOMM Incorporated diversify their income streams and where their primary sector bets lie:
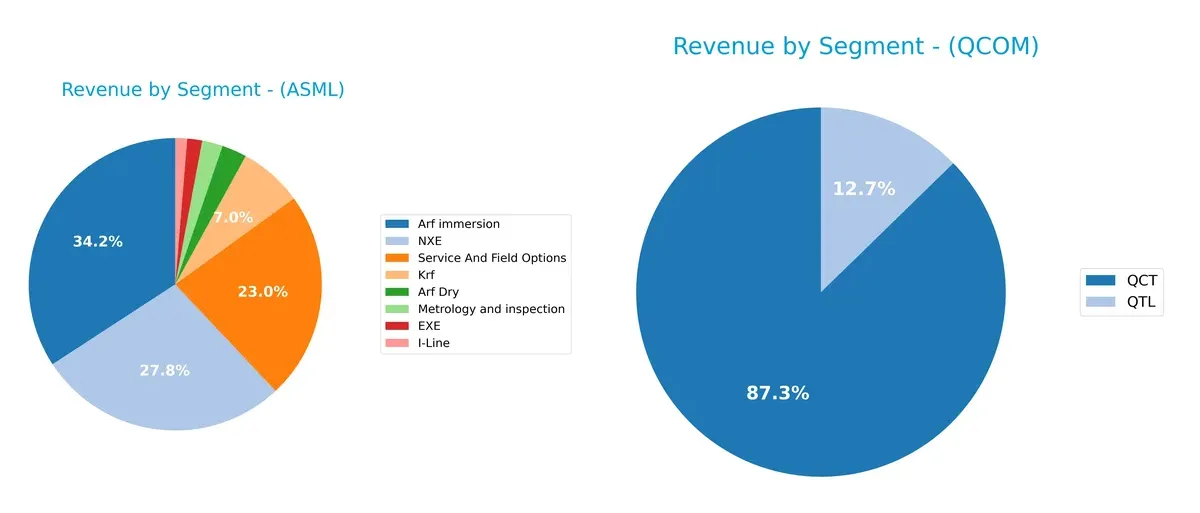
ASML shows a balanced revenue mix with major streams like Arf immersion at 9.67B, NXE at 7.86B, and Services at 6.49B, reflecting diversified high-tech equipment sales plus recurring service income. QUALCOMM relies heavily on QCT at 38.37B, dwarfing its QTL segment at 5.58B, signaling a dominant chipset sales focus but exposing it to smartphone market cycles. ASML’s diversity cushions cyclical risks; QUALCOMM’s concentration pivots on semiconductor demand.
Strengths and Weaknesses Comparison
This table compares the Strengths and Weaknesses of ASML Holding N.V. and QUALCOMM Incorporated:
ASML Strengths
- High profitability with 29.42% net margin and 47.08% ROE
- Strong innovation in advanced lithography systems
- Low debt-to-assets at 5.36% supports financial stability
- Global presence with significant sales in China, Taiwan, and Korea
- Robust fixed asset turnover at 3.81 indicating efficient asset use
QCOM Strengths
- Favorable liquidity ratios with 2.82 current ratio and 2.1 quick ratio
- Solid profitability with 12.51% net margin and 26.13% ROE
- Diverse revenue streams from QCT and QTL segments
- Higher dividend yield at 2.1% appeals to income investors
- Global reach including strong sales in China, Vietnam, and Korea
ASML Weaknesses
- Elevated valuation metrics with PE at 38.33 and PB at 18.05
- Quick ratio low at 0.79 signals potential short-term liquidity concerns
- Weighted average cost of capital (WACC) at 10.08% exceeds ROIC, reducing capital efficiency
- Moderate current ratio at 1.26 may limit financial flexibility
- Dividend yield low at 0.69%, less attractive for income focus
QCOM Weaknesses
- High debt-to-equity at 0.7 may increase financial risk
- PE and PB ratios still unfavorable, limiting valuation appeal
- Net margin and ROIC lower than ASML, reflecting less operational efficiency
- Asset turnover neutral at 0.88, suggesting room for improvement in asset utilization
ASML excels in profitability and innovation but faces valuation and liquidity challenges, implying a focus on managing capital efficiency. QUALCOMM shows strong liquidity and dividend appeal but carries higher leverage and lower profitability, highlighting the need for cautious financial management.
The Moat Duel: Analyzing Competitive Defensibility
A structural moat shields long-term profits from competition’s relentless erosion. Let’s dissect how ASML and QUALCOMM defend their turf:
ASML Holding N.V.: Technological Innovation and Scale Moat
ASML’s moat stems from its advanced lithography technology and high capital intensity. Its ROIC exceeds WACC by 24%, reflecting strong value creation and margin stability. Expansion in EUV systems deepens its fortress in 2026.
QUALCOMM Incorporated: Intellectual Property and Licensing Moat
QUALCOMM’s moat hinges on its vast patent portfolio and licensing model, unlike ASML’s hardware dominance. It generates value but faces a 52% ROIC decline, signaling margin pressure. New 5G and AI ventures offer growth but risk disruption.
Verdict: Innovation Scale vs. IP Licensing Durability
ASML boasts a wider and more durable moat with growing ROIC and robust margin trends. QUALCOMM creates value but suffers declining profitability, making ASML better positioned to defend and expand market share in 2026.
Which stock offers better returns?
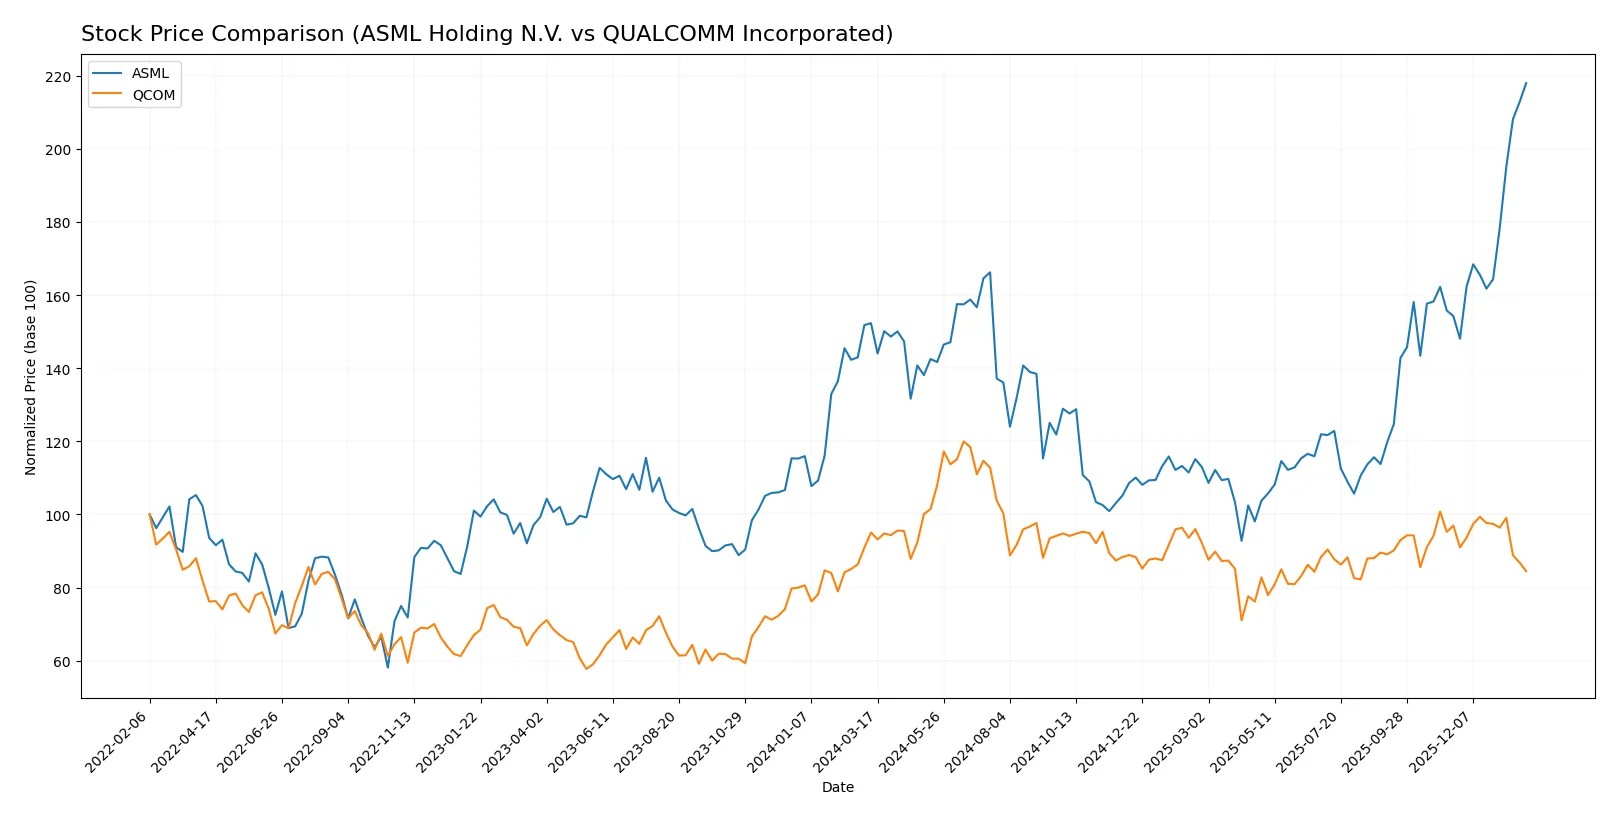
The past year showed stark contrasts in price movements: ASML surged over 40%, while QUALCOMM declined by more than 11%, reflecting divergent investor sentiment and trading dynamics.
Trend Comparison
ASML Holding N.V. exhibits a strong bullish trend with a 43.11% price increase over the past 12 months, marked by accelerating gains and high volatility, peaking at 1423.0.
QUALCOMM Incorporated’s stock reveals a bearish trend, declining 11.13% over the same period, with decelerating losses and lower volatility, reaching a low of 127.46.
ASML outperformed QUALCOMM significantly, delivering the highest market returns with accelerating momentum, contrasting with QUALCOMM’s steady price erosion.
Target Prices
Analysts present a balanced target consensus for ASML Holding N.V. and QUALCOMM Incorporated.
| Company | Target Low | Target High | Consensus |
|---|---|---|---|
| ASML Holding N.V. | 1150 | 1911 | 1458.5 |
| QUALCOMM Incorporated | 160 | 210 | 182.5 |
ASML’s consensus target sits slightly above its current price of 1423, signaling moderate upside potential. QUALCOMM’s consensus target at 182.5 also suggests upside from the current 151.59 price, reflecting analyst optimism.

Don’t Let Luck Decide Your Entry Point
Optimize your entry points with our advanced ProRealTime indicators. You’ll get efficient buy signals with precise price targets for maximum performance. Start outperforming now!
How do institutions grade them?
ASML Holding N.V. Grades
The following table summarizes recent grades issued by reputable institutions for ASML Holding N.V.:
| Grading Company | Action | New Grade | Date |
|---|---|---|---|
| Barclays | Upgrade | Overweight | 2026-01-29 |
| Wells Fargo | Maintain | Overweight | 2026-01-29 |
| RBC Capital | Maintain | Outperform | 2026-01-29 |
| Bernstein | Maintain | Outperform | 2026-01-22 |
| KGI Securities | Upgrade | Outperform | 2026-01-15 |
| Wells Fargo | Maintain | Overweight | 2026-01-15 |
| JP Morgan | Maintain | Overweight | 2026-01-14 |
| Bernstein | Upgrade | Outperform | 2026-01-05 |
| B of A Securities | Maintain | Buy | 2025-12-03 |
| JP Morgan | Maintain | Overweight | 2025-12-01 |
QUALCOMM Incorporated Grades
The following table summarizes recent grades issued by reputable institutions for QUALCOMM Incorporated:
| Grading Company | Action | New Grade | Date |
|---|---|---|---|
| UBS | Maintain | Neutral | 2026-01-26 |
| Mizuho | Maintain | Neutral | 2026-01-26 |
| Mizuho | Downgrade | Neutral | 2026-01-09 |
| B of A Securities | Maintain | Buy | 2025-11-06 |
| Rosenblatt | Maintain | Buy | 2025-11-06 |
| Wells Fargo | Maintain | Underweight | 2025-11-06 |
| Mizuho | Maintain | Outperform | 2025-11-06 |
| Piper Sandler | Maintain | Overweight | 2025-11-06 |
| UBS | Maintain | Neutral | 2025-11-06 |
| JP Morgan | Maintain | Overweight | 2025-11-04 |
Which company has the best grades?
ASML Holding N.V. consistently receives higher and more positive grades, including multiple “Outperform” and “Overweight” ratings from top-tier firms. QUALCOMM’s ratings are more mixed, with several “Neutral” and “Underweight” grades. This divergence may influence investors seeking stronger analyst conviction.
Risks specific to each company
The below categories identify the critical pressure points and systemic threats facing ASML Holding N.V. and QUALCOMM Incorporated in the 2026 market environment:
1. Market & Competition
ASML Holding N.V.
- Dominates advanced lithography with high barriers to entry but faces intensifying competition from alternative semiconductor tech.
QUALCOMM Incorporated
- Strong in wireless tech licensing and chipsets, yet challenged by rapid 5G/6G innovation and rival patent portfolios.
2. Capital Structure & Debt
ASML Holding N.V.
- Maintains low debt-to-equity (0.14) and minimal leverage, supporting financial stability.
QUALCOMM Incorporated
- Higher leverage (D/E 0.7) raises refinancing risks despite favorable interest coverage.
3. Stock Volatility
ASML Holding N.V.
- Beta of 1.34 indicates above-market volatility, reflecting semiconductor cyclicality.
QUALCOMM Incorporated
- Beta of 1.21 suggests moderate volatility, somewhat insulated by diversified segments.
4. Regulatory & Legal
ASML Holding N.V.
- Faces export controls and tech restrictions due to geopolitical tensions affecting semiconductor equipment sales.
QUALCOMM Incorporated
- Exposed to antitrust scrutiny and licensing disputes, especially in global wireless patent enforcement.
5. Supply Chain & Operations
ASML Holding N.V.
- Complex manufacturing and reliance on rare materials pose operational risks amid supply disruptions.
QUALCOMM Incorporated
- Diverse supplier base but vulnerable to semiconductor chip shortages and component supply shocks.
6. ESG & Climate Transition
ASML Holding N.V.
- Invests in energy-efficient production but faces pressure to reduce carbon footprint in high-tech manufacturing.
QUALCOMM Incorporated
- Focuses on sustainable tech innovations, yet must address carbon emissions linked to global wireless infrastructure.
7. Geopolitical Exposure
ASML Holding N.V.
- Heavily exposed to Asia-Pacific trade dynamics, especially with China and Taiwan tensions.
QUALCOMM Incorporated
- US-based but globally dependent, subject to trade wars and export regulations impacting licensing and sales.
Which company shows a better risk-adjusted profile?
ASML’s key risk is geopolitical exposure that could disrupt its global supply and sales chain. QUALCOMM’s main vulnerability lies in its elevated leverage and regulatory/legal pressures. Despite ASML’s higher stock volatility and some valuation concerns, its strong balance sheet and safer capital structure offer a more resilient risk-adjusted profile. QUALCOMM’s favorable operating metrics are offset by debt risk and intensified legal scrutiny. I note ASML’s Altman Z-Score of 12.4 confirms robust financial health, while QUALCOMM’s 6.1 score, though safe, signals more moderate stability.
Final Verdict: Which stock to choose?
ASML’s superpower lies in its durable competitive advantage, driven by a strong and growing ROIC well above its cost of capital. This cash-generating powerhouse excels in innovation and operational efficiency. Its point of vigilance is a relatively high valuation, which might temper near-term upside. ASML fits well for aggressive growth portfolios seeking market leadership in semiconductor equipment.
QUALCOMM’s strategic moat is its recurring revenue from licensing and dominance in mobile chipsets. It offers a safer profile with solid liquidity and a healthy dividend yield. However, its declining profitability trend warrants caution. QUALCOMM suits investors looking for growth at a reasonable price with a preference for income and capital preservation.
If you prioritize durable value creation with a growth tilt, ASML outshines thanks to its superior profitability and innovation moat. However, if you seek a blend of stability, income, and moderate growth, QUALCOMM offers better stability and a more defensive stance despite its profitability headwinds. Each appeals to distinct investor profiles with contrasting risk appetites.
Disclaimer: Investment carries a risk of loss of initial capital. The past performance is not a reliable indicator of future results. Be sure to understand risks before making an investment decision.
Go Further
I encourage you to read the complete analyses of ASML Holding N.V. and QUALCOMM Incorporated to enhance your investment decisions: