In today’s fast-evolving tech landscape, The Trade Desk, Inc. (TTD) and Asana, Inc. (ASAN) stand out as innovative leaders in the software application sector. While TTD focuses on data-driven digital advertising solutions, ASAN excels in work management platforms, both targeting businesses aiming to optimize productivity and strategy. This comparison explores their market positions and innovation approaches to help you decide which company holds the most promise for your investment portfolio.
Table of contents
Companies Overview
I will begin the comparison between The Trade Desk and Asana by providing an overview of these two companies and their main differences.
The Trade Desk Overview
The Trade Desk, Inc. is a technology company operating a cloud-based platform that enables buyers to create, manage, and optimize data-driven digital advertising campaigns across multiple ad formats and devices. Founded in 2009 and headquartered in Ventura, California, it serves advertising agencies and other service providers globally. The company focuses on delivering value-added services in the digital advertising space with a market cap of approximately 17.3B USD.
Asana Overview
Asana, Inc. operates a work management platform designed to help individuals, teams, and executives coordinate work from daily tasks to complex strategic initiatives. Established in 2008 and based in San Francisco, California, Asana serves a diverse clientele including technology, healthcare, and financial services industries. With a market cap near 2.6B USD, the company emphasizes collaboration and productivity improvements through its software solutions.
Key similarities and differences
Both The Trade Desk and Asana operate in the software application industry within the technology sector, focusing on cloud-based platforms that enhance business processes. The Trade Desk specializes in digital advertising campaign management, targeting marketing agencies, while Asana provides a broader work management tool for various industries. Despite their shared sector, their business models differ significantly, with The Trade Desk concentrating on advertising technology and Asana on task and project management software.
Income Statement Comparison
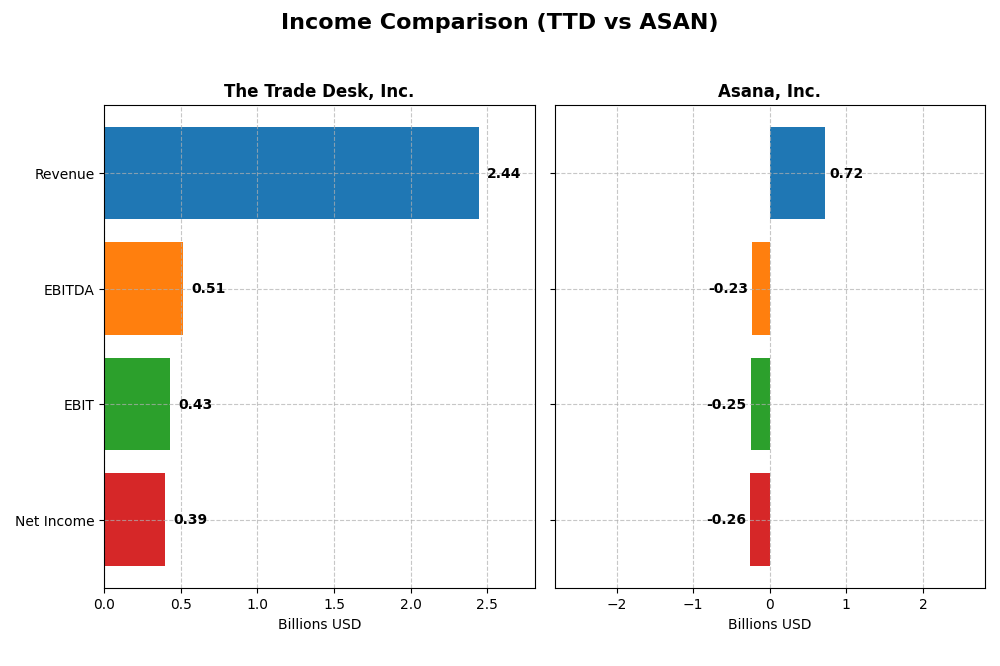
The table below compares the latest full fiscal year income statement metrics for The Trade Desk, Inc. and Asana, Inc., providing a snapshot of their financial performance.
| Metric | The Trade Desk, Inc. (TTD) | Asana, Inc. (ASAN) |
|---|---|---|
| Market Cap | 17.3B | 2.6B |
| Revenue | 2.44B | 724M |
| EBITDA | 515M | -230M |
| EBIT | 427M | -247M |
| Net Income | 393M | -256M |
| EPS | 0.80 | -1.11 |
| Fiscal Year | 2024 | 2025 |
Income Statement Interpretations
The Trade Desk, Inc.
The Trade Desk, Inc. showed strong revenue growth from 2020 to 2024, with a 192% increase, and net income rose 62% over the same period. Margins mostly improved, with a gross margin of 80.69% and net margin at 16.08%. In 2024, revenue grew 25.6% year-over-year, net income more than doubled, and margins remained favorable, indicating robust operational performance.
Asana, Inc.
Asana, Inc. experienced steady revenue growth of 219% from 2021 to 2025, but net income declined 21% overall. Gross margin was high at 89.34%, yet EBIT and net margins stayed negative, reflecting ongoing losses. In 2025, revenue rose 10.9%, net margin improved by 10.4%, and EPS growth was positive, though profitability challenges persist with an EBIT margin of -34.13%.
Which one has the stronger fundamentals?
The Trade Desk presents stronger fundamentals with consistent revenue and net income growth, healthy positive margins, and a favorable overall income statement evaluation. Asana benefits from high gross margins and revenue growth but struggles with profitability and negative net margins. Therefore, The Trade Desk’s income statement reflects more stable and profitable operations compared to Asana’s ongoing losses.
Financial Ratios Comparison
Below is a comparison of key financial ratios for The Trade Desk, Inc. (TTD) and Asana, Inc. (ASAN) based on their most recent fiscal year data.
| Ratios | The Trade Desk, Inc. (2024) | Asana, Inc. (2025) |
|---|---|---|
| ROE | 13.3% | -112.3% |
| ROIC | 10.0% | -53.0% |
| P/E | 146.8 | -19.2 |
| P/B | 19.6 | 21.5 |
| Current Ratio | 1.86 | 1.44 |
| Quick Ratio | 1.86 | 1.44 |
| D/E | 0.11 | 1.18 |
| Debt-to-Assets | 5.1% | 30.1% |
| Interest Coverage | 0 | -72.4 |
| Asset Turnover | 0.40 | 0.81 |
| Fixed Asset Turnover | 5.17 | 2.76 |
| Payout ratio | 0 | 0 |
| Dividend yield | 0 | 0 |
Interpretation of the Ratios
The Trade Desk, Inc.
The Trade Desk displays mostly favorable financial ratios, reflecting solid net margin (16.08%) and return on invested capital (10.02%), though its high P/E (146.77) and P/B (19.56) ratios suggest expensive valuation. The company maintains a strong liquidity position with a current ratio of 1.86 and low debt levels. It does not pay dividends, likely focusing on growth and reinvestment.
Asana, Inc.
Asana’s ratios indicate challenges, with negative net margin (-35.3%), return on equity (-112.31%), and return on invested capital (-53.03%), signaling operational losses and weak profitability. The company carries high debt-to-equity (1.18) and poor interest coverage (-67.09). Asana also does not pay dividends, consistent with its reinvestment strategy and growth phase.
Which one has the best ratios?
The Trade Desk’s ratios are predominantly favorable, reflecting profitability, strong liquidity, and manageable debt, despite high valuation multiples. In contrast, Asana shows mostly unfavorable ratios with losses and financial strain. Therefore, The Trade Desk presents a stronger overall ratio profile compared to Asana.
Strategic Positioning
This section compares the strategic positioning of The Trade Desk and Asana, including market position, key segments, and exposure to technological disruption:
The Trade Desk, Inc.
- Leading in digital advertising technology with global reach, facing competitive pressure in ad tech sector.
- Serves advertising agencies with a cloud-based platform across multiple digital ad formats and devices.
- Operates in a rapidly evolving ad tech space with continuous innovation in data-driven campaign optimization.
Asana, Inc.
- Focused on work management software, competing in a fragmented productivity software market.
- Provides a work management platform for teams in various industries, including tech and healthcare.
- Faces technological disruption risks from emerging collaboration tools and platforms.
The Trade Desk vs Asana Positioning
The Trade Desk has a concentrated focus on digital advertising technology with broad platform capabilities, while Asana offers a diversified work management solution across industries. The Trade Desk leverages industry-specific expertise; Asana targets cross-functional team productivity.
Which has the best competitive advantage?
Both companies are shedding value with declining ROIC trends; however, The Trade Desk’s slightly unfavorable moat suggests marginally better capital efficiency compared to Asana’s very unfavorable status and steeper profitability decline.
Stock Comparison
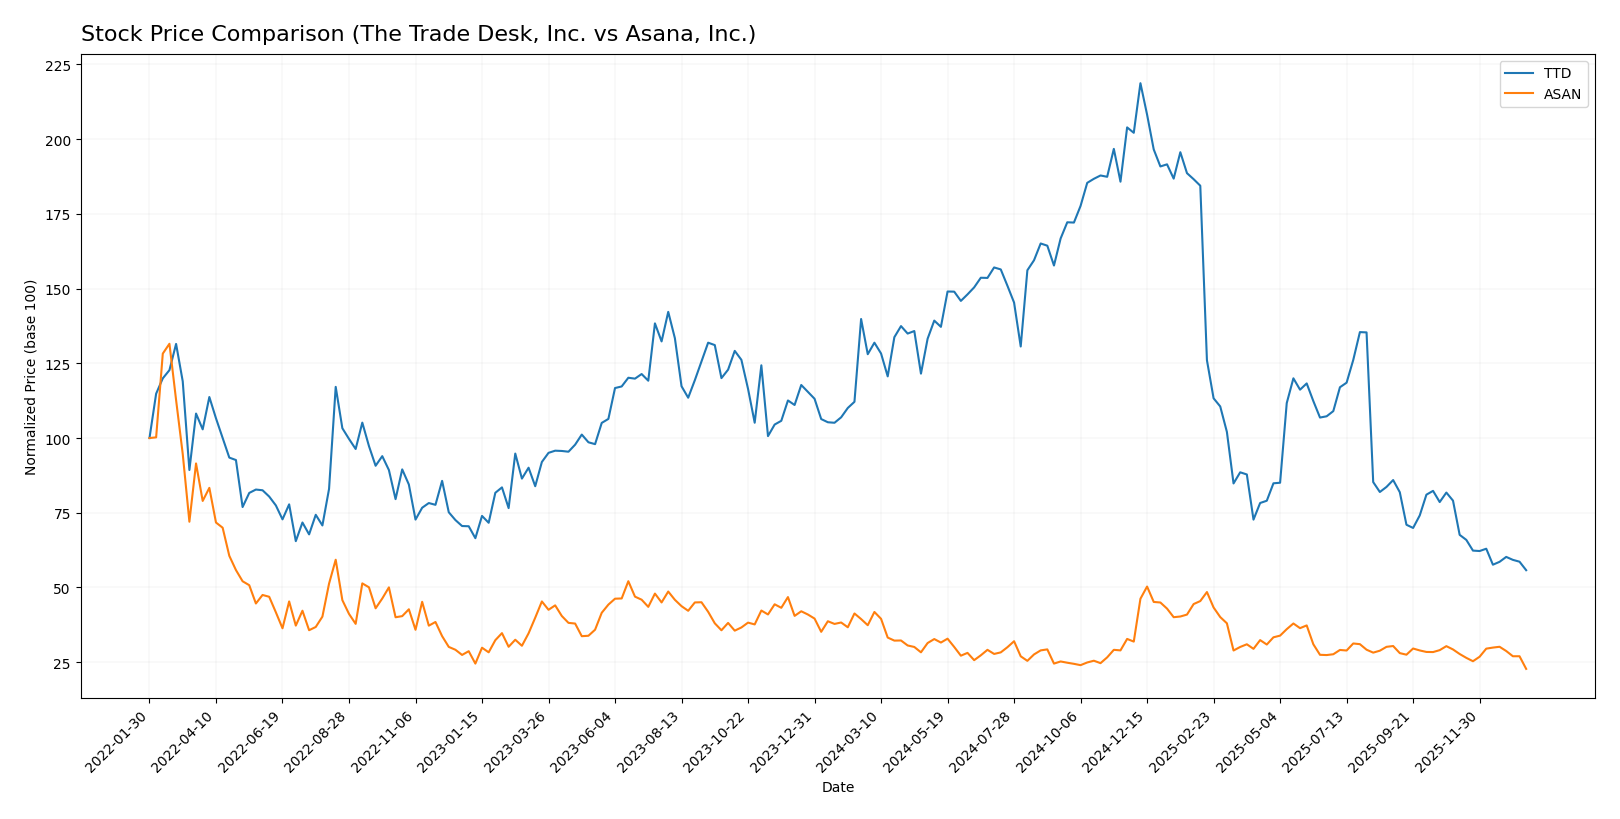
Over the past 12 months, The Trade Desk, Inc. and Asana, Inc. have both experienced significant declines in stock prices, with clear bearish trends and decelerating momentum evident in their trading dynamics.
Trend Analysis
The Trade Desk, Inc. showed a -56.43% price change over the past year, marking a bearish trend with decelerating downward momentum and high volatility (28.36 std deviation). The stock peaked at 139.11 and bottomed at 35.48.
Asana, Inc. also followed a bearish trend with a -39.07% price decline over the same period, featuring deceleration and lower volatility (2.87 std deviation). The stock’s highest price was 24.15 and its lowest was 10.93.
Comparing both stocks, The Trade Desk, Inc. delivered the larger loss, indicating a weaker market performance relative to Asana, Inc. over the last year.
Target Prices
Analysts present a varied but generally positive outlook based on current consensus target prices.
| Company | Target High | Target Low | Consensus |
|---|---|---|---|
| The Trade Desk, Inc. | 98 | 39 | 56.73 |
| Asana, Inc. | 18 | 14 | 15.75 |
The Trade Desk’s consensus target price of 56.73 USD suggests significant upside from its current price of 35.48 USD, indicating potential growth. Asana’s consensus at 15.75 USD also implies a positive outlook from its current price near 10.93 USD.
Analyst Opinions Comparison
This section compares analysts’ ratings and grades for The Trade Desk, Inc. (TTD) and Asana, Inc. (ASAN):
Rating Comparison
TTD Rating
- Rating: B, classified as Very Favorable.
- Discounted Cash Flow Score: 4, indicating a Favorable valuation.
- ROE Score: 4, showing strong profit generation from equity.
- ROA Score: 4, reflecting effective asset utilization.
- Debt To Equity Score: 3, suggesting moderate financial risk.
- Overall Score: 3, representing a Moderate overall financial standing.
ASAN Rating
- Rating: D+, classified as Very Favorable.
- Discounted Cash Flow Score: 1, indicating a Very Unfavorable valuation.
- ROE Score: 1, indicating very weak profit generation from equity.
- ROA Score: 1, reflecting poor asset utilization.
- Debt To Equity Score: 1, indicating very high financial risk.
- Overall Score: 1, representing a Very Unfavorable overall financial standing.
Which one is the best rated?
Based strictly on the provided data, TTD is clearly better rated than ASAN across all measured financial scores, including valuation, profitability, asset use, financial risk, and overall standing.
Scores Comparison
Here is a comparison of the Altman Z-Score and Piotroski Score for the two companies:
TTD Scores
- Altman Z-Score: 4.30, indicating a safe zone with low bankruptcy risk.
- Piotroski Score: 5, categorized as average financial strength.
ASAN Scores
- Altman Z-Score: -0.27, indicating distress zone and high bankruptcy risk.
- Piotroski Score: 4, also categorized as average financial strength.
Which company has the best scores?
TTD shows a significantly stronger Altman Z-Score, reflecting better financial stability compared to ASAN’s distress zone status. Both companies have similar average Piotroski Scores, indicating comparable financial strength.
Grades Comparison
Here is a comparison of recent grades assigned to The Trade Desk, Inc. and Asana, Inc. by recognized grading companies:
The Trade Desk, Inc. Grades
This table summarizes recent grades and rating actions from reputable financial institutions for The Trade Desk, Inc.:
| Grading Company | Action | New Grade | Date |
|---|---|---|---|
| Morgan Stanley | Maintain | Equal Weight | 2026-01-13 |
| Wells Fargo | Maintain | Equal Weight | 2026-01-12 |
| Cantor Fitzgerald | Maintain | Neutral | 2026-01-08 |
| Wolfe Research | Maintain | Outperform | 2026-01-06 |
| Guggenheim | Maintain | Buy | 2026-01-05 |
| Jefferies | Maintain | Hold | 2025-12-11 |
| Wedbush | Maintain | Neutral | 2025-12-08 |
| DA Davidson | Maintain | Buy | 2025-11-10 |
| Truist Securities | Maintain | Buy | 2025-11-07 |
| Wells Fargo | Maintain | Equal Weight | 2025-11-07 |
The Trade Desk’s grades show a balanced mix of Buy, Hold, and Equal Weight recommendations, with a few Outperform ratings, indicating moderate confidence from analysts.
Asana, Inc. Grades
This table presents recent grades and rating actions from credible grading firms for Asana, Inc.:
| Grading Company | Action | New Grade | Date |
|---|---|---|---|
| Citigroup | Upgrade | Buy | 2026-01-15 |
| RBC Capital | Maintain | Underperform | 2026-01-05 |
| Keybanc | Upgrade | Overweight | 2025-12-15 |
| DA Davidson | Maintain | Neutral | 2025-12-04 |
| Citigroup | Maintain | Neutral | 2025-12-03 |
| RBC Capital | Maintain | Underperform | 2025-12-03 |
| UBS | Maintain | Neutral | 2025-12-03 |
| Baird | Maintain | Neutral | 2025-09-04 |
| Morgan Stanley | Maintain | Underweight | 2025-09-04 |
| Piper Sandler | Maintain | Overweight | 2025-09-04 |
Asana’s grades display a wider range, including Buy and Overweight upgrades alongside Underperform and Neutral ratings, reflecting a more mixed analyst sentiment.
Which company has the best grades?
The Trade Desk, Inc. has received more consistent Buy and Outperform ratings, whereas Asana, Inc. shows a broader spread including Underperform grades. This suggests investors may see The Trade Desk as having a more stable outlook, while Asana’s varied grades imply higher uncertainty or mixed expectations.
Strengths and Weaknesses
Below is a comparison of The Trade Desk, Inc. (TTD) and Asana, Inc. (ASAN) highlighting their key strengths and weaknesses based on recent financial and operational data.
| Criterion | The Trade Desk, Inc. (TTD) | Asana, Inc. (ASAN) |
|---|---|---|
| Diversification | Moderate; focused on digital advertising | Limited; primarily software platform |
| Profitability | Favorable net margin (16.08%), positive ROIC (10.02%) | Unfavorable net margin (-35.3%), negative ROIC (-53.03%) |
| Innovation | Strong in advertising technology | Moderate; innovation in productivity software |
| Global presence | Established global footprint | Growing but less extensive globally |
| Market Share | Significant in digital ad tech | Smaller market share in SaaS productivity |
Key takeaways: The Trade Desk shows stronger profitability and a more favorable financial profile, indicating better value creation and operational efficiency. Asana struggles with profitability and value destruction, reflecting higher risk and challenges in scaling profitably. Investors should weigh these factors carefully considering their risk tolerance.
Risk Analysis
Below is a comparison of key risk factors for The Trade Desk, Inc. (TTD) and Asana, Inc. (ASAN) based on the most recent data available in 2026.
| Metric | The Trade Desk, Inc. (TTD) | Asana, Inc. (ASAN) |
|---|---|---|
| Market Risk | Moderate (Beta 1.105) | Moderate (Beta 0.916) |
| Debt Level | Low (D/E 0.11, 5.11% assets) | High (D/E 1.18, 30.11% assets) |
| Regulatory Risk | Moderate | Moderate |
| Operational Risk | Moderate | Moderate |
| Environmental Risk | Low | Low |
| Geopolitical Risk | Moderate | Moderate |
The most impactful and likely risks are the high debt burden for Asana, increasing its financial vulnerability, and market volatility affecting both companies moderately. The Trade Desk shows stronger financial stability and lower default risk, while Asana’s negative profitability and distress-level Altman Z-score indicate higher bankruptcy risk.
Which Stock to Choose?
The Trade Desk, Inc. (TTD) shows favorable income growth with a 25.63% revenue increase in 2024 and strong profitability metrics including a 16.08% net margin. Its financial ratios are mostly favorable, demonstrating solid liquidity and low debt, supported by a very favorable B rating. However, its economic moat appears slightly unfavorable due to declining ROIC relative to WACC.
Asana, Inc. (ASAN) reports favorable revenue growth of 10.94% in 2025 but suffers from negative profitability, with a -35.3% net margin and several unfavorable financial ratios including high debt levels. Despite a very favorable D+ rating, its economic moat is very unfavorable, showing significant value destruction and declining profitability.
Investors focused on growth and profitability might find The Trade Desk’s stable income and strong financial ratios more appealing, while risk-tolerant investors considering turnaround potential might interpret Asana’s recent revenue growth and rating differently. The decision could depend on the investor’s risk profile and investment horizon.
Disclaimer: Investment carries a risk of loss of initial capital. The past performance is not a reliable indicator of future results. Be sure to understand risks before making an investment decision.
Go Further
I encourage you to read the complete analyses of The Trade Desk, Inc. and Asana, Inc. to enhance your investment decisions: