Home > Comparison > Technology > MSFT vs ARQQ
The strategic rivalry between Microsoft Corporation and Arqit Quantum Inc. shapes the future of the technology sector. Microsoft, a capital-intensive software infrastructure giant, contrasts sharply with Arqit, a nimble cybersecurity innovator focused on quantum encryption. This head-to-head highlights the tension between established scale and disruptive potential. This analysis aims to identify which company offers the superior risk-adjusted trajectory for a diversified portfolio amid evolving technological demands.
Table of contents
Companies Overview
Microsoft Corporation and Arqit Quantum Inc. both drive innovation in software infrastructure with vastly different scales and strategies.
Microsoft Corporation: Global Software Powerhouse
Microsoft dominates the software infrastructure market by licensing and supporting a broad portfolio including cloud services, productivity tools, and operating systems. Its revenue engine spans three segments: Productivity and Business Processes, Intelligent Cloud, and More Personal Computing. In 2026, Microsoft emphasizes cloud expansion and AI integration to sustain its competitive edge worldwide.
Arqit Quantum Inc.: Cutting-Edge Cybersecurity Innovator
Arqit Quantum focuses on quantum-based cybersecurity solutions via satellite and terrestrial platforms. Its core offering, QuantumCloud, enables secure encryption key generation for any device. In 2026, Arqit prioritizes scaling its novel security technology to establish a foothold in the evolving cyber defense market, targeting high-security clients primarily in the UK.
Strategic Collision: Similarities & Divergences
Both firms operate in the software infrastructure space but diverge sharply in scale and approach. Microsoft pursues a broad, integrated ecosystem across cloud, productivity, and devices. Arqit adopts a specialized niche with quantum encryption technology. Their primary battleground lies in secure cloud services. Microsoft offers diversified stability; Arqit presents high-risk, high-potential innovation.
Income Statement Comparison
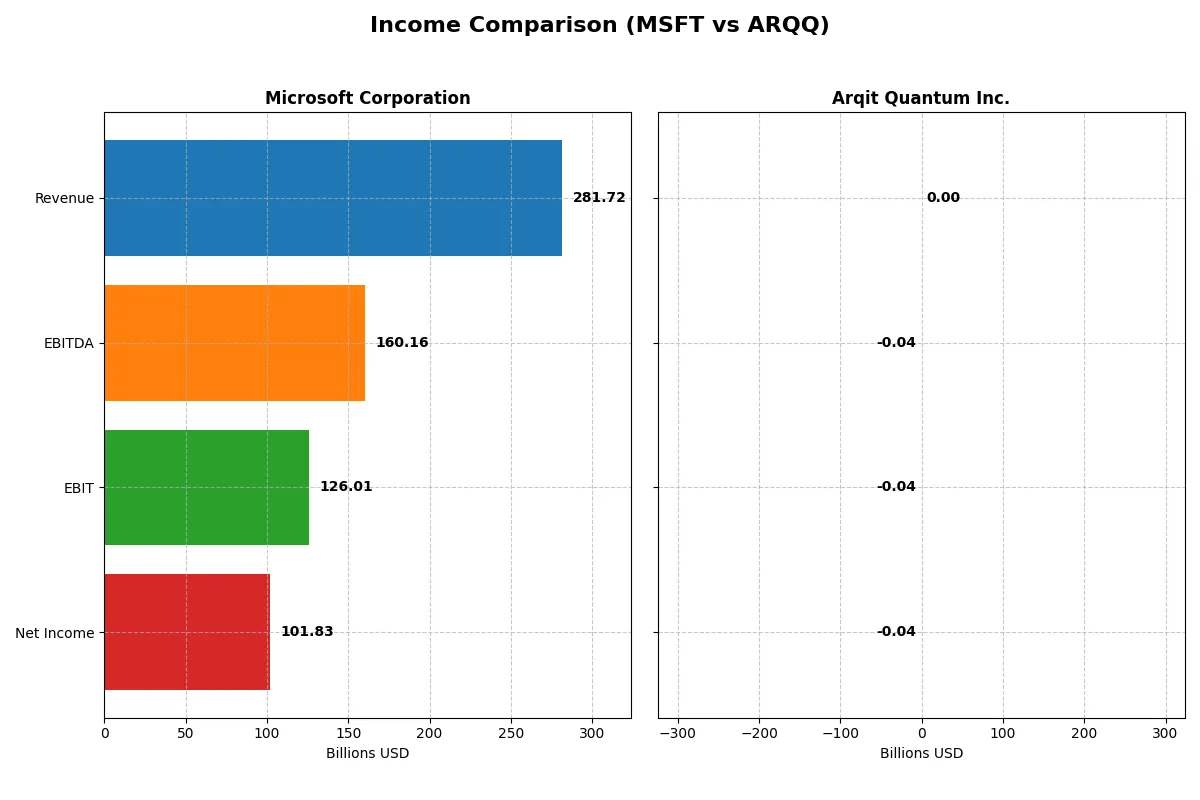
The following data dissects the core profitability and scalability of both corporate engines to reveal who dominates the bottom line:
| Metric | Microsoft Corporation (MSFT) | Arqit Quantum Inc. (ARQQ) |
|---|---|---|
| Revenue | 282B | 530K |
| Cost of Revenue | 88B | 760K |
| Operating Expenses | 65.4B | 38.7M |
| Gross Profit | 194B | -230K |
| EBITDA | 160.2B | -36.8M |
| EBIT | 126B | -37.6M |
| Interest Expense | 2.39B | 48K |
| Net Income | 101.8B | -35.3M |
| EPS | 13.7 | -2.56 |
| Fiscal Year | 2025 | 2025 |
Income Statement Analysis: The Bottom-Line Duel
This income statement comparison reveals which company runs its operations most efficiently and sustains profitability over time.
Microsoft Corporation Analysis
Microsoft’s revenue climbed steadily from $168B in 2021 to $282B in 2025, with net income rising from $61B to $102B. The firm maintains robust gross margins near 69% and net margins above 36%, signaling excellent cost control. In 2025, Microsoft’s efficient scale and strong operating leverage drive a 15.6% EPS growth, underscoring its powerful momentum.
Arqit Quantum Inc. Analysis
Arqit’s revenue rose sharply from $48K in 2021 to $530K in 2025, yet it remains a loss-making venture with a net loss of $35M in 2025. The company posts negative gross and net margins (-43% and -6668%, respectively), reflecting its early-stage status and high operating expenses. Despite revenue growth of 81% in the latest year, profitability remains distant, with heavy losses continuing.
Scale and Profitability: Giant Stability vs. Emerging Growth
Microsoft dominates with vast scale, consistent profitability, and healthy margins, showcasing mature operational strength. Arqit exhibits impressive revenue growth but struggles with deep losses and negative margins. For investors prioritizing earnings stability and margin power, Microsoft presents a far more attractive profile than Arqit’s high-risk, early-stage growth trajectory.
Financial Ratios Comparison
These vital ratios act as a diagnostic tool to expose the underlying fiscal health, valuation premiums, and capital efficiency of the companies analyzed:
| Ratios | Microsoft Corporation (MSFT) | Arqit Quantum Inc. (ARQQ) |
|---|---|---|
| ROE | 29.6% | -129.8% |
| ROIC | 22.0% | -127.5% |
| P/E | 36.3 | -15.1 |
| P/B | 10.8 | 19.6 |
| Current Ratio | 1.35 | 2.69 |
| Quick Ratio | 1.35 | 2.69 |
| D/E (Debt-to-Equity) | 0.18 | 0.03 |
| Debt-to-Assets | 9.8% | 1.7% |
| Interest Coverage | 53.9 | -802.9 |
| Asset Turnover | 0.46 | 0.01 |
| Fixed Asset Turnover | 1.23 | 0.74 |
| Payout Ratio | 23.6% | 0 |
| Dividend Yield | 0.65% | 0 |
| Fiscal Year | 2025 | 2025 |
Efficiency & Valuation Duel: The Vital Signs
Financial ratios act as a company’s DNA, uncovering hidden risks and operational strengths behind the numbers investors see.
Microsoft Corporation
Microsoft delivers strong profitability with a 29.65% ROE and a robust 36.15% net margin, signaling operational excellence. However, its valuation appears stretched, with a P/E of 36.31 and P/B of 10.76, both unfavorable versus peers. Shareholders receive modest dividends (0.65% yield), complemented by solid reinvestment in R&D (11.5% of revenue) driving growth.
Arqit Quantum Inc.
Arqit suffers severe profitability issues, posting a -129.77% ROE and deeply negative margins, reflecting operational losses. Its valuation is mixed: a negative P/E but an expensive P/B at 19.62, highlighting investor caution. The company pays no dividend, relying on cash preservation and minimal debt (D/E 0.03) while facing unfavorable cash flow and asset turnover ratios.
Premium Valuation vs. Operational Risk
Microsoft offers a compelling balance of high profitability and solid capital allocation despite a premium valuation. Arqit’s ratios reveal deep operational distress and valuation risk. Conservative investors seeking stability lean toward Microsoft’s profile, while Arqit fits those accepting higher risk for possible future turnaround.
Which one offers the Superior Shareholder Reward?
I compare Microsoft’s consistent dividend yield near 0.65% and a sustainable payout ratio of 24%, backed by strong free cash flow of 9.6B per share. Microsoft also executes significant buybacks, enhancing total returns. Arqit Quantum pays no dividends and burns cash, with negative margins and free cash flow losses near -2.1B per share. Its reinvestment focuses on R&D and growth, but the financial losses and lack of buybacks raise sustainability concerns. I conclude Microsoft offers a far superior, sustainable shareholder reward profile in 2026.
Comparative Score Analysis: The Strategic Profile
The radar chart reveals the fundamental DNA and trade-offs of Microsoft Corporation and Arqit Quantum Inc., highlighting differing financial strengths and weaknesses:
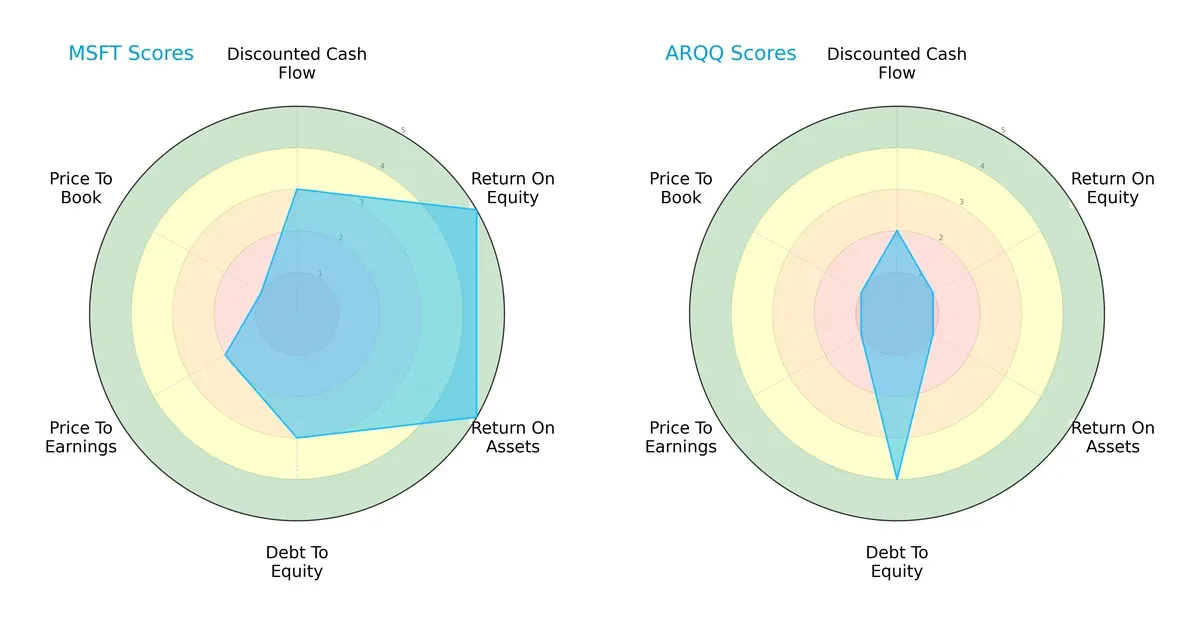
Microsoft dominates in profitability with strong ROE and ROA scores of 5 each, reflecting efficient capital and asset use. Arqit lags with scores of 1 in these metrics, signaling profit generation struggles. However, Arqit’s debt-to-equity score of 4 suggests a more conservative leverage profile compared to Microsoft’s moderate 3. Valuation scores (PE and PB) are weak for both, though Microsoft fares slightly better. Overall, Microsoft presents a more balanced and robust strategic profile, while Arqit relies heavily on low leverage to offset operational weaknesses.
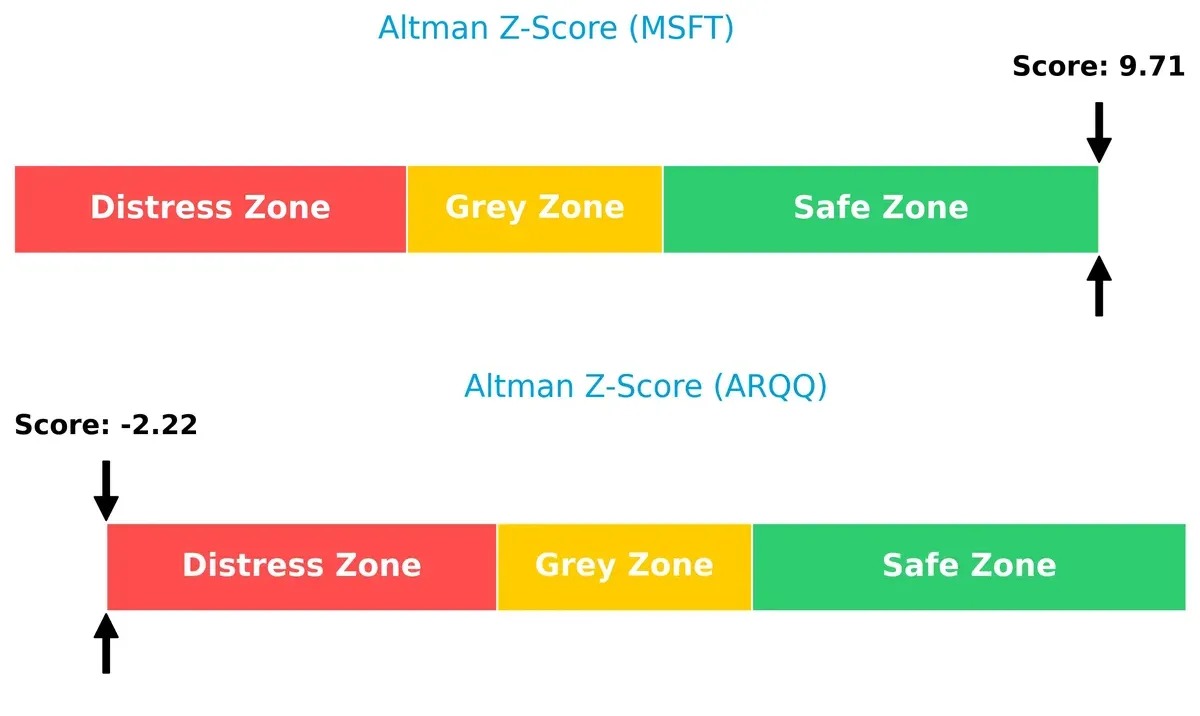
Bankruptcy Risk: Solvency Showdown
Microsoft’s Altman Z-Score of 9.7 places it firmly in the safe zone, indicating strong financial stability and low bankruptcy risk. Arqit’s score of -2.2 signals distress, raising significant concerns about its long-term survival in this cycle:
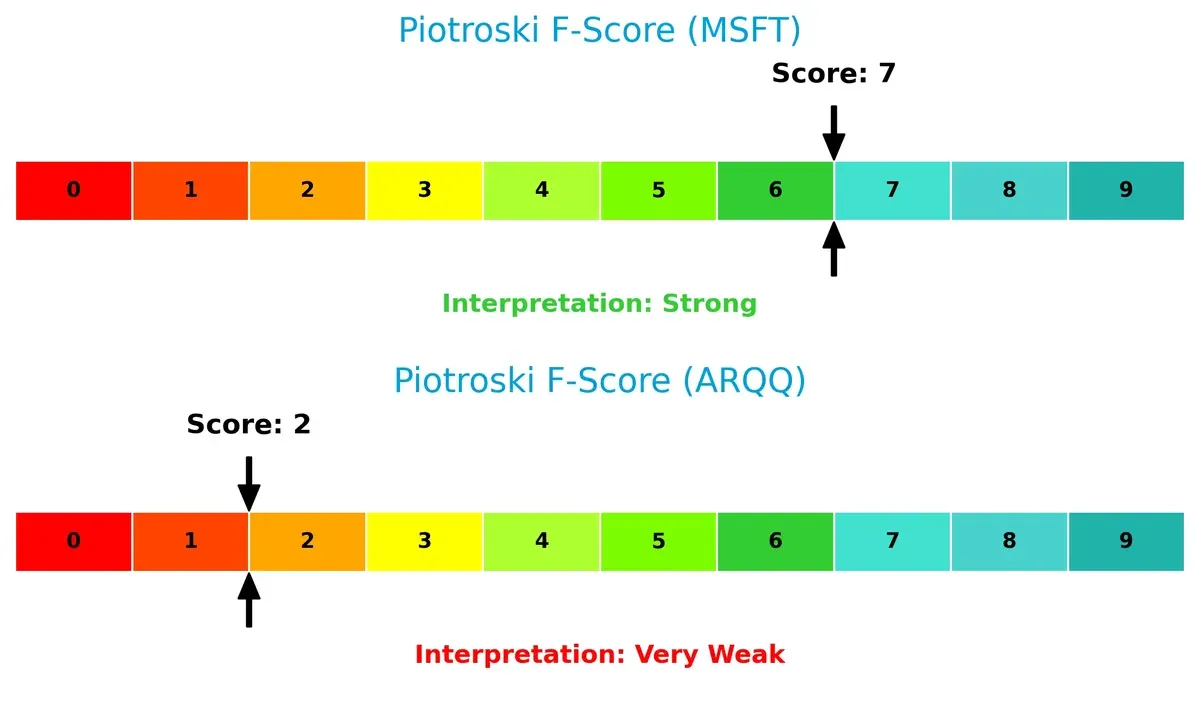
Financial Health: Quality of Operations
Microsoft’s Piotroski F-Score of 7 indicates strong financial health and operational quality. Arqit’s score of 2 flags serious red flags internally, suggesting weak profitability, liquidity, and efficiency metrics compared to Microsoft:
How are the two companies positioned?
This section dissects the operational DNA of Microsoft and Arqit by comparing their revenue distribution and internal dynamics. The goal is to confront their economic moats to identify which model offers the most resilient competitive advantage today.
Revenue Segmentation: The Strategic Mix
The following visual comparison dissects how both firms diversify their income streams and where their primary sector bets lie:
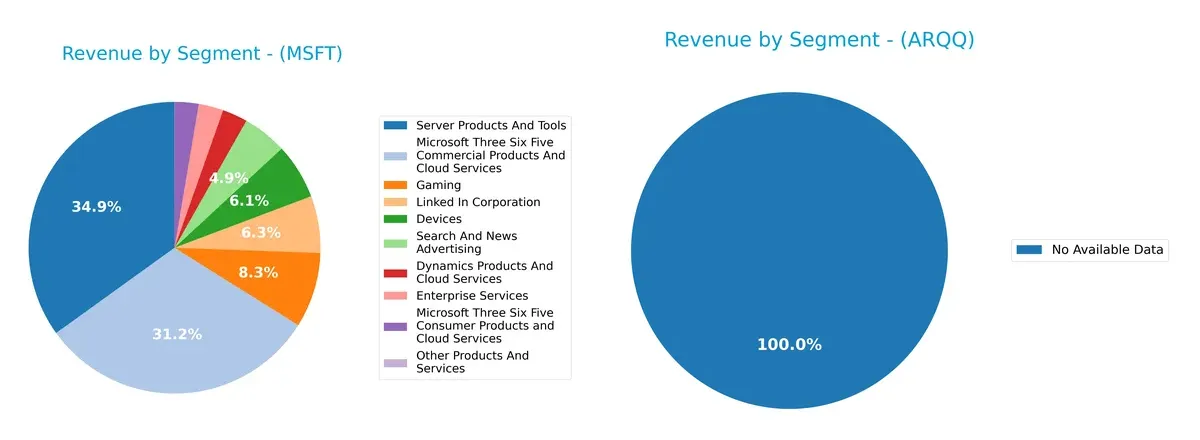
Microsoft dominates with a broad revenue base spanning Server Products and Tools ($98B), Microsoft 365 Commercial ($87.8B), and Gaming ($23.5B). This mix anchors a robust ecosystem lock-in and infrastructure dominance. Arqit Quantum lacks available segment data, preventing direct comparison. Microsoft’s diversified portfolio reduces concentration risk, while Arqit’s unknown segmentation suggests higher dependency risk in fewer sectors. This contrast highlights Microsoft’s strategic advantage in revenue stability and growth.
Strengths and Weaknesses Comparison
This table compares the Strengths and Weaknesses of Microsoft Corporation and Arqit Quantum Inc.:
Microsoft Strengths
- Diverse revenue streams from cloud, gaming, software, devices
- Strong profitability with 36% net margin and 30% ROE
- Robust global presence with $137B international sales
- Low leverage and strong interest coverage ratio
- Innovation leadership in cloud and enterprise services
Arqit Strengths
- Strong liquidity with 2.69 current and quick ratios
- Very low debt levels with 1.68% debt to assets
- Favorable PE ratio despite negative earnings
- Positive cash position supports financial flexibility
Microsoft Weaknesses
- High valuation multiples (PE 36.31, PB 10.76) may pressure returns
- Moderate asset turnover suggests inefficiencies
- Low dividend yield at 0.65% might deter income investors
Arqit Weaknesses
- Deep negative profitability with massive net margin loss
- Negative ROE and ROIC indicate poor capital returns
- High WACC at 15% increases capital costs
- Negative interest coverage signals risk of financial distress
- Very low asset turnover points to operational inefficiency
Microsoft’s strengths lie in its diversified business model and solid profitability, supporting sustained competitive advantage. Arqit faces significant profitability and operational challenges despite strong liquidity, indicating a need for strategic improvement to enhance capital efficiency and reduce risks.
The Moat Duel: Analyzing Competitive Defensibility
A structural moat is the only true defense for long-term profits against relentless competition erosion:
Microsoft Corporation: Ecosystem Lock-in and Intangible Assets
Microsoft’s moat stems from its vast ecosystem and intangible assets, including Office 365 and Azure. This generates a durable ROIC premium near 15%. Although ROIC is slightly declining, expanding cloud and AI services could deepen its moat in 2026.
Arqit Quantum Inc.: Emerging Technology with Growth Potential
Arqit’s moat relies on pioneering quantum encryption technology, distinct from Microsoft’s mature ecosystem moat. It currently sheds value but shows improving ROIC trends. Accelerating adoption of quantum cybersecurity could solidify its competitive edge if it scales effectively.
Ecosystem Dominance vs. Quantum Innovation
Microsoft’s wide, durable ecosystem moat outpaces Arqit’s nascent technology moat, which remains unprofitable. Microsoft is better positioned to defend and grow market share amid evolving tech landscapes.
Which stock offers better returns?
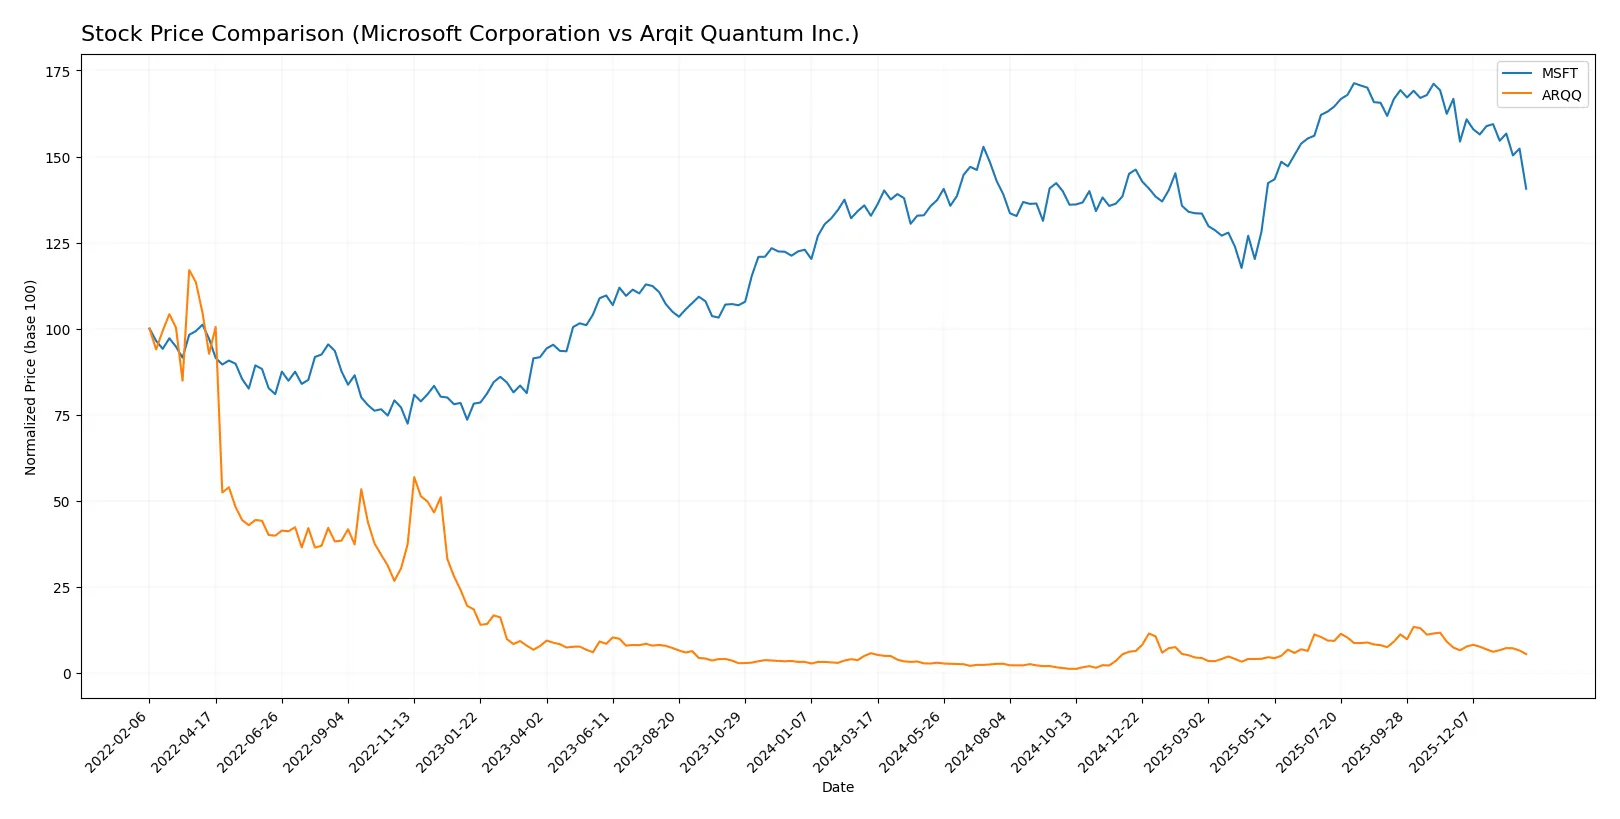
The past year highlights contrasting stock price movements and trading dynamics for Microsoft Corporation and Arqit Quantum Inc., revealing distinct performance trajectories and investor sentiment.
Trend Comparison
Microsoft’s stock recorded a 5.93% gain over the past 12 months, indicating a bullish trend with decelerating momentum. The price ranged from $359.84 to $524.11, showing substantial volatility (std dev 41.93).
Arqit Quantum’s stock declined 4.38% over the same period, reflecting a bearish trend with decelerating pace. Its price fluctuated between $4.19 and $49.92, with lower volatility (std dev 11.73).
Microsoft outperformed Arqit Quantum over the last year, delivering positive returns while Arqit’s stock fell, resulting in stronger market performance for Microsoft.
Target Prices
Analysts present a clear consensus on target prices for Microsoft Corporation and Arqit Quantum Inc.
| Company | Target Low | Target High | Consensus |
|---|---|---|---|
| Microsoft Corporation | 450 | 675 | 600.04 |
| Arqit Quantum Inc. | 60 | 60 | 60 |
The consensus target for Microsoft at 600.04 significantly exceeds the current price of 430.29, indicating strong analyst confidence. Arqit’s fixed target of 60 also suggests substantial upside from its 20.32 market price.

Don’t Let Luck Decide Your Entry Point
Optimize your entry points with our advanced ProRealTime indicators. You’ll get efficient buy signals with precise price targets for maximum performance. Start outperforming now!
How do institutions grade them?
Microsoft Corporation Grades
The following table summarizes recent grades issued by major financial institutions for Microsoft Corporation:
| Grading Company | Action | New Grade | Date |
|---|---|---|---|
| Citigroup | Maintain | Buy | 2026-01-30 |
| Wells Fargo | Maintain | Overweight | 2026-01-29 |
| Wedbush | Maintain | Outperform | 2026-01-29 |
| Scotiabank | Maintain | Sector Outperform | 2026-01-29 |
| RBC Capital | Maintain | Outperform | 2026-01-29 |
| Stifel | Maintain | Buy | 2026-01-29 |
| Evercore ISI Group | Maintain | Outperform | 2026-01-29 |
| Keybanc | Maintain | Overweight | 2026-01-29 |
| Piper Sandler | Maintain | Overweight | 2026-01-29 |
| Cantor Fitzgerald | Maintain | Overweight | 2026-01-29 |
Arqit Quantum Inc. Grades
The following table summarizes recent grades issued by HC Wainwright & Co. for Arqit Quantum Inc.:
| Grading Company | Action | New Grade | Date |
|---|---|---|---|
| HC Wainwright & Co. | Maintain | Buy | 2025-10-13 |
| HC Wainwright & Co. | Maintain | Buy | 2025-09-18 |
| HC Wainwright & Co. | Maintain | Buy | 2024-12-31 |
| HC Wainwright & Co. | Maintain | Buy | 2024-12-06 |
| HC Wainwright & Co. | Maintain | Buy | 2024-07-11 |
| HC Wainwright & Co. | Maintain | Buy | 2024-05-29 |
| HC Wainwright & Co. | Maintain | Buy | 2024-05-15 |
| HC Wainwright & Co. | Maintain | Buy | 2023-11-22 |
| HC Wainwright & Co. | Maintain | Buy | 2023-09-27 |
| HC Wainwright & Co. | Maintain | Buy | 2023-09-26 |
Which company has the best grades?
Microsoft enjoys a broader range of grades from multiple reputable institutions, mostly “Outperform” and “Overweight,” reflecting strong confidence. Arqit Quantum’s ratings come solely from one firm, consistently “Buy,” indicating steady but less diversified endorsement. This divergence may affect investor perception of risk and reliability.
Risks specific to each company
The following categories identify the critical pressure points and systemic threats facing both firms in the 2026 market environment:
1. Market & Competition
Microsoft Corporation
- Operates in a highly competitive, mature tech sector with strong cloud and software rivals.
Arqit Quantum Inc.
- Faces intense competition in emerging quantum cybersecurity with limited market presence.
2. Capital Structure & Debt
Microsoft Corporation
- Maintains low debt-to-equity (0.18) and strong interest coverage (52.84), indicating financial resilience.
Arqit Quantum Inc.
- Very low debt levels but negative interest coverage (-782.67) signal potential liquidity stress.
3. Stock Volatility
Microsoft Corporation
- Beta of 1.07 shows moderate volatility in line with the tech sector norm.
Arqit Quantum Inc.
- High beta at 2.41 reflects elevated stock price swings and speculative risk.
4. Regulatory & Legal
Microsoft Corporation
- Subject to global antitrust scrutiny and data privacy regulations impacting growth.
Arqit Quantum Inc.
- Operates in UK cybersecurity sector, exposed to evolving national and international security laws.
5. Supply Chain & Operations
Microsoft Corporation
- Complex global supply chain with some exposure to hardware component shortages.
Arqit Quantum Inc.
- Smaller scale, dependent on specialized technology partners, vulnerable to supply disruptions.
6. ESG & Climate Transition
Microsoft Corporation
- Strong ESG initiatives with carbon neutrality goals enhancing brand and regulatory compliance.
Arqit Quantum Inc.
- ESG profile less established, potential risk as investors prioritize sustainability metrics.
7. Geopolitical Exposure
Microsoft Corporation
- Global footprint exposes it to US-China tensions and EU regulatory shifts.
Arqit Quantum Inc.
- UK base faces Brexit-related trade uncertainties and geopolitical cybersecurity risks.
Which company shows a better risk-adjusted profile?
Microsoft’s largest risk is regulatory scrutiny that could constrain its dominant market position. For Arqit, the critical risk lies in its financial distress signals, notably negative profitability and fragile liquidity. Microsoft demonstrates a far superior risk-adjusted profile, supported by a safe-zone Altman Z-score (9.7) versus Arqit’s distress zone (-2.2). The stark contrast in debt coverage ratios and profitability underscores my concern over Arqit’s sustainability despite its low leverage.
Final Verdict: Which stock to choose?
Microsoft’s superpower lies in its robust cash generation and strong capital efficiency, consistently delivering value above its cost of capital. Its slight decline in ROIC signals a need for ongoing vigilance. This stock suits investors seeking steady, well-established growth and durable competitive advantage.
Arqit Quantum’s strategic moat is its pioneering position in quantum encryption technology, offering high growth potential amid a nascent industry. Although it lacks financial stability and value creation today, it presents a speculative profile with improving profitability. It may fit portfolios targeting high-risk, early-stage innovation.
If you prioritize reliable value creation and a proven economic moat, Microsoft outshines Arqit with superior financial strength and operational consistency. However, if you seek asymmetric upside from emerging tech and can tolerate volatility, Arqit offers a speculative growth opportunity despite weaker fundamentals. Each stock aligns with distinct investor risk tolerances and time horizons.
Disclaimer: Investment carries a risk of loss of initial capital. The past performance is not a reliable indicator of future results. Be sure to understand risks before making an investment decision.
Go Further
I encourage you to read the complete analyses of Microsoft Corporation and Arqit Quantum Inc. to enhance your investment decisions: