Home > Comparison > Financial Services > ARES vs BEN
The strategic rivalry between Ares Management Corporation and Franklin Resources, Inc. shapes the asset management landscape today. Ares operates as a diversified alternative asset manager, focusing on private equity, credit, and real estate. Franklin Resources, by contrast, centers on traditional mutual funds and public market investments. This analysis explores their contrasting operational models and risk profiles to identify which firm offers the superior risk-adjusted return for a diversified portfolio in 2026.
Table of contents
Companies Overview
Ares Management Corporation and Franklin Resources, Inc. both hold significant positions in the asset management industry.
Ares Management Corporation: Alternative Asset Specialist
Ares Management Corporation dominates alternative asset management across the US, Europe, and Asia. It generates revenue through diversified segments including tradable credit, direct lending, private equity, and real estate investments. In 2026, Ares pushes strategic focus on control or majority stakes in under-capitalized companies and commercial real estate, leveraging its strong foothold in middle-market financing.
Franklin Resources, Inc.: Traditional Asset Manager
Franklin Resources, Inc. operates as a publicly owned asset management holding company serving individuals and institutions globally. It earns primarily through equity, fixed income, balanced, and multi-asset mutual funds. The 2026 strategy centers on expanding public equity and fixed income portfolios while maintaining a broad client base including pension plans and trusts.
Strategic Collision: Similarities & Divergences
Both firms excel in asset management but diverge in approach—Ares focuses on alternative, control-driven investments, while Franklin emphasizes diversified, traditional mutual funds. The battleground lies in capturing institutional and retail assets across credit and equity markets. Ares’ niche in private equity and real estate contrasts with Franklin’s broad-market mutual funds, defining distinct risk and return profiles for investors.
Income Statement Comparison
This table dissects the core profitability and scalability of both corporate engines to reveal who dominates the bottom line:
| Metric | Ares Management Corporation (ARES) | Franklin Resources, Inc. (BEN) |
|---|---|---|
| Revenue | 6.47B | 8.77B |
| Cost of Revenue | 1.39B | 1.72B |
| Operating Expenses | 1.05B | 6.44B |
| Gross Profit | 1.94B | 7.05B |
| EBITDA | 2.00B | 1.41B |
| EBIT | 1.76B | 882M |
| Interest Expense | 0 | 95M |
| Net Income | 527M | 525M |
| EPS | 1.96 | 0.91 |
| Fiscal Year | 2025 | 2025 |
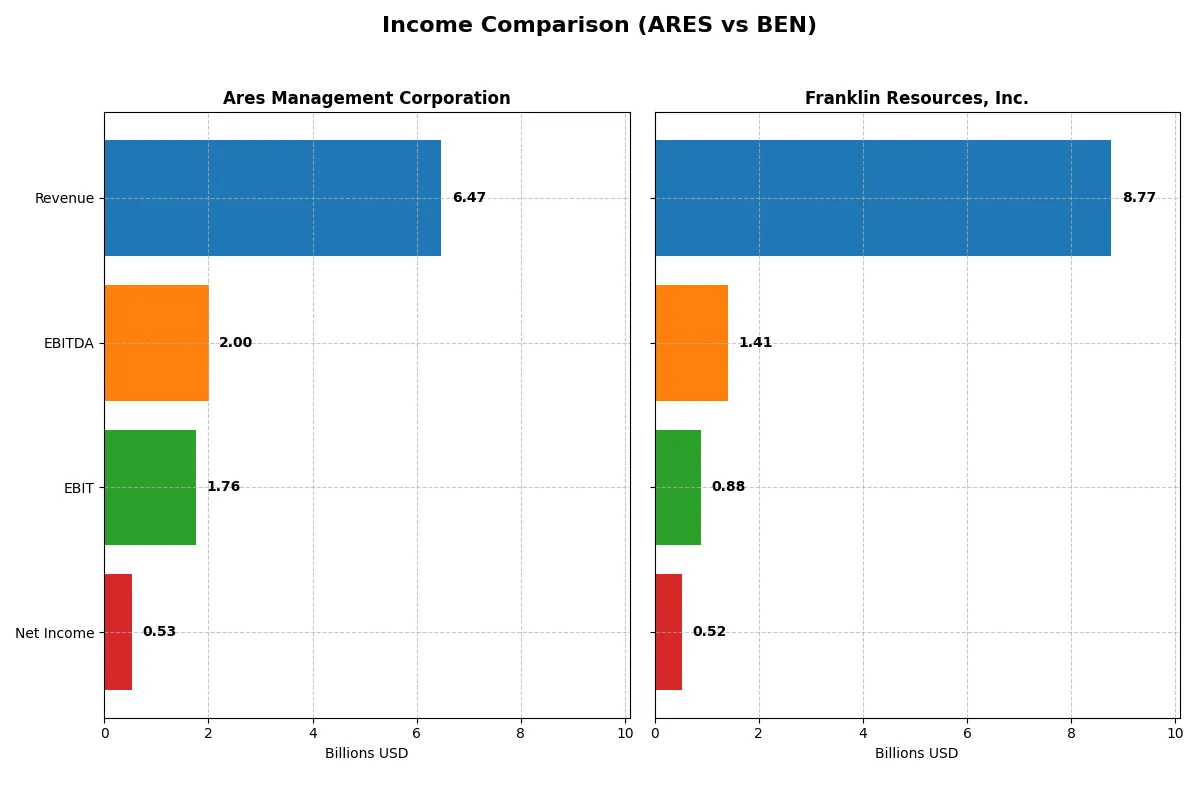
Income Statement Analysis: The Bottom-Line Duel
This income statement comparison unveils the true operating efficiency and profitability of these two financial powerhouses.
Ares Management Corporation Analysis
Ares exhibits strong revenue growth, surging 67% in 2025 to $6.47B, with net income also rising but showing margin pressure. Its gross margin contracts slightly, yet it sustains a healthy 30% gross margin and a solid 8.15% net margin, reflecting efficient cost control despite a 22% EBIT decline. Momentum falters somewhat in profitability, but top-line expansion remains robust.
Franklin Resources, Inc. Analysis
Franklin Resources posts steady revenue growth around 3.5%, reaching $8.77B in 2025, while net income rises modestly to $525M. Its gross margin impresses at 80%, yet EBIT margin shrinks to 10%, signaling operational cost challenges. Net margin improves but remains under 6%. The firm shows stable but limited growth momentum with a mixed profit margin trajectory.
Margin Strength vs. Revenue Expansion
Ares Management leads in revenue growth and maintains robust operating margins despite some margin compression. Franklin Resources offers higher gross margins but slower revenue and profit growth. For investors, Ares’ aggressive top-line momentum and consistent earnings growth present a more dynamic profile, while Franklin’s stable margins favor a conservative approach.
Financial Ratios Comparison
These vital ratios act as a diagnostic tool to expose the underlying fiscal health, valuation premiums, and capital efficiency of the companies compared below:
| Ratios | Ares Management Corporation (ARES) | Franklin Resources, Inc. (BEN) |
|---|---|---|
| ROE | 13.1% (2024) | 4.3% (2025) |
| ROIC | 3.96% (2024) | 1.38% (2025) |
| P/E | 75.6 (2024) | 22.7 (2025) |
| P/B | 9.89 (2024) | 0.99 (2025) |
| Current Ratio | 0.98 (2024) | 2.71 (2025) |
| Quick Ratio | 0.98 (2024) | 2.71 (2025) |
| D/E (Debt to Equity) | 3.71 (2024) | 1.10 (2025) |
| Debt-to-Assets | 52.8% (2024) | 41.1% (2025) |
| Interest Coverage | 0.97 (2024) | 6.37 (2025) |
| Asset Turnover | 0.16 (2024) | 0.27 (2025) |
| Fixed Asset Turnover | 5.64 (2024) | 5.12 (2025) |
| Payout ratio | 283% (2024) | 130% (2025) |
| Dividend yield | 3.74% (2024) | 5.75% (2025) |
| Fiscal Year | 2024 | 2025 |
Efficiency & Valuation Duel: The Vital Signs
Financial ratios act as the company’s DNA, revealing hidden risks and operational excellence within its core business and market valuation.
Ares Management Corporation
ARES shows a modest net margin of 8.15% but reports zero return on equity, signaling weak profitability. Its P/E ratio at 66.62 suggests the stock is expensive and stretched. Yet, a dividend yield of 2.77% provides steady shareholder returns, balancing moderate operational challenges.
Franklin Resources, Inc.
BEN posts a lower net margin of 5.98% and a ROE of 4.35%, indicating limited profitability. Its P/E ratio of 22.67 positions the stock as fairly valued. BEN’s dividend yield of 5.75% offers solid income, supported by favorable liquidity and interest coverage ratios, enhancing shareholder value.
Premium Valuation vs. Operational Safety
ARES demands a premium valuation but struggles with profitability, while BEN presents a more balanced risk profile with steady dividends and healthier liquidity. Investors seeking income and stability may prefer BEN’s profile over ARES’s stretched valuation and weaker returns.
Which one offers the Superior Shareholder Reward?
I see Ares Management Corporation (ARES) offers a 3.7% dividend yield but pays out nearly 283% of earnings, signaling aggressive distributions likely supported by free cash flow. Its buyback program is implied strong, enhancing total returns despite high payout ratios. Franklin Resources, Inc. (BEN) yields 5.7%, with a conservative payout ratio near 130%, backed by solid free cash flow coverage and consistent buybacks. BEN’s distribution model appears more sustainable, balancing dividends and buybacks prudently. I conclude BEN offers a superior total shareholder reward in 2026, combining yield, payout sustainability, and buyback discipline.
Comparative Score Analysis: The Strategic Profile
The radar chart reveals the fundamental DNA and trade-offs of Ares Management Corporation and Franklin Resources, Inc., showcasing their strategic financial profiles:
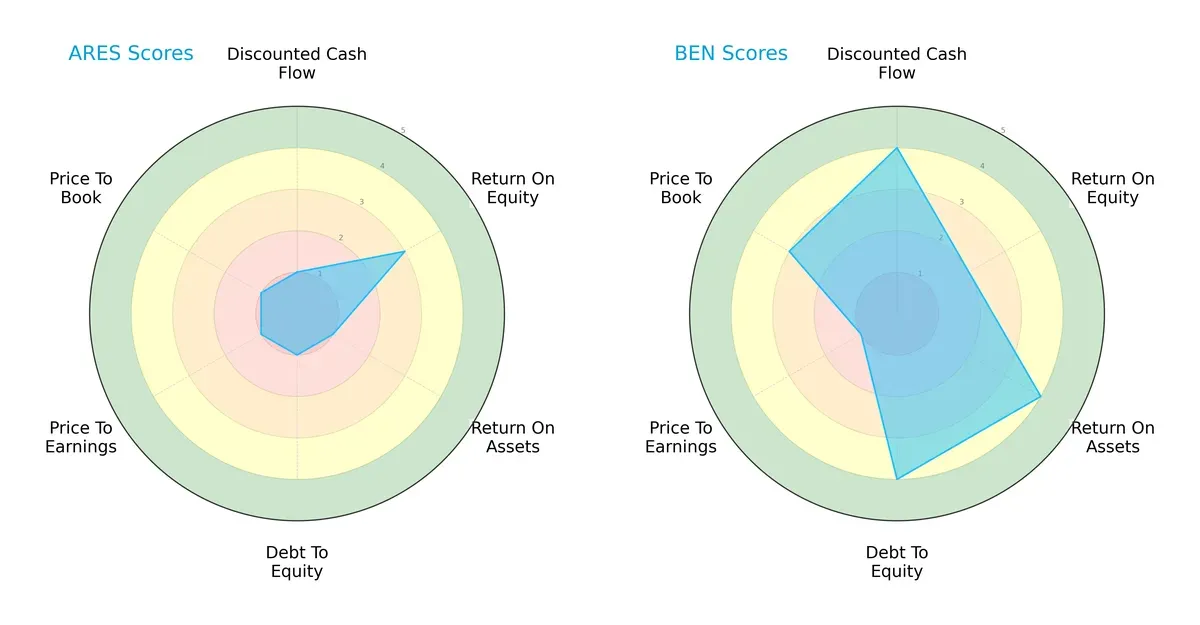
Franklin Resources demonstrates a more balanced scorecard with favorable DCF (4), ROA (4), and debt-to-equity (4) scores, indicating efficient asset use and stronger financial stability. Ares Management relies mainly on moderate ROE (3) but suffers across DCF, ROA, and leverage metrics, highlighting a concentrated competitive edge with significant financial risks.
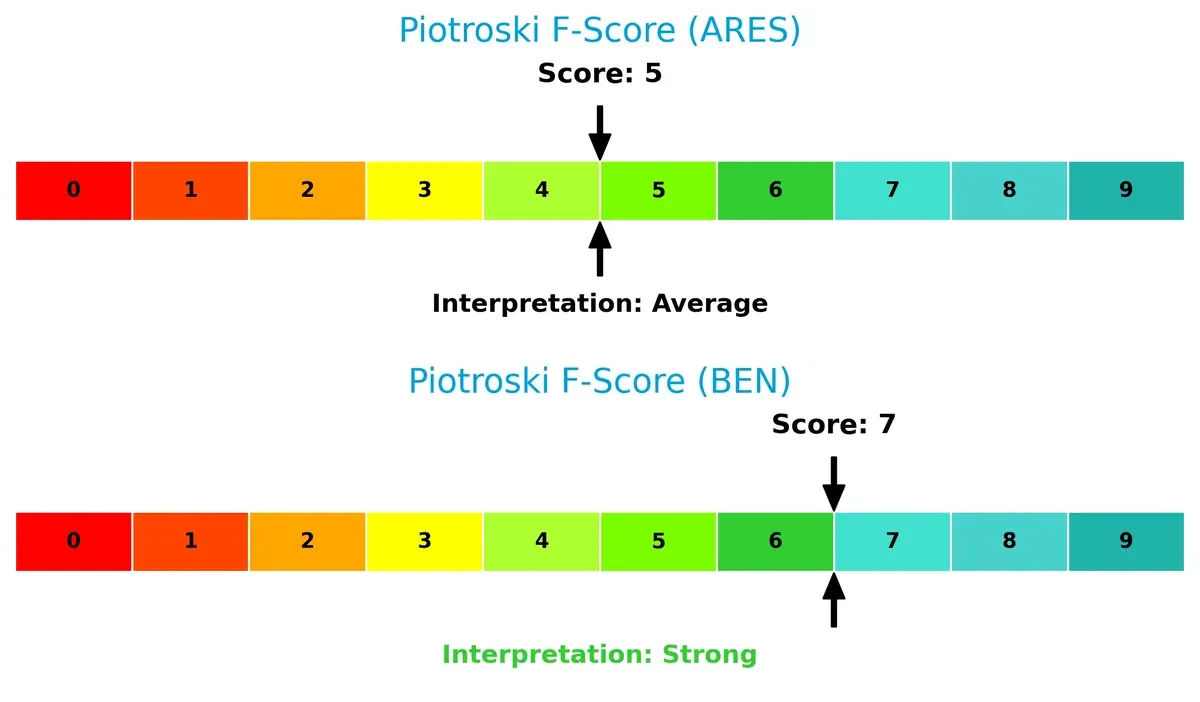
Financial Health: Quality of Operations
Franklin Resources scores a strong 7 on the Piotroski scale, signaling robust operational health and efficient capital allocation. Ares Management’s average score of 5 raises caution about potential internal weaknesses and operational inefficiencies that investors should monitor closely:
How are the two companies positioned?
This section dissects Ares and Franklin’s operational DNA by comparing their revenue distribution and internal strengths and weaknesses. The goal is to confront their economic moats to identify which business model offers the most resilient, sustainable competitive advantage today.
Revenue Segmentation: The Strategic Mix
This visual comparison dissects how Ares Management Corporation and Franklin Resources, Inc. diversify their income streams and where their primary sector bets lie:
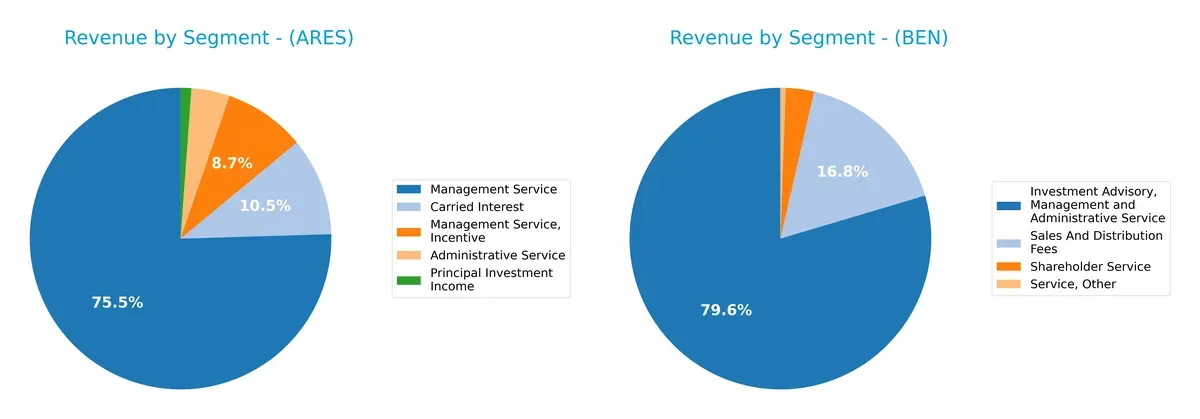
Ares Management leans heavily on Management Service at $3B, anchoring its revenue, while Franklin Resources dominates with $6.8B from Investment Advisory and Management Services. Franklin boasts a more diversified profile, adding $1.4B from Sales and Distribution Fees. Ares’s concentration in management fees and carried interest signals exposure to performance cycles, whereas Franklin’s broader fee base suggests steadier, service-driven income and lower single-segment risk.
Strengths and Weaknesses Comparison
This table compares the Strengths and Weaknesses of Ares Management Corporation and Franklin Resources, Inc.:
Ares Management Corporation Strengths
- Diversified revenue streams including Administrative Service and Carried Interest
- Favorable debt to equity and debt to assets ratios
- High interest coverage ratio demonstrating strong ability to meet debt obligations
- Dividend yield at 2.77% indicating shareholder returns
Franklin Resources, Inc. Strengths
- Large global presence with significant revenues across Americas, Asia Pacific, Europe, Luxembourg, and the US
- Favorable current and quick ratios showing strong liquidity
- Favorable weighted average cost of capital (WACC) at 6.77%
- Favorable fixed asset turnover indicating efficient asset use
- Dividend yield of 5.75% offers steady income
Ares Management Corporation Weaknesses
- Unfavorable return on equity and return on invested capital at 0%
- Unfavorable price-to-earnings ratio at 66.62 suggesting overvaluation
- Unfavorable liquidity ratios including current and quick ratios at 0
- Unfavorable asset turnover metrics indicating inefficiency
Franklin Resources, Inc. Weaknesses
- Unfavorable debt to equity ratio at 1.1 implying higher leverage risk
- Unfavorable return on equity and return on invested capital below cost of capital
- Unfavorable asset turnover ratio at 0.27 suggesting lower efficiency
Overall, Ares shows strengths in debt management and shareholder returns but faces challenges in profitability and liquidity. Franklin Resources benefits from global diversification and liquidity but carries higher leverage and less efficient asset use. Each company’s strategy must consider these financial dynamics to enhance sustainable performance.
The Moat Duel: Analyzing Competitive Defensibility
A structural moat is the only reliable barrier protecting long-term profits from relentless competition erosion. Let’s dissect the moats of two asset managers:
Ares Management Corporation: Diversified Alternative Assets Moat
Ares leverages its control investments and niche financing solutions to sustain high operating margins near 27%. However, recent margin compression and declining ROIC trend raise concerns for 2026’s moat durability.
Franklin Resources, Inc.: Fee-Based Mutual Fund Legacy Moat
Franklin relies on its established brand and scale in mutual funds, reflected in a robust 80% gross margin. Yet, shrinking net income and deteriorating ROIC signal a weakening competitive edge compared to Ares.
Verdict: Alternative Asset Control vs. Traditional Scale
Ares’ diversified asset control offers a deeper moat than Franklin’s fee-dependent mutual fund business, despite recent financial headwinds. I see Ares better positioned to defend market share amid evolving industry dynamics.
Which stock offers better returns?
The past year shows contrasting performances: Ares Management Corporation’s shares edged down slightly, while Franklin Resources, Inc. experienced moderate gains with accelerating momentum.
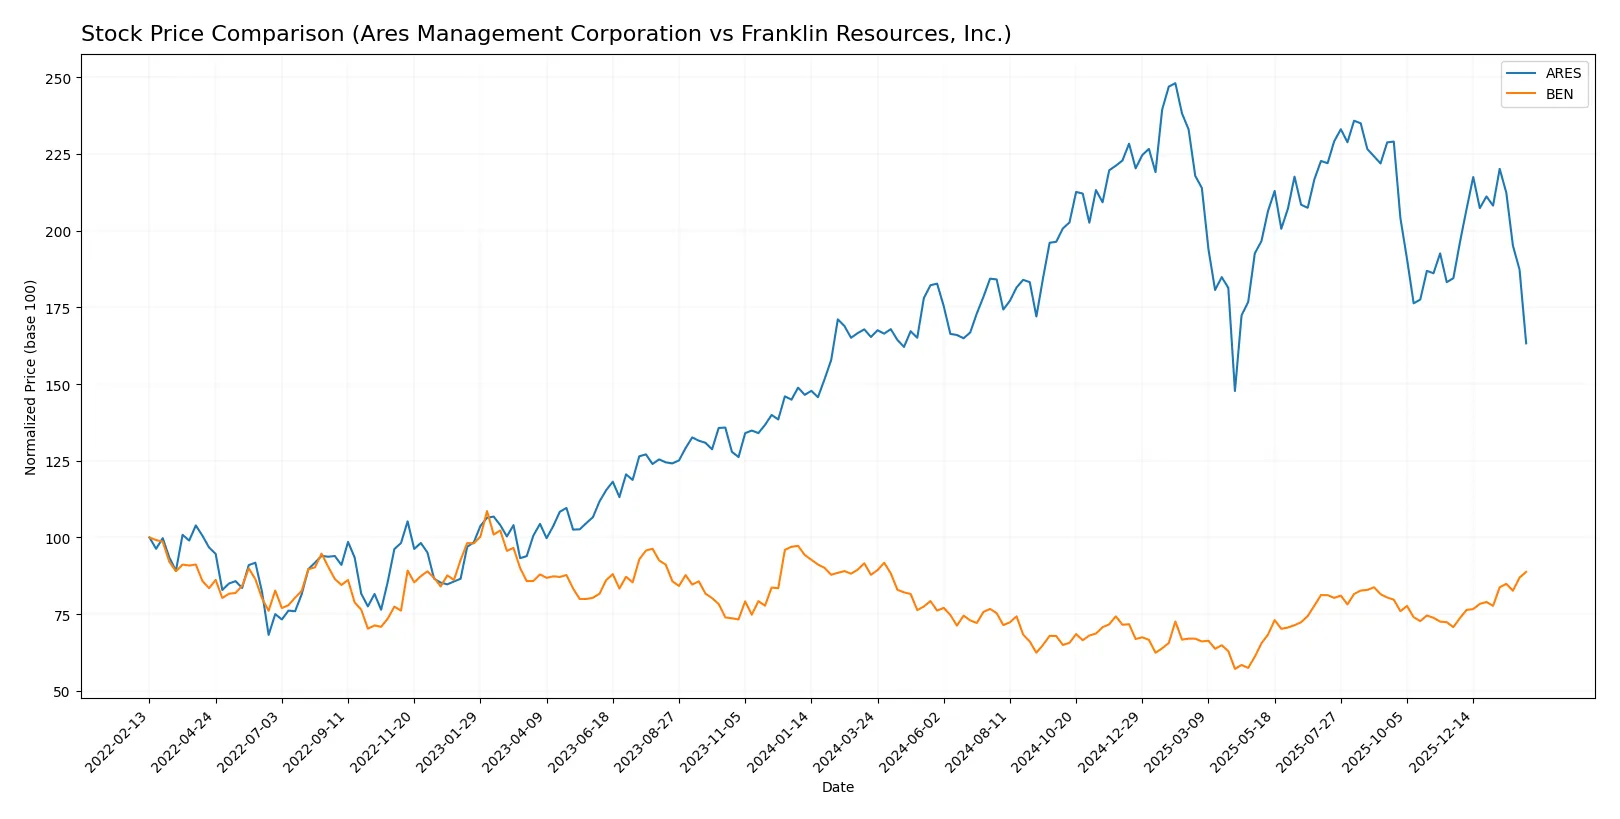
Trend Comparison
Ares Management’s stock declined by 1.25% over the past year, marking a bearish trend with decelerating downside and significant volatility, peaking at 198.22 and bottoming at 118.04.
Franklin Resources posted a 1.12% gain in the same period, reflecting a bullish trend with acceleration, low volatility, and a range between 17.51 and 28.11 per share.
Comparing both, Franklin Resources delivered the highest market performance, showing steady upward acceleration versus Ares’s slight but decelerating decline.
Target Prices
The consensus target prices indicate moderate upside potential for both Ares Management Corporation and Franklin Resources, Inc.
| Company | Target Low | Target High | Consensus |
|---|---|---|---|
| Ares Management Corporation | 155 | 215 | 187.29 |
| Franklin Resources, Inc. | 22 | 25 | 23.5 |
Analysts expect Ares to rise roughly 43% from its current 130.46 price, signaling strong confidence. Franklin Resources’ consensus sits below its current 27.2 price, suggesting limited near-term upside or a possible overvaluation.

Don’t Let Luck Decide Your Entry Point
Optimize your entry points with our advanced ProRealTime indicators. You’ll get efficient buy signals with precise price targets for maximum performance. Start outperforming now!
How do institutions grade them?
Ares Management Corporation Grades
The following table summarizes recent grades for Ares Management Corporation from leading institutions.
| Grading Company | Action | New Grade | Date |
|---|---|---|---|
| Oppenheimer | Maintain | Outperform | 2026-02-06 |
| Barclays | Maintain | Overweight | 2026-02-06 |
| TD Cowen | Maintain | Buy | 2026-01-14 |
| UBS | Maintain | Neutral | 2026-01-13 |
| Barclays | Maintain | Overweight | 2026-01-09 |
| Barclays | Maintain | Overweight | 2025-12-12 |
| Keefe, Bruyette & Woods | Maintain | Outperform | 2025-11-04 |
| TD Cowen | Maintain | Buy | 2025-11-04 |
| Morgan Stanley | Maintain | Equal Weight | 2025-10-21 |
| Oppenheimer | Upgrade | Outperform | 2025-10-14 |
Franklin Resources, Inc. Grades
Here is a summary of recent grades for Franklin Resources, Inc. from recognized financial firms.
| Grading Company | Action | New Grade | Date |
|---|---|---|---|
| Morgan Stanley | Maintain | Underweight | 2026-02-03 |
| Evercore ISI Group | Maintain | Underperform | 2026-02-02 |
| Barclays | Maintain | Underweight | 2026-01-15 |
| TD Cowen | Maintain | Buy | 2026-01-14 |
| Barclays | Maintain | Underweight | 2025-12-12 |
| JP Morgan | Maintain | Neutral | 2025-11-10 |
| Barclays | Maintain | Underweight | 2025-10-21 |
| Evercore ISI Group | Maintain | Underperform | 2025-10-09 |
| B of A Securities | Maintain | Underperform | 2025-10-02 |
| Morgan Stanley | Maintain | Underweight | 2025-08-12 |
Which company has the best grades?
Ares Management Corporation consistently receives positive grades including multiple “Outperform” and “Overweight” ratings. Franklin Resources, Inc. faces predominantly “Underweight” and “Underperform” grades, despite a “Buy” from TD Cowen. Investors may view Ares as the stronger candidate based on institutional sentiment.
Risks specific to each company
In the volatile 2026 market environment, these categories highlight critical pressure points and systemic threats facing both firms:
1. Market & Competition
Ares Management Corporation
- Operates in alternative asset management, facing intense competition in private equity and credit markets.
Franklin Resources, Inc.
- Competes broadly in traditional asset management, pressured by passive funds and fee compression.
2. Capital Structure & Debt
Ares Management Corporation
- Displays a favorable debt profile with strong interest coverage and low leverage risk.
Franklin Resources, Inc.
- Holds higher debt-to-equity ratio (1.1), increasing financial risk despite manageable interest coverage.
3. Stock Volatility
Ares Management Corporation
- Higher beta (1.54) indicates greater stock price volatility relative to the market.
Franklin Resources, Inc.
- Slightly lower beta (1.49) suggests marginally less sensitivity to market swings.
4. Regulatory & Legal
Ares Management Corporation
- Exposure to complex regulations in multiple regions due to global alternative asset operations.
Franklin Resources, Inc.
- Faces regulatory scrutiny typical for mutual fund managers with retail and institutional clients.
5. Supply Chain & Operations
Ares Management Corporation
- Operational risk arises from managing diverse asset classes and geographic dispersion.
Franklin Resources, Inc.
- Relies on extensive fund distribution networks and technology platforms, vulnerable to operational disruptions.
6. ESG & Climate Transition
Ares Management Corporation
- Increasing pressure to integrate ESG criteria in private equity and real estate investments.
Franklin Resources, Inc.
- Must adapt funds to rising ESG mandates and investor demand for sustainable products.
7. Geopolitical Exposure
Ares Management Corporation
- Broad international footprint exposes it to geopolitical risks in Asia and Europe.
Franklin Resources, Inc.
- Limited international reach reduces direct geopolitical risk but remains sensitive to global market shifts.
Which company shows a better risk-adjusted profile?
Ares’ strongest risk is market competition amid alternative asset complexity. Franklin’s main risk lies in elevated leverage increasing financial vulnerability. Franklin Resources shows a better risk-adjusted profile, supported by stronger liquidity ratios and a favorable Piotroski score of 7 versus Ares’ average 5. However, Franklin’s Altman Z-Score in the distress zone signals caution. This mixed picture demands vigilant monitoring of Franklin’s debt levels despite its more balanced operational risk.
Final Verdict: Which stock to choose?
Ares Management Corporation’s superpower lies in its ability to drive strong revenue growth and maintain solid profitability despite cyclical headwinds. Its key point of vigilance is a stretched liquidity profile, which could pressure operations in tighter credit markets. It fits well in aggressive growth portfolios willing to tolerate near-term volatility for upside potential.
Franklin Resources, Inc. offers a strategic moat through steady cash flow generation and a resilient balance sheet, reflecting its focus on disciplined capital allocation. Compared to Ares, it provides better financial stability and a more conservative risk profile. It suits investors targeting growth at a reasonable price with an emphasis on income and capital preservation.
If you prioritize dynamic growth and can withstand liquidity risks, Ares outshines as a compelling choice due to its robust top-line momentum. However, if you seek better stability and consistent cash generation, Franklin Resources offers superior risk management and a more balanced investment case. Each presents a clear analytical scenario depending on your portfolio’s risk tolerance and return goals.
Disclaimer: Investment carries a risk of loss of initial capital. The past performance is not a reliable indicator of future results. Be sure to understand risks before making an investment decision.
Go Further
I encourage you to read the complete analyses of Ares Management Corporation and Franklin Resources, Inc. to enhance your investment decisions: