In today’s fast-evolving digital advertising landscape, AppLovin Corporation (APP) and The Trade Desk, Inc. (TTD) stand out as two innovative leaders in software solutions for mobile and data-driven marketing. Both companies operate cutting-edge platforms that connect advertisers with audiences, yet they differ in scale and strategic focus. This article will guide you through their strengths and risks to identify which stock holds the most promise for your portfolio in 2026.
Table of contents
Companies Overview
I will begin the comparison between AppLovin Corporation and The Trade Desk, Inc. by providing an overview of these two companies and their main differences.
AppLovin Corporation Overview
AppLovin Corporation builds a software-based platform to help mobile app developers enhance marketing and monetization of their apps globally. Their solutions include AppDiscovery for matching advertiser demand with publisher supply, Adjust for analytics and campaign optimization, and MAX for in-app bidding. Founded in 2011 and headquartered in Palo Alto, CA, AppLovin operates in the application software industry with a market cap of $209B.
The Trade Desk, Inc. Overview
The Trade Desk, Inc. operates a cloud-based self-service platform enabling buyers to manage data-driven digital advertising campaigns across multiple formats and devices. Serving advertising agencies and service providers, The Trade Desk provides value-added data services. Incorporated in 2009 and based in Ventura, CA, the company operates within application software and holds a market cap of $18.5B.
Key similarities and differences
Both companies operate in the software application industry, focusing on digital advertising solutions for marketers and advertisers. AppLovin primarily targets mobile app developers with a suite of marketing and monetization tools, while The Trade Desk offers a broader platform for managing cross-channel digital ad campaigns. Market capitalization and scale significantly differ, with AppLovin being substantially larger than The Trade Desk.
Income Statement Comparison
The following table compares the latest fiscal year income statement metrics for AppLovin Corporation and The Trade Desk, Inc., providing key financial figures to evaluate their recent performance.
| Metric | AppLovin Corporation (APP) | The Trade Desk, Inc. (TTD) |
|---|---|---|
| Market Cap | 209B | 18.5B |
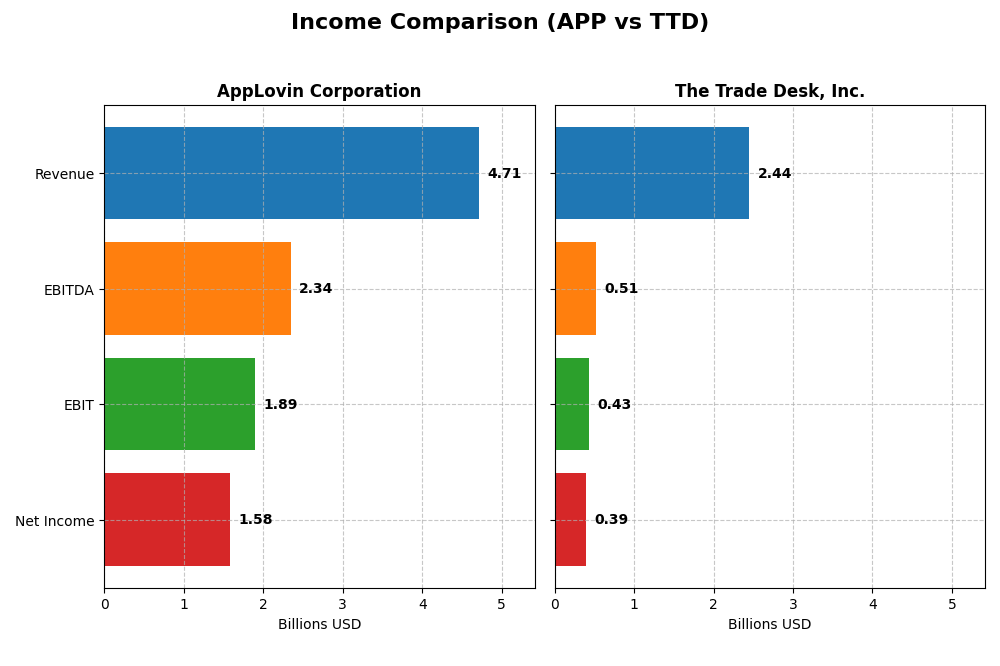
| Revenue | 4.71B | 2.44B |
| EBITDA | 2.34B | 515M |
| EBIT | 1.89B | 427M |
| Net Income | 1.58B | 393M |
| EPS | 4.68 | 0.80 |
| Fiscal Year | 2024 | 2024 |
Income Statement Interpretations
AppLovin Corporation
AppLovin’s revenue surged from $1.45B in 2020 to $4.71B in 2024, with net income swinging from a loss of $125M to a strong profit of $1.58B. Gross and EBIT margins improved significantly, reaching 75.2% and 40.2% respectively in 2024. The latest year showed exceptional growth, with revenue up 43.4% and net margin expanding over 200%, signaling robust operational leverage.
The Trade Desk, Inc.
The Trade Desk’s revenue rose steadily from $836M in 2020 to $2.44B in 2024, while net income grew from $242M to $393M. Gross margin remained high at 80.7%, though EBIT margin was lower at 17.5%. Despite solid revenue growth of 25.6% in 2024, net margin growth was less consistent, declining over the longer period, indicating some margin pressure despite overall favorable income metrics.
Which one has the stronger fundamentals?
AppLovin exhibits stronger fundamentals with higher revenue and net income growth rates and markedly improved margins in 2024. Its net margin and EPS growth outpace The Trade Desk’s, reflecting superior profitability gains. The Trade Desk maintains higher gross margins but faces margin compression long-term. Both companies show favorable income evaluations, yet AppLovin’s recent performance demonstrates more pronounced financial momentum.
Financial Ratios Comparison
The table below presents a side-by-side comparison of key financial ratios for AppLovin Corporation (APP) and The Trade Desk, Inc. (TTD) based on their most recent fiscal year data from 2024.
| Ratios | AppLovin Corporation (APP) | The Trade Desk, Inc. (TTD) |
|---|---|---|
| ROE | 144.96% | 13.33% |
| ROIC | 38.79% | 10.02% |
| P/E | 69.06 | 146.77 |
| P/B | 100.11 | 19.56 |
| Current Ratio | 2.19 | 1.86 |
| Quick Ratio | 2.19 | 1.86 |
| D/E | 3.26 | 0.11 |
| Debt-to-Assets | 60.59% | 5.11% |
| Interest Coverage | 5.89 | 0 |
| Asset Turnover | 0.80 | 0.40 |
| Fixed Asset Turnover | 23.71 | 5.17 |
| Payout ratio | 0 | 0 |
| Dividend yield | 0% | 0% |
Interpretation of the Ratios
AppLovin Corporation
AppLovin shows a mix of favorable and unfavorable financial ratios, with strong net margin at 33.55% and an excellent return on equity of 144.96%, indicating high profitability. However, the company’s elevated debt-to-equity ratio of 3.26 and high debt-to-assets at 60.59% raise leverage concerns. The current and quick ratios near 2.19 suggest good liquidity. AppLovin does not pay dividends, likely reinvesting earnings to support growth and development.
The Trade Desk, Inc.
The Trade Desk presents mostly favorable ratios, including a solid net margin of 16.08% and good return on invested capital at 10.02%. Its low debt-to-equity ratio of 0.11 and debt-to-assets at 5.11% reflect low leverage risk. Liquidity ratios around 1.86 are adequate, though the asset turnover of 0.4 is weaker compared to peers. Like AppLovin, The Trade Desk does not issue dividends, possibly prioritizing reinvestment and innovation.
Which one has the best ratios?
The Trade Desk’s ratios are generally more favorable, with lower leverage and adequate profitability, while AppLovin’s higher returns come with significant debt and valuation concerns. The Trade Desk’s balanced profile and stronger risk metrics suggest a more stable financial footing, whereas AppLovin’s elevated leverage and valuation metrics introduce more risk despite robust profitability.
Strategic Positioning
This section compares the strategic positioning of AppLovin Corporation and The Trade Desk, Inc., including market position, key segments, and exposure to disruption:
AppLovin Corporation
- Market leader with a large market cap of 209B, faces high competitive pressure.
- Focused on mobile app marketing and monetization with advertising and apps segments driving revenue.
- Uses software-based solutions for mobile app marketing; faces disruption from evolving ad tech and data privacy.
The Trade Desk, Inc.
- Smaller market cap of 18.5B, operates in a competitive ad tech market.
- Concentrates on self-service cloud platform for data-driven digital advertising campaigns.
- Cloud-based platform exposed to disruption from multi-channel digital ad technologies.
AppLovin Corporation vs The Trade Desk, Inc. Positioning
AppLovin pursues a diversified approach with multiple revenue streams in advertising and apps, leveraging software platforms, while The Trade Desk focuses on a concentrated digital advertising platform, mainly serving agencies with data-driven campaign tools.
Which has the best competitive advantage?
AppLovin demonstrates a very favorable moat with growing ROIC and strong value creation, indicating durable competitive advantage, whereas The Trade Desk shows a slightly unfavorable moat with declining ROIC and value erosion.
Stock Comparison
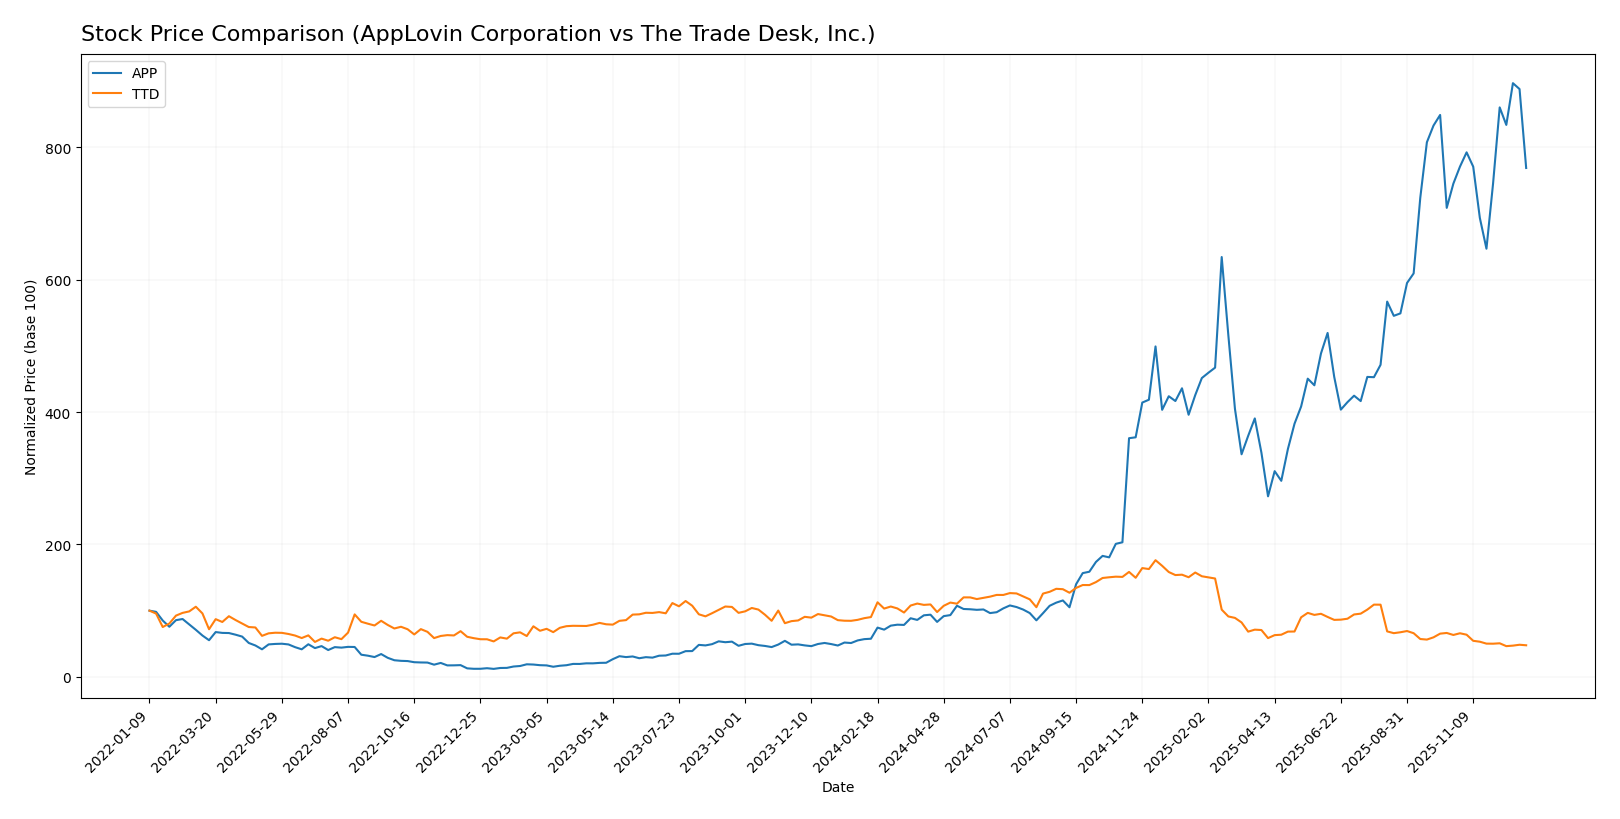
The stock price charts of AppLovin Corporation (APP) and The Trade Desk, Inc. (TTD) reveal contrasting dynamics over the past 12 months, with APP showing a strong bullish acceleration while TTD displays a bearish deceleration.
Trend Analysis
AppLovin Corporation’s stock experienced a striking 1234.02% increase over the past year, indicating a bullish trend with acceleration. The stock fluctuated notably, reaching a high of 721.37 and a low of 46.35, with a high standard deviation of 199.38.
The Trade Desk, Inc. faced a -47.16% decline over the same period, reflecting a bearish trend with deceleration. Its price ranged between 36.65 and 139.11, showing lower volatility with a standard deviation of 27.67.
Comparing the two, AppLovin Corporation has delivered significantly higher market performance than The Trade Desk, Inc. over the last 12 months, demonstrating a robust upward momentum versus a declining trend for TTD.
Target Prices
Analysts present a clear consensus on target prices for AppLovin Corporation and The Trade Desk, Inc.
| Company | Target High | Target Low | Consensus |
|---|---|---|---|
| AppLovin Corporation | 860 | 630 | 737.64 |
| The Trade Desk, Inc. | 98 | 40 | 67.27 |
For AppLovin, the consensus target price of 737.64 is above the current price of 618.32, suggesting moderate upside potential. The Trade Desk’s consensus target of 67.27 significantly exceeds its current price of 37.68, indicating stronger expected growth.
Analyst Opinions Comparison
This section compares analysts’ ratings and grades for AppLovin Corporation and The Trade Desk, Inc.:
Rating Comparison
AppLovin Corporation Rating
- Rating: B, assessed as very favorable by analysts.
- Discounted Cash Flow Score: Moderate at 3, indicating balanced valuation.
- ROE Score: Very favorable at 5, showing efficient profit generation from equity.
- ROA Score: Very favorable at 5, demonstrating strong asset utilization.
- Debt To Equity Score: Very unfavorable at 1, highlighting high financial risk.
- Overall Score: Moderate at 3, summarizing the company’s financial standing.
The Trade Desk, Inc. Rating
- Rating: B, also rated very favorable by analysts.
- Discounted Cash Flow Score: Favorable at 4, suggesting better valuation.
- ROE Score: Favorable at 4, indicating good profit efficiency.
- ROA Score: Favorable at 4, reflecting effective asset use.
- Debt To Equity Score: Moderate at 3, signifying reasonable financial stability.
- Overall Score: Moderate at 3, reflecting a comparable financial position.
Which one is the best rated?
Both companies share the same overall rating and score of B and 3, respectively. However, The Trade Desk shows a more favorable discounted cash flow and debt-to-equity scores, while AppLovin excels in return on equity and assets.
Scores Comparison
The following table compares the Altman Z-Score and Piotroski Score for AppLovin Corporation (APP) and The Trade Desk, Inc. (TTD):
APP Scores
- Altman Z-Score: 30.39, indicating a safe zone.
- Piotroski Score: 7, reflecting a strong rating.
TTD Scores
- Altman Z-Score: 4.65, also in the safe zone.
- Piotroski Score: 5, categorized as average.
Which company has the best scores?
AppLovin exhibits a substantially higher Altman Z-Score and a stronger Piotroski Score than The Trade Desk. Both are in the safe zone for bankruptcy risk, but APP shows better financial strength based on these scores.
Grades Comparison
Here is a comparison of the latest grades assigned to AppLovin Corporation and The Trade Desk, Inc.:
AppLovin Corporation Grades
This table summarizes recent grades from reputable financial institutions for AppLovin Corporation:
| Grading Company | Action | New Grade | Date |
|---|---|---|---|
| Benchmark | Maintain | Buy | 2025-12-11 |
| Jefferies | Maintain | Buy | 2025-12-11 |
| Citigroup | Maintain | Buy | 2025-11-12 |
| Goldman Sachs | Maintain | Neutral | 2025-11-07 |
| Wells Fargo | Maintain | Overweight | 2025-11-07 |
| RBC Capital | Maintain | Outperform | 2025-11-06 |
| Scotiabank | Maintain | Sector Outperform | 2025-11-06 |
| Wedbush | Maintain | Outperform | 2025-11-06 |
| Piper Sandler | Maintain | Overweight | 2025-11-06 |
| BTIG | Maintain | Buy | 2025-11-06 |
AppLovin’s grades are predominantly positive, with several “Buy,” “Outperform,” and “Overweight” ratings, indicating a generally favorable outlook.
The Trade Desk, Inc. Grades
This table presents recent grades from established grading firms for The Trade Desk, Inc.:
| Grading Company | Action | New Grade | Date |
|---|---|---|---|
| Jefferies | Maintain | Hold | 2025-12-11 |
| Wedbush | Maintain | Neutral | 2025-12-08 |
| DA Davidson | Maintain | Buy | 2025-11-10 |
| Needham | Maintain | Buy | 2025-11-07 |
| RBC Capital | Maintain | Outperform | 2025-11-07 |
| Evercore ISI Group | Maintain | Outperform | 2025-11-07 |
| Susquehanna | Maintain | Positive | 2025-11-07 |
| Rosenblatt | Maintain | Buy | 2025-11-07 |
| Truist Securities | Maintain | Buy | 2025-11-07 |
| UBS | Maintain | Buy | 2025-11-07 |
The Trade Desk’s grades show a mix of “Buy,” “Outperform,” and some “Hold” or “Neutral” ratings, reflecting cautious optimism from analysts.
Which company has the best grades?
AppLovin Corporation generally holds consistently strong grades with multiple “Buy” and “Outperform” ratings, while The Trade Desk, Inc. shows a blend of “Buy” and some more moderate “Hold” or “Neutral” opinions. This suggests that AppLovin may be viewed with slightly higher confidence by analysts, possibly impacting investor sentiment and portfolio decisions accordingly.
Strengths and Weaknesses
Below is a comparative overview of key strengths and weaknesses for AppLovin Corporation (APP) and The Trade Desk, Inc. (TTD) based on the most recent financial and operational data.
| Criterion | AppLovin Corporation (APP) | The Trade Desk, Inc. (TTD) |
|---|---|---|
| Diversification | Moderate: Revenue split between Advertising (3.22B) and Apps (1.49B) segments | Limited info; primarily focused on advertising technology |
| Profitability | High net margin (33.55%) and ROIC (38.79%) with growing ROIC trend | Moderate net margin (16.08%) and ROIC (10.02%), but declining ROIC trend |
| Innovation | Strong: Very favorable economic moat due to durable competitive advantage and rising profitability | Weaker: Slightly unfavorable moat, with declining profitability |
| Global presence | Solid global reach through diverse app ecosystem and advertising platform | Established global presence in programmatic advertising |
| Market Share | Significant in mobile advertising with growing platform adoption | Strong in programmatic ad buying, but facing profitability challenges |
Key takeaways: AppLovin shows superior profitability and a durable competitive advantage, supported by strong innovation and a balanced product portfolio. The Trade Desk, while maintaining a favorable financial ratio profile and global footprint, struggles with declining profitability and a less favorable economic moat. Investors should weigh APP’s growth and value creation against TTD’s operational risks.
Risk Analysis
Below is a comparative table outlining key risk metrics for AppLovin Corporation (APP) and The Trade Desk, Inc. (TTD) based on the most recent fiscal year 2024 data:
| Metric | AppLovin Corporation (APP) | The Trade Desk, Inc. (TTD) |
|---|---|---|
| Market Risk | High beta (2.51) indicates volatility and sensitivity to market swings | Moderate beta (1.07), less volatile than APP |
| Debt Level | Elevated debt-to-equity ratio (3.26), debt-to-assets 60.6% – high leverage risk | Low debt-to-equity ratio (0.11), debt-to-assets 5.1% – low leverage risk |
| Regulatory Risk | Moderate, operating in data privacy-sensitive ad tech | Moderate, similar industry with evolving regulations on data use |
| Operational Risk | High reliance on mobile app marketing platforms; potential tech disruption | Diverse digital ad formats reduce operational concentration risk |
| Environmental Risk | Low direct impact, typical for software sector | Low direct impact, software-based business |
| Geopolitical Risk | Exposure to US and international markets; moderate risk | Similar market exposure, moderate geopolitical sensitivity |
In synthesis, AppLovin’s most significant risks stem from its high market volatility and substantial debt load, which could impair financial flexibility during downturns. The Trade Desk presents lower financial risk due to minimal debt but faces challenges from high valuation multiples and operational inefficiencies. Regulatory risks around data privacy remain impactful for both, requiring vigilant monitoring.
Which Stock to Choose?
AppLovin Corporation (APP) shows a strong income evolution with a 224.53% revenue growth over 2020-2024 and highly favorable profitability metrics, including a 33.55% net margin and 144.96% ROE. Despite high debt levels and some unfavorable valuation ratios, its very favorable “B” rating and very strong Altman Z-Score suggest solid financial health.
The Trade Desk, Inc. (TTD) exhibits favorable income growth, with a 192.43% revenue increase and a 16.08% net margin, though its ROE is moderate at 13.33%. The company maintains low debt levels and a favorable overall rating “B,” supported by a safe Altman Z-Score, but it faces a declining ROIC trend and bearish recent stock performance.
For investors prioritizing durable competitive advantage and strong profitability, APP’s very favorable moat and income growth might appear more attractive. Conversely, those valuing lower financial risk and moderate profitability could find TTD’s stable balance sheet and favorable ratios more aligned with a cautious profile. Each stock’s appeal could thus vary depending on the investor’s risk tolerance and strategy emphasis.
Disclaimer: Investment carries a risk of loss of initial capital. The past performance is not a reliable indicator of future results. Be sure to understand risks before making an investment decision.
Go Further
I encourage you to read the complete analyses of AppLovin Corporation and The Trade Desk, Inc. to enhance your investment decisions: