AppLovin Corporation and ServiceTitan, Inc. are two dynamic players in the software application industry, each driving innovation in distinct yet overlapping markets. AppLovin focuses on mobile app marketing and monetization platforms, while ServiceTitan streamlines field service operations for residential and commercial infrastructure. This comparison highlights their growth strategies and market potential, guiding you to identify which company presents the most compelling investment opportunity in 2026.
Table of contents
Companies Overview
I will begin the comparison between AppLovin Corporation and ServiceTitan, Inc. by providing an overview of these two companies and their main differences.
AppLovin Overview
AppLovin Corporation operates a software-based platform designed to help mobile app developers improve marketing and monetization globally. Its key products include AppDiscovery for matching advertisers with publishers, Adjust for app analytics, and MAX for in-app advertising optimization. Founded in 2011 and headquartered in Palo Alto, California, AppLovin is positioned in the software application industry with a market cap of approximately 193B USD.
ServiceTitan Overview
ServiceTitan, Inc. focuses on software solutions supporting field service activities for residential and commercial infrastructure maintenance. Established in 2008 and based in Glendale, California, the company offers technology to streamline installation, maintenance, and service processes. ServiceTitan operates within the software application sector and has a market capitalization near 8.5B USD as of 2026.
Key similarities and differences
Both companies operate in the software application industry and are listed on the NASDAQ Global Select exchange. While AppLovin specializes in mobile app marketing and monetization technology, ServiceTitan targets field service management software for physical infrastructure. AppLovin has a significantly larger market cap and fewer employees compared to ServiceTitan, reflecting their divergent scales and market focuses.
Income Statement Comparison
The table below compares the key income statement metrics for AppLovin Corporation and ServiceTitan, Inc. for their most recent fiscal years.
| Metric | AppLovin Corporation (APP) | ServiceTitan, Inc. (TTAN) |
|---|---|---|
| Market Cap | 193B | 8.5B |
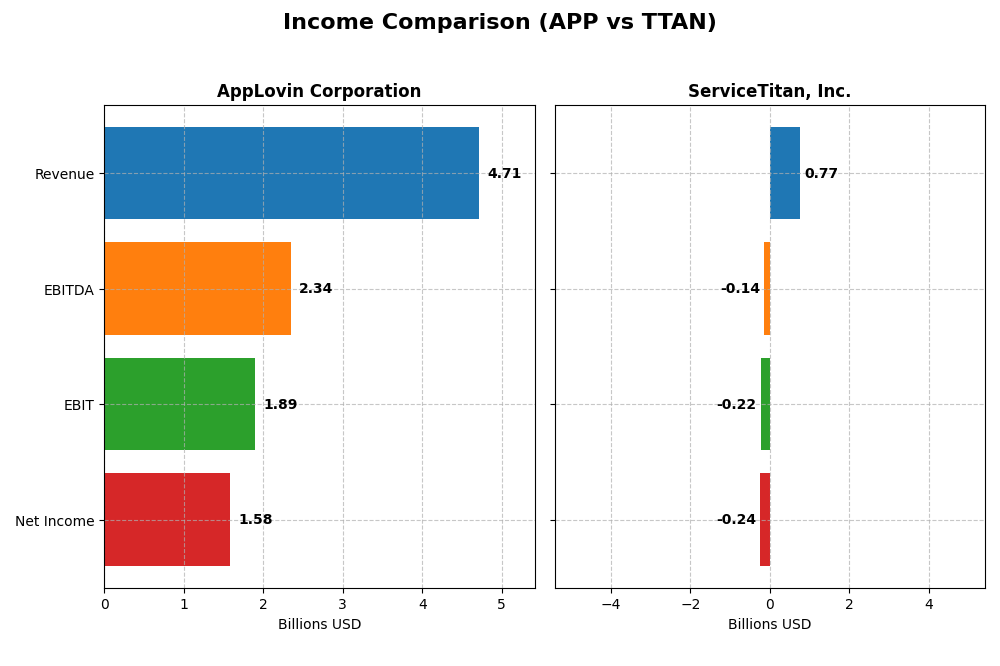
| Revenue | 4.71B | 772M |
| EBITDA | 2.34B | -141M |
| EBIT | 1.89B | -221M |
| Net Income | 1.58B | -239M |
| EPS | 4.68 | -8.53 |
| Fiscal Year | 2024 | 2025 |
Income Statement Interpretations
AppLovin Corporation
AppLovin showed robust revenue growth from 2020 to 2024, surging from 1.45B to 4.71B, with net income turning positive and exceeding 1.57B in 2024. Margins improved notably, with a gross margin of 75.22% and net margin of 33.55% in the latest year. The 2024 performance reflects significant margin expansion and strong earnings growth, indicating operational efficiency gains.
ServiceTitan, Inc.
ServiceTitan’s revenue increased from 468M in 2023 to 772M in 2025, reflecting steady growth, but net income remained negative, with a loss of 239M in 2025. Gross margin stayed favorable at 64.9%, yet EBIT and net margins were negative at -28.67% and -30.98%, respectively. The 2025 results showed slower EBIT decline and modest margin improvements but continued net losses.
Which one has the stronger fundamentals?
AppLovin demonstrates stronger fundamentals with high and improving profitability margins, substantial net income gains, and consistent revenue growth over five years. ServiceTitan, while growing revenue, struggles with sustained losses and unfavorable EBIT and net margins. AppLovin’s favorable income statement metrics outweigh ServiceTitan’s mixed performance, indicating more stable financial health.
Financial Ratios Comparison
Below is a summary comparison of key financial ratios for AppLovin Corporation (APP) and ServiceTitan, Inc. (TTAN) based on their most recent fiscal year data.
| Ratios | AppLovin Corporation (APP) 2024 | ServiceTitan, Inc. (TTAN) 2025 |
|---|---|---|
| ROE | 1.45 | -0.16 |
| ROIC | 0.39 | -0.14 |
| P/E | 69.1 | -18.1 |
| P/B | 100.1 | 3.0 |
| Current Ratio | 2.19 | 3.74 |
| Quick Ratio | 2.19 | 3.74 |
| D/E (Debt to Equity) | 3.26 | 0.11 |
| Debt-to-Assets | 0.61 | 0.09 |
| Interest Coverage | 5.89 | -14.82 |
| Asset Turnover | 0.80 | 0.44 |
| Fixed Asset Turnover | 23.71 | 9.57 |
| Payout ratio | 0 | 0 |
| Dividend yield | 0% | 0% |
Interpretation of the Ratios
AppLovin Corporation
AppLovin exhibits a mix of strong and weak financial ratios, with a favorable net margin of 33.55% and an exceptionally high return on equity at 144.96%, signaling strong profitability. However, its price-to-earnings and price-to-book ratios, along with a high debt-to-assets ratio of 60.59%, indicate potential valuation and leverage concerns. The company does not pay dividends, likely reinvesting earnings to fuel growth.
ServiceTitan, Inc.
ServiceTitan shows several unfavorable profitability ratios, including a negative net margin of -30.98% and a return on equity of -16.44%, reflecting operational challenges. Its low debt-to-equity ratio of 0.11 and a positive quick ratio of 3.74 indicate conservative financial leverage and liquidity. Like AppLovin, ServiceTitan does not pay dividends, possibly prioritizing reinvestment in development and expansion.
Which one has the best ratios?
AppLovin has a slightly favorable overall ratio profile, supported by strong profitability metrics despite higher leverage and valuation concerns. ServiceTitan, by contrast, presents a slightly unfavorable ratio picture with negative profitability and mixed liquidity signals. Based on these financial metrics alone, AppLovin demonstrates stronger ratio performance than ServiceTitan.
Strategic Positioning
This section compares the strategic positioning of AppLovin Corporation and ServiceTitan, Inc., including Market position, Key segments, and disruption:
AppLovin Corporation
- Large market cap of 193B USD; operates in competitive software application sector with high beta volatility.
- Focus on mobile app marketing and monetization; key segments include Advertising (3.2B USD) and Apps (1.5B USD).
- Exposure to technological disruption via real-time bidding and analytics platforms enhancing app monetization efficiency.
ServiceTitan, Inc.
- Smaller market cap of 8.5B USD; serves field service software market with negative beta, indicating defensive traits.
- Concentrated on platform (740M USD) and subscription (566M USD) revenues for field service infrastructure software.
- Limited explicit exposure to technological disruption detailed; core focus on service infrastructure software.
AppLovin Corporation vs ServiceTitan, Inc. Positioning
AppLovin pursues a diversified strategy in mobile app marketing and monetization with large-scale advertising and software segments, while ServiceTitan concentrates on field service software with platform and subscription revenues. AppLovin’s broader segment scope contrasts with ServiceTitan’s niche focus.
Which has the best competitive advantage?
AppLovin shows a very favorable MOAT with value creation and growing ROIC, indicating sustained competitive advantage. ServiceTitan’s unfavorable MOAT reflects value destruction and neutral ROIC trend, suggesting weaker competitive positioning.
Stock Comparison
The stock price movements of AppLovin Corporation and ServiceTitan, Inc. over the past 12 months reveal contrasting trends, with AppLovin demonstrating a strong bullish momentum despite recent deceleration, while ServiceTitan exhibits a steady bearish trajectory with accelerating decline.
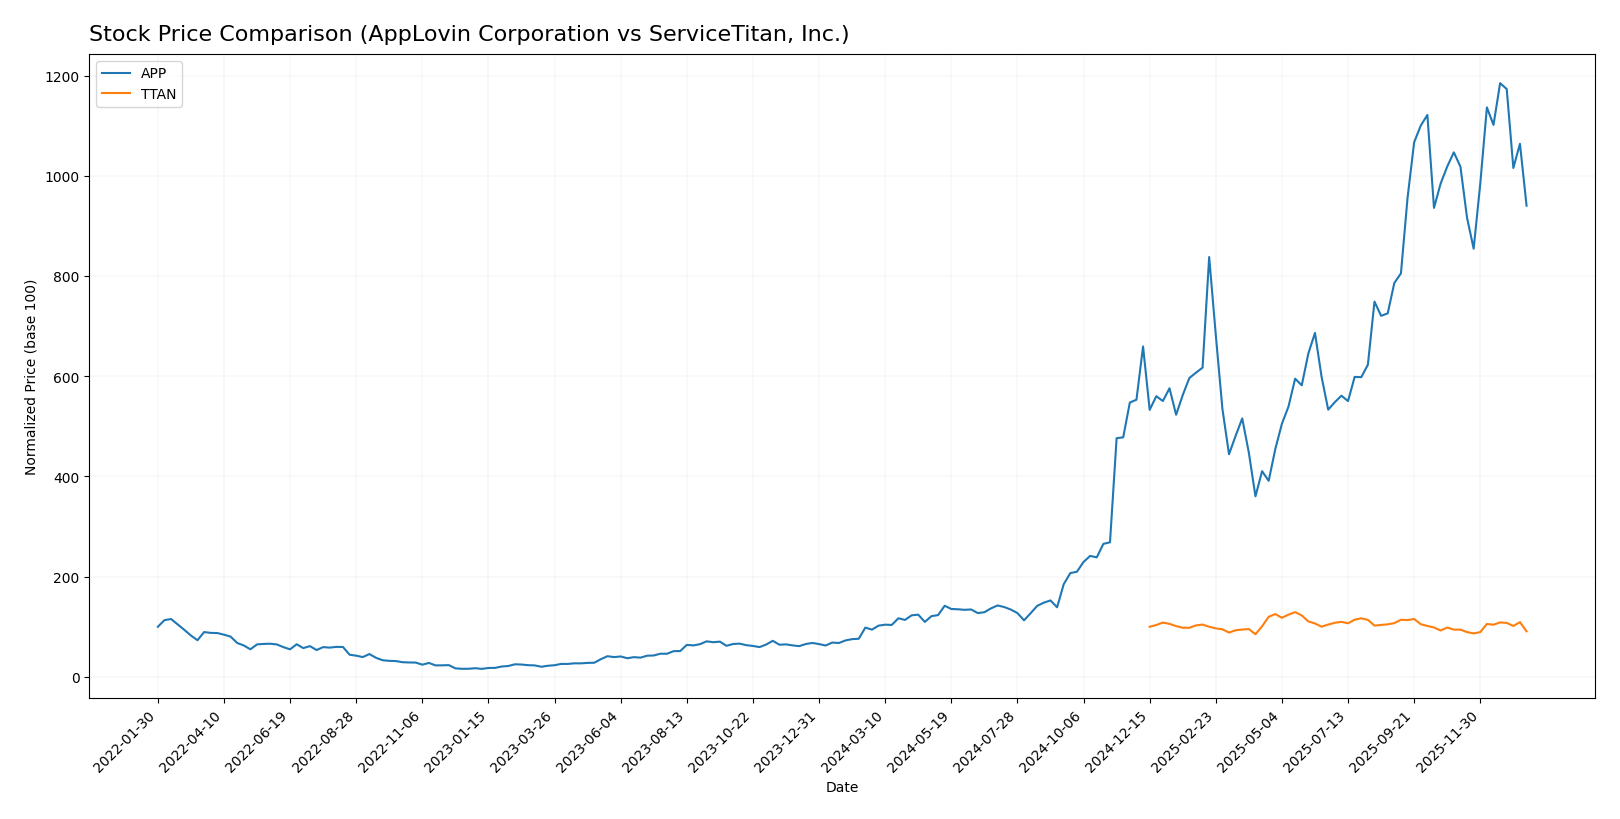
Trend Analysis
AppLovin Corporation’s stock surged by 897.53% over the past year, indicating a clear bullish trend with decelerating momentum. The price ranged from a low of 57.39 to a high of 721.37, reflecting significant volatility (std deviation 201.11).
ServiceTitan, Inc. experienced a 9.06% decline over the same period, confirming a bearish trend with accelerating downward pressure. Prices fluctuated narrowly between 85.07 and 129.26, with lower volatility (std deviation 9.86).
Comparing both, AppLovin’s stock delivered substantially higher market performance than ServiceTitan, outperforming with a strong positive price change versus ServiceTitan’s moderate loss.
Target Prices
The current analyst consensus indicates attractive upside potential for both AppLovin Corporation and ServiceTitan, Inc.
| Company | Target High | Target Low | Consensus |
|---|---|---|---|
| AppLovin Corporation | 860 | 630 | 756.33 |
| ServiceTitan, Inc. | 145 | 117 | 132.44 |
Analysts expect AppLovin’s shares to rise significantly above the current price of 571 USD, while ServiceTitan’s target consensus of 132.44 USD also suggests notable upside from its current price near 91 USD.
Analyst Opinions Comparison
This section compares analysts’ ratings and grades for AppLovin Corporation and ServiceTitan, Inc.:
Rating Comparison
AppLovin Corporation (APP) Rating
- Rating: B, assessed as Very Favorable overall.
- Discounted Cash Flow Score: 3, indicating a Moderate valuation outlook.
- ROE Score: 5, reflecting Very Favorable profit generation efficiency.
- ROA Score: 5, showing Very Favorable asset utilization.
- Debt To Equity Score: 1, signaling Very Unfavorable financial leverage.
- Overall Score: 3, a Moderate overall financial standing.
ServiceTitan, Inc. (TTAN) Rating
- Rating: C-, assessed as Very Unfavorable overall.
- Discounted Cash Flow Score: 1, indicating a Very Unfavorable valuation.
- ROE Score: 1, reflecting Very Unfavorable profit generation efficiency.
- ROA Score: 1, showing Very Unfavorable asset utilization.
- Debt To Equity Score: 3, signaling Moderate financial leverage risk.
- Overall Score: 1, a Very Unfavorable overall financial standing.
Which one is the best rated?
Based strictly on the provided data, AppLovin Corporation (APP) holds a better rating with a “B” grade and stronger scores in profitability and asset use, despite weaker debt metrics. ServiceTitan (TTAN) trails with a “C-” and generally unfavorable scores except moderate debt risk.
Scores Comparison
Here is a comparison of the financial scores for AppLovin Corporation and ServiceTitan, Inc.:
APP Scores
- Altman Z-Score: 30.7, indicating a safe financial zone with very low bankruptcy risk.
- Piotroski Score: 7, classified as strong financial health.
TTAN Scores
- Altman Z-Score: 15.7, also in the safe zone, reflecting low bankruptcy risk.
- Piotroski Score: 6, considered average financial strength.
Which company has the best scores?
AppLovin shows a higher Altman Z-Score and a stronger Piotroski Score than ServiceTitan. Both are in the safe zone for bankruptcy risk, but AppLovin’s financial health metrics are comparatively stronger based on the provided data.
Grades Comparison
Here is the grades comparison for AppLovin Corporation and ServiceTitan, Inc.:
AppLovin Corporation Grades
The following table shows recent grades from reputable financial institutions for AppLovin Corporation.
| Grading Company | Action | New Grade | Date |
|---|---|---|---|
| Morgan Stanley | Maintain | Overweight | 2026-01-13 |
| Wells Fargo | Maintain | Overweight | 2026-01-08 |
| Jefferies | Maintain | Buy | 2025-12-11 |
| Benchmark | Maintain | Buy | 2025-12-11 |
| Citigroup | Maintain | Buy | 2025-11-12 |
| Wells Fargo | Maintain | Overweight | 2025-11-07 |
| Goldman Sachs | Maintain | Neutral | 2025-11-07 |
| JP Morgan | Maintain | Neutral | 2025-11-06 |
| Wedbush | Maintain | Outperform | 2025-11-06 |
| Piper Sandler | Maintain | Overweight | 2025-11-06 |
AppLovin’s grades mostly range from Neutral to Buy/Overweight, reflecting consistent confidence with no downgrades recently.
ServiceTitan, Inc. Grades
The following table shows recent grades from reputable financial institutions for ServiceTitan, Inc.
| Grading Company | Action | New Grade | Date |
|---|---|---|---|
| Piper Sandler | Maintain | Overweight | 2025-12-05 |
| BMO Capital | Maintain | Outperform | 2025-12-05 |
| TD Cowen | Maintain | Buy | 2025-12-05 |
| Morgan Stanley | Maintain | Equal Weight | 2025-12-05 |
| BMO Capital | Maintain | Outperform | 2025-11-20 |
| Wells Fargo | Maintain | Overweight | 2025-09-19 |
| Stifel | Maintain | Buy | 2025-09-19 |
| Piper Sandler | Maintain | Overweight | 2025-09-19 |
| Canaccord Genuity | Maintain | Buy | 2025-09-19 |
| Citigroup | Maintain | Neutral | 2025-09-09 |
ServiceTitan’s grades mostly range from Neutral to Buy/Outperform, showing a stable outlook with no negative changes.
Which company has the best grades?
Both companies hold a consensus “Buy” rating, but AppLovin has a slightly higher number of buy ratings (22 vs. 12). ServiceTitan also has several Outperform and Overweight ratings, indicating strong analyst support. This balance suggests investors may find strong endorsement in both, with slightly more unanimous buy signals for AppLovin.
Strengths and Weaknesses
Below is a comparison table highlighting key strengths and weaknesses of AppLovin Corporation (APP) and ServiceTitan, Inc. (TTAN) based on the latest financial and operational data.
| Criterion | AppLovin Corporation (APP) | ServiceTitan, Inc. (TTAN) |
|---|---|---|
| Diversification | Strong diversification with significant revenue from Advertising ($3.22B) and Apps ($1.49B) segments, balancing growth areas. | Moderate diversification mainly from Platform ($739M) and Subscription ($566M) revenues, more concentrated business model. |
| Profitability | High profitability: net margin 33.55%, ROIC 38.7%, ROE 144.96%, consistently creating value (ROIC > WACC by 23.25%). | Negative profitability: net margin -30.98%, ROIC -14.11%, ROE -16.44%, shedding value (ROIC < WACC by -19%). |
| Innovation | Strong innovation reflected in growing ROIC trend (+1173%), high fixed asset turnover (23.71), and increasing software platform revenues. | Innovation less evident, neutral ROIC trend (+1.72%), moderate fixed asset turnover (9.57), with recent platform revenue focus. |
| Global presence | Established global presence supported by diverse product segments and broad advertising reach. | Primarily focused on North American markets with platform and subscription services. |
| Market Share | Significant market share in mobile advertising and app ecosystems, benefiting from strong competitive moat. | Smaller market share, niche position with unfavorable moat status and value destruction. |
Key takeaways: AppLovin demonstrates robust profitability, diversified revenue streams, and a durable competitive advantage, making it a compelling investment option. In contrast, ServiceTitan struggles with profitability and value creation, indicating higher risk and a need for caution.
Risk Analysis
Below is a comparative table summarizing key risks for AppLovin Corporation (APP) and ServiceTitan, Inc. (TTAN) based on the most recent financial data from 2025 and 2024.
| Metric | AppLovin Corporation (APP) | ServiceTitan, Inc. (TTAN) |
|---|---|---|
| Market Risk | High beta (2.50), volatile price range (200.5-745.61) indicating sensitivity to market swings | Negative beta (-0.85), suggesting some inverse correlation with market movements |
| Debt level | High debt/equity ratio (3.26), debt to assets 60.6% (unfavorable) | Low debt/equity ratio (0.11), debt to assets 9.35% (favorable) |
| Regulatory Risk | Moderate – operates in US tech sector with evolving data/privacy laws | Moderate – US-based service software, exposure to local regulations |
| Operational Risk | Moderate – relies on app marketing platform stability and tech innovation | Moderate – depends on field service software adoption and execution |
| Environmental Risk | Low – primarily software business with limited physical environmental impact | Low – software services with minimal direct environmental footprint |
| Geopolitical Risk | Moderate – international exposure in app markets | Low – mostly US-focused operations |
Synthesis: AppLovin’s most impactful risks are its high market volatility and significant leverage, which increase financial vulnerability despite strong profitability. ServiceTitan faces less financial risk with low debt but struggles with ongoing losses and operational efficiency. Market risk is higher for APP, while TTAN’s negative margins and weak returns pose operational concerns. Investors should weigh APP’s growth potential against leverage risks and TTAN’s path to profitability carefully.
Which Stock to Choose?
AppLovin Corporation (APP) shows a strongly favorable income evolution with 33.55% net margin and robust profitability ratios, including a 144.96% ROE. Despite a high debt ratio at 60.59% and some unfavorable valuation multiples, its credit rating remains very favorable, supported by a very favorable moat and strong financial scores.
ServiceTitan, Inc. (TTAN) reports a mixed income statement with a negative net margin of -30.98% and weak profitability ratios such as -16.44% ROE. The company maintains low debt levels and favorable WACC, but the overall ratings and moat evaluation are unfavorable, reflecting value destruction and financial challenges.
Investors prioritizing growth and high profitability might find APP’s strong income and durable competitive advantage appealing, while those focused on lower leverage or more conservative profiles may see TTAN’s low debt and stable, albeit unfavorable, financial position as more fitting. The choice could depend on the investor’s risk tolerance and strategic focus.
Disclaimer: Investment carries a risk of loss of initial capital. The past performance is not a reliable indicator of future results. Be sure to understand risks before making an investment decision.
Go Further
I encourage you to read the complete analyses of AppLovin Corporation and ServiceTitan, Inc. to enhance your investment decisions: