Home > Comparison > Technology > APP vs NOW
The strategic rivalry between AppLovin Corporation and ServiceNow, Inc. shapes the evolution of the technology sector’s software application industry. AppLovin operates a specialized platform focused on mobile app marketing and monetization, while ServiceNow delivers broad enterprise cloud workflow automation. This contrast highlights a battle between niche innovation and expansive enterprise integration. This analysis aims to identify which model offers a superior risk-adjusted return for a diversified portfolio in 2026.
Table of contents
Companies Overview
AppLovin and ServiceNow each command significant roles in the software application market, shaping digital experiences across diverse industries.
AppLovin Corporation: Mobile Marketing Innovator
AppLovin dominates the mobile app marketing space with its software-based platform that connects advertisers and publishers through real-time auctions. Its revenue primarily derives from AppDiscovery, Adjust analytics, and MAX bidding products. In 2026, AppLovin sharpens its focus on optimizing monetization for mobile developers globally, leveraging data-driven solutions to enhance ad performance and user engagement.
ServiceNow, Inc.: Enterprise Automation Leader
ServiceNow leads in enterprise cloud computing with a workflow automation platform that integrates AI, machine learning, and IT service management. Its revenue flows from diverse enterprise applications spanning IT, HR, security, and customer service. The company emphasizes expanding automation capabilities and strategic partnerships to deliver comprehensive digital transformation solutions across industries in 2026.
Strategic Collision: Similarities & Divergences
Both firms excel in software applications but diverge sharply in focus—AppLovin targets mobile app marketing, while ServiceNow centers on enterprise workflow automation. They compete indirectly in digital transformation but differ in scale and customer base. AppLovin’s high-beta growth profile contrasts with ServiceNow’s diversified, stable enterprise footprint, reflecting distinct risk-return dynamics for investors.
Income Statement Comparison
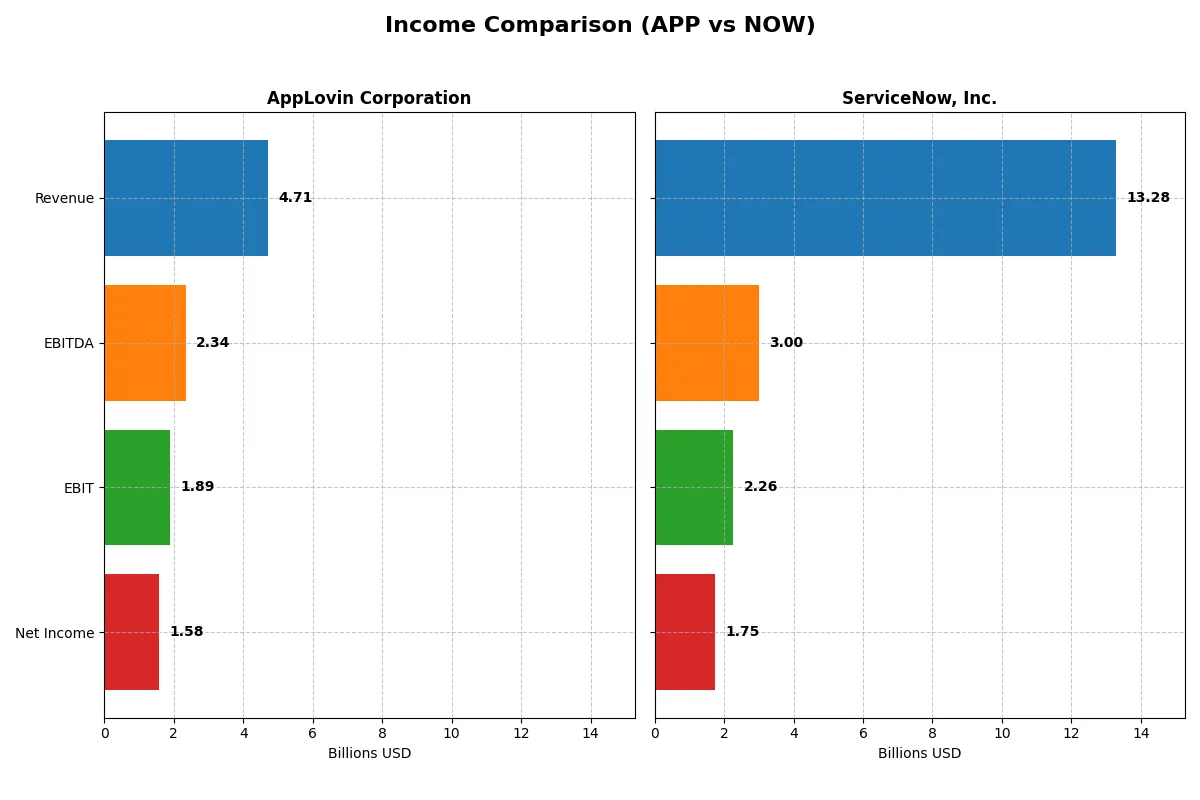
This table dissects the core profitability and scalability of AppLovin Corporation and ServiceNow, Inc. to reveal who dominates the bottom line:
| Metric | AppLovin Corporation (APP) | ServiceNow, Inc. (NOW) |
|---|---|---|
| Revenue | 4.71B | 13.28B |
| Cost of Revenue | 1.17B | 2.98B |
| Operating Expenses | 1.67B | 8.47B |
| Gross Profit | 3.54B | 10.30B |
| EBITDA | 2.34B | 3.00B |
| EBIT | 1.89B | 2.26B |
| Interest Expense | 318M | 0 |
| Net Income | 1.58B | 1.75B |
| EPS | 4.68 | 1.69 |
| Fiscal Year | 2024 | 2025 |
Income Statement Analysis: The Bottom-Line Duel
This income statement comparison reveals which company converts revenue into profit most efficiently, highlighting operational strength and margin discipline.
AppLovin Corporation Analysis
AppLovin’s revenue soared from $1.45B in 2020 to $4.71B in 2024, with net income swinging from a $125M loss to $1.58B profit. Its gross margin stands at a robust 75%, and net margin peaked at 33.5%. The 2024 results demonstrate accelerating profitability and margin expansion, signaling strong operational leverage.
ServiceNow, Inc. Analysis
ServiceNow grew revenue from $5.9B in 2021 to $13.3B in 2025, with net income rising steadily from $230M to $1.75B. It maintains a healthy gross margin of 77.5%, but net margin is more modest at 13.2%. The 2025 figures show solid top-line growth paired with consistent margin improvement, reflecting scale and efficiency gains.
Margin Power vs. Revenue Scale
AppLovin leads in net margin efficiency, delivering a higher profit share despite a smaller revenue base than ServiceNow. ServiceNow impresses with larger scale and steady growth, but its lower net margin indicates heavier cost absorption. For investors, AppLovin’s sharper margin profile may appeal to those valuing profitability, while ServiceNow suits those prioritizing scale and steady expansion.
Financial Ratios Comparison
These vital ratios act as a diagnostic tool to expose the underlying fiscal health, valuation premiums, and capital efficiency of these companies:
| Ratios | AppLovin Corporation (APP) | ServiceNow, Inc. (NOW) |
|---|---|---|
| ROE | 1.45 | 0.13 |
| ROIC | 0.39 | 0.09 |
| P/E | 69.06 | 90.88 |
| P/B | 100.11 | 12.25 |
| Current Ratio | 2.19 | 0.95 |
| Quick Ratio | 2.19 | 0.95 |
| D/E | 3.26 | 0.25 |
| Debt-to-Assets | 0.61 | 0.12 |
| Interest Coverage | 5.89 | 0 |
| Asset Turnover | 0.80 | 0.51 |
| Fixed Asset Turnover | 23.71 | 4.29 |
| Payout ratio | 0 | 0 |
| Dividend yield | 0 | 0 |
| Fiscal Year | 2024 | 2025 |
Efficiency & Valuation Duel: The Vital Signs
Financial ratios serve as a company’s DNA, exposing hidden risks and operational strengths critical for investment decisions.
AppLovin Corporation
AppLovin exhibits exceptional profitability with a 145% ROE and strong 33.55% net margin, signaling operational excellence. However, its valuation appears stretched, with a high P/E of 69 and a P/B of 100, reflecting premium pricing. The firm does not pay dividends but aggressively reinvests in R&D, fueling growth and innovation.
ServiceNow, Inc.
ServiceNow presents moderate profitability with a 13.5% ROE and 13.16% net margin, indicating steady but less robust returns. Its valuation is expensive, marked by a P/E near 91 and P/B of 12. The company maintains a conservative balance sheet with low debt and supports shareholders mainly through operational cash flow rather than dividends or buybacks.
Premium Valuation vs. Operational Safety
AppLovin’s ratios highlight superior profitability but come with stretched valuation and leverage risks. ServiceNow offers a more balanced risk profile with moderate returns and lower leverage but trades at a high premium. Investors seeking growth may lean toward AppLovin’s aggressive posture, while those prioritizing financial prudence might prefer ServiceNow’s steadiness.
Which one offers the Superior Shareholder Reward?
AppLovin Corporation (APP) and ServiceNow, Inc. (NOW) both forgo dividends, opting instead to reinvest cash flow for growth. APP boasts a robust free cash flow per share of 6.2 versus NOW’s 4.4 in 2025, reflecting stronger cash generation. APP’s payout ratio is zero, preserving full FCF for reinvestment or buybacks. APP’s share repurchase activity is notably aggressive, enhancing shareholder value amid its high leverage (debt-to-equity at 3.26), raising some sustainability concerns. NOW maintains a more conservative capital structure (debt-to-equity 0.25) with modest buybacks, signaling balanced capital allocation. I find NOW’s model more sustainable given lower financial risk, despite APP’s higher cash flow and buyback intensity. For 2026, I favor NOW for its prudent leverage and stable reinvestment strategy, offering a steadier total return profile.
Comparative Score Analysis: The Strategic Profile
The radar chart reveals the fundamental DNA and trade-offs of AppLovin Corporation and ServiceNow, Inc., highlighting their distinct financial strengths and weaknesses:
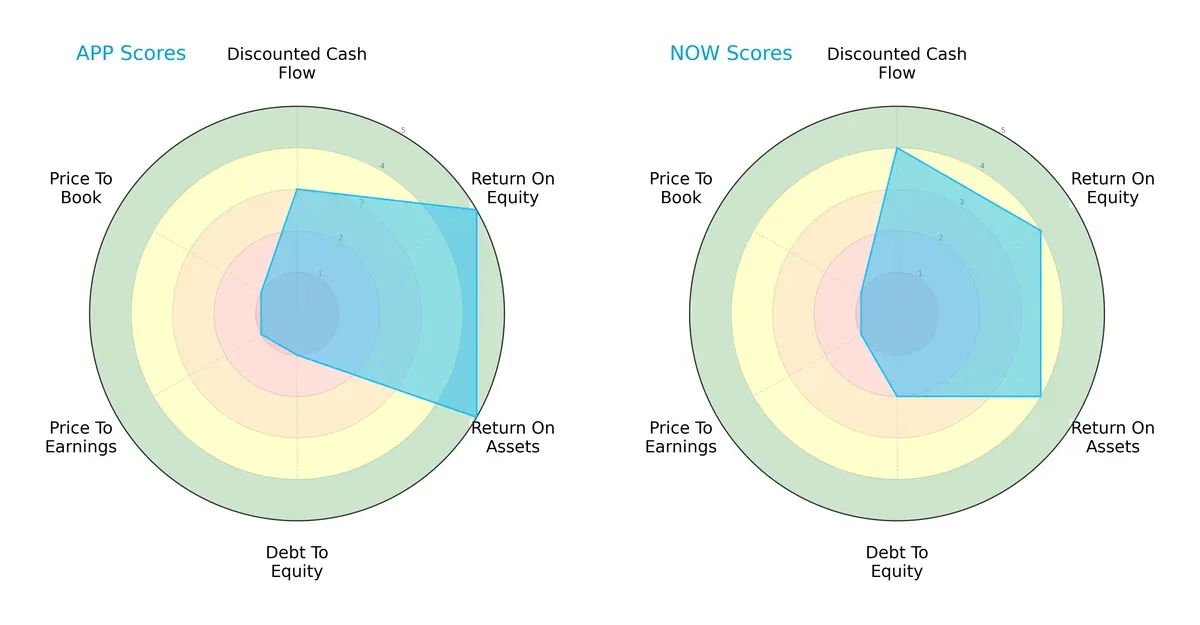
AppLovin excels in return on equity (5) and return on assets (5), showing operational efficiency. ServiceNow leads in discounted cash flow (4) and has a better debt-to-equity score (2), reflecting stronger financial stability. Both struggle with valuation metrics (P/E and P/B at 1). ServiceNow presents a more balanced profile, while AppLovin relies on superior profitability but carries higher financial risk.
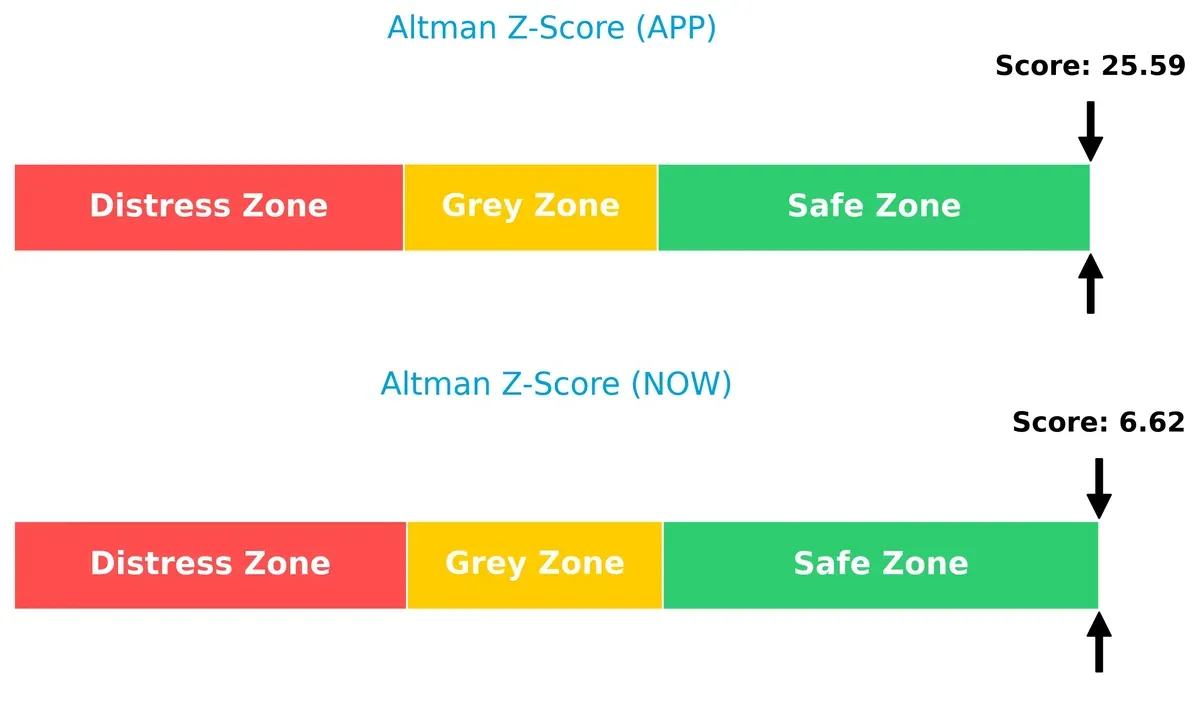
Bankruptcy Risk: Solvency Showdown
AppLovin’s Altman Z-Score of 25.6 versus ServiceNow’s 6.6 firmly places both companies in the safe zone, with AppLovin demonstrating extraordinary solvency and lower bankruptcy risk in this cycle:
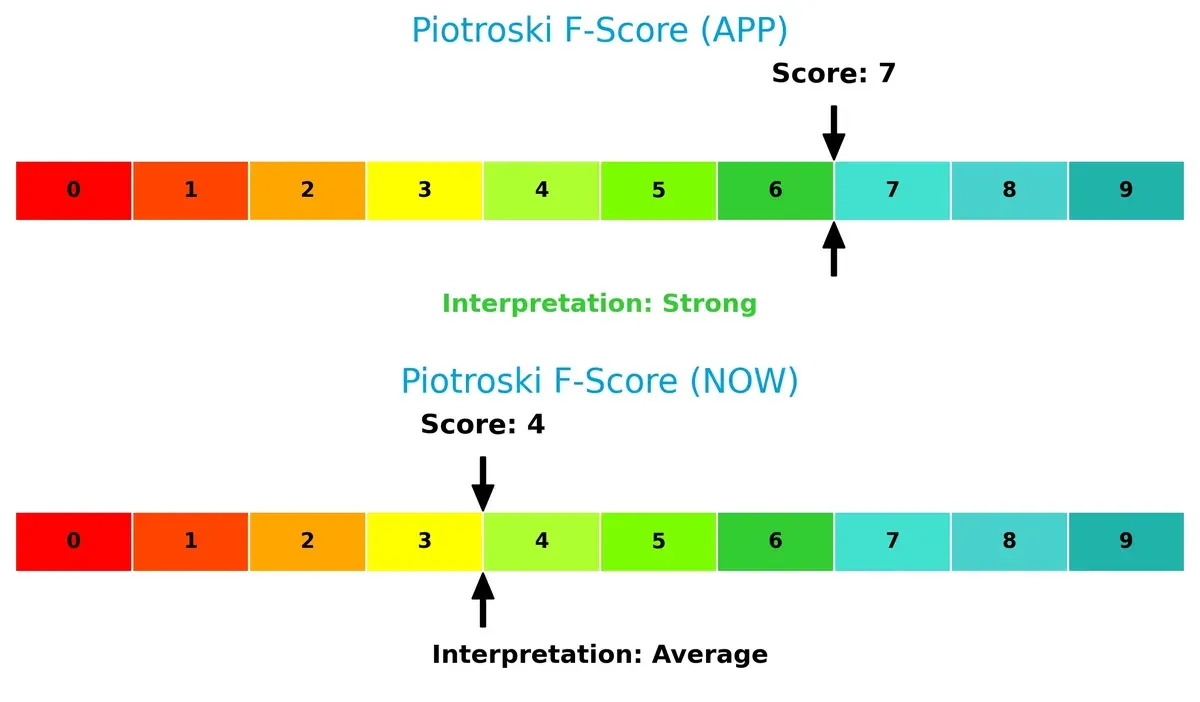
Financial Health: Quality of Operations
AppLovin’s Piotroski F-Score of 7 suggests strong financial health, outpacing ServiceNow’s average score of 4. This indicates AppLovin maintains better profitability, liquidity, and operational efficiency, whereas ServiceNow shows potential red flags in internal metrics:
How are the two companies positioned?
This section dissects the operational DNA of APP and NOW by comparing their revenue distribution and internal dynamics. The goal is to confront their economic moats to identify which model offers the most resilient, sustainable advantage today.
Revenue Segmentation: The Strategic Mix
This visual comparison dissects how AppLovin Corporation and ServiceNow, Inc. diversify their income streams and where their primary sector bets lie:
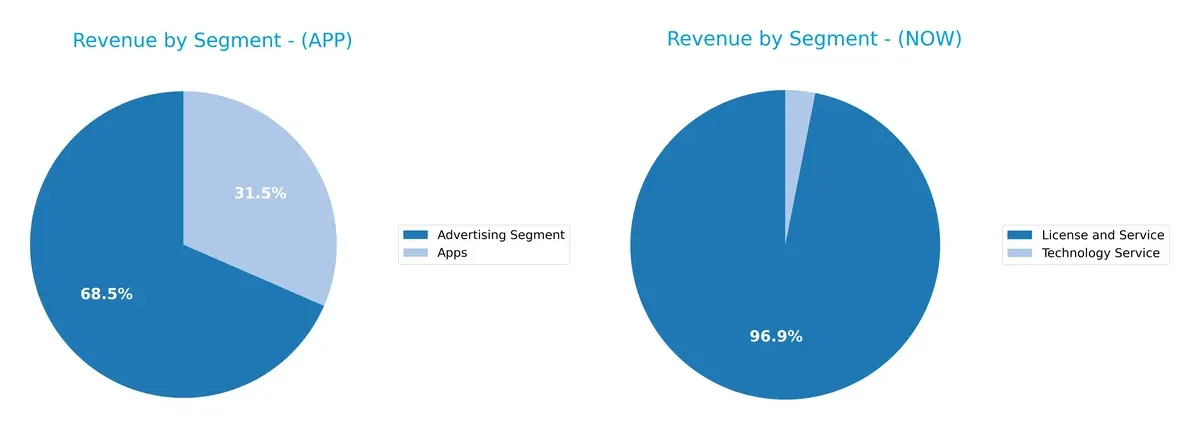
AppLovin anchors revenue in its Advertising segment at $3.2B in 2024, supplemented by $1.5B from Apps, showing moderate diversification. ServiceNow dwarfs AppLovin with $12.9B from License and Service segments combined in 2025, heavily concentrated but diversified internally between Digital Workflow and ITOM products. AppLovin’s reliance on advertising poses concentration risk, while ServiceNow’s ecosystem lock-in strategy drives infrastructure dominance.
Strengths and Weaknesses Comparison
This table compares the strengths and weaknesses of AppLovin and ServiceNow based on diversification, profitability, financial health, innovation, global reach, and market position:
AppLovin Strengths
- High net margin of 33.55%
- Exceptional ROE at 144.96%
- Strong ROIC at 38.7%
- Robust current and quick ratios of 2.19
- Significant global revenue split with $2B+ outside the US
- High fixed asset turnover of 23.71
ServiceNow Strengths
- Favorable net margin of 13.16%
- Low debt to equity at 0.25 and debt to assets at 12.3%
- Infinite interest coverage ratio indicating strong solvency
- Large global footprint with $8.3B North America revenue
- Consistent revenue growth in license and service segments
- Fixed asset turnover of 4.29 supporting operational efficiency
AppLovin Weaknesses
- High debt-to-assets at 60.59%
- Elevated debt to equity of 3.26
- Unfavorable WACC at 15.44% exceeding ROIC
- Very high P/E and P/B ratios (69.06 and 100.11)
- Zero dividend yield
- Asset turnover only neutral at 0.8
ServiceNow Weaknesses
- Current ratio below 1 at 0.95 signaling liquidity concerns
- Unfavorable high P/E of 90.88 and P/B of 12.25
- ROE and ROIC only neutral at 13.48% and 8.98%
- Dividend yield at zero
- Asset turnover moderate at 0.51
- WACC neutral, slightly lower than ROIC
AppLovin demonstrates outstanding profitability and liquidity but carries high leverage and valuation risks. ServiceNow shows strong solvency and global sales scale but faces liquidity and valuation pressures. Each company’s profile suggests distinct strategic priorities for managing risk and growth.
The Moat Duel: Analyzing Competitive Defensibility
A structural moat is the only true defense against profit erosion from competition over the long term. Here’s how AppLovin and ServiceNow stack up:
AppLovin Corporation: Data-Driven Network Effects
AppLovin’s moat stems from powerful network effects linking advertisers and app developers. Its 23%+ ROIC far exceeds WACC, showing durable value creation. Expansion into global ad markets in 2026 should deepen this advantage.
ServiceNow, Inc.: Workflow Ecosystem Lock-in
ServiceNow’s moat lies in its enterprise workflow platform, fostering high switching costs. Though ROIC slightly trails WACC, rising profitability signals emerging strength. Continued AI integration and global sales growth offer upside in 2026.
Verdict: Network Effects vs. Workflow Ecosystem Lock-in
AppLovin boasts a wider moat with robust economic profits and accelerating returns. ServiceNow’s moat is narrower but improving. AppLovin is better positioned to defend and expand market share amid intensifying competition.
Which stock offers better returns?
Over the past 12 months, AppLovin Corporation’s stock soared sharply before losing momentum recently, while ServiceNow, Inc. experienced a steady decline with increased selling pressure.
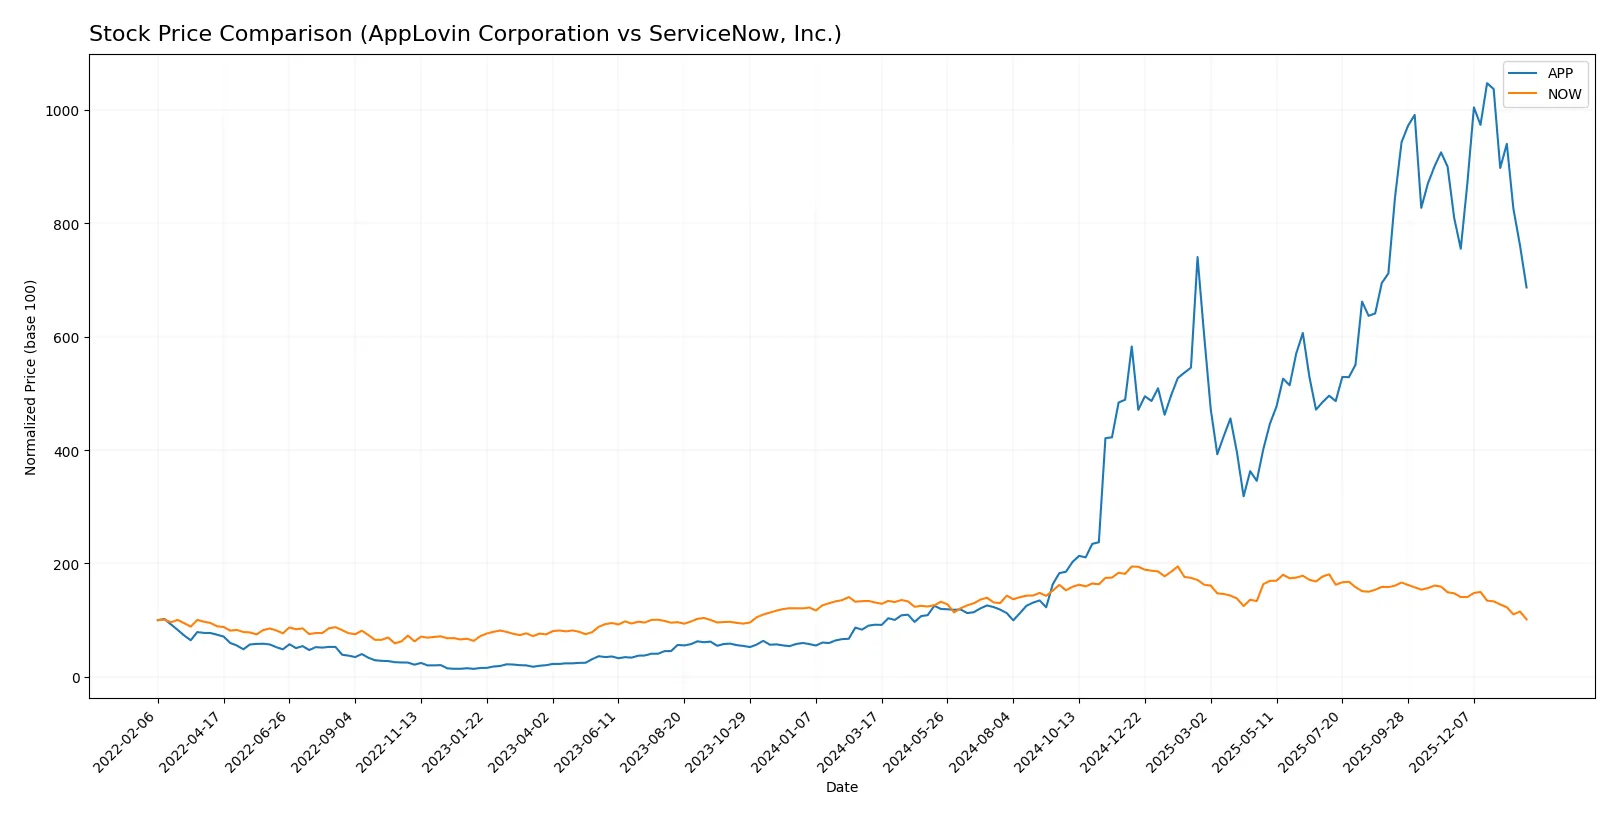
Trend Comparison
AppLovin’s stock gained 646% over the past year, showing a bullish trend with decelerating momentum, peaking at 721.37 and bottoming at 63.13. Recent months saw a 15.17% drop.
ServiceNow’s stock fell 22.79% over the last year, reflecting a bearish trend with deceleration, hitting a high of 225.0 and a low of 117.01. The recent period shows a sharper 31.21% decline.
AppLovin outperformed ServiceNow substantially, delivering the highest market returns despite recent volatility and deceleration in price gains.
Target Prices
Analysts present a wide target price range for AppLovin Corporation and ServiceNow, Inc., reflecting diverse expectations.
| Company | Target Low | Target High | Consensus |
|---|---|---|---|
| AppLovin Corporation | 630 | 860 | 752 |
| ServiceNow, Inc. | 115 | 1315 | 440.14 |
AppLovin’s consensus target sits well above its current price of 473, implying potential upside. ServiceNow’s broad target range indicates high uncertainty, with consensus nearly four times the current price of 117.

Don’t Let Luck Decide Your Entry Point
Optimize your entry points with our advanced ProRealTime indicators. You’ll get efficient buy signals with precise price targets for maximum performance. Start outperforming now!
How do institutions grade them?
AppLovin Corporation Grades
The following table summarizes recent institutional grades for AppLovin Corporation:
| Grading Company | Action | New Grade | Date |
|---|---|---|---|
| Needham | Buy | Buy | 2026-01-26 |
| Morgan Stanley | Maintain | Overweight | 2026-01-13 |
| Wells Fargo | Maintain | Overweight | 2026-01-08 |
| Benchmark | Maintain | Buy | 2025-12-11 |
| Jefferies | Maintain | Buy | 2025-12-11 |
| Citigroup | Maintain | Buy | 2025-11-12 |
| Goldman Sachs | Maintain | Neutral | 2025-11-07 |
| Wells Fargo | Maintain | Overweight | 2025-11-07 |
| Piper Sandler | Maintain | Overweight | 2025-11-06 |
| UBS | Maintain | Buy | 2025-11-06 |
ServiceNow, Inc. Grades
Below is a summary of recent institutional grades for ServiceNow, Inc.:
| Grading Company | Action | New Grade | Date |
|---|---|---|---|
| Citigroup | Maintain | Buy | 2026-01-30 |
| Cantor Fitzgerald | Maintain | Overweight | 2026-01-29 |
| Needham | Maintain | Buy | 2026-01-29 |
| Evercore ISI Group | Maintain | Outperform | 2026-01-29 |
| DA Davidson | Maintain | Buy | 2026-01-29 |
| Macquarie | Maintain | Neutral | 2026-01-29 |
| Keybanc | Maintain | Underweight | 2026-01-29 |
| Stifel | Maintain | Buy | 2026-01-29 |
| BTIG | Maintain | Buy | 2026-01-29 |
| RBC Capital | Maintain | Outperform | 2026-01-29 |
Which company has the best grades?
ServiceNow, Inc. receives consistently strong grades including multiple “Buy” and “Outperform” ratings. AppLovin Corporation also holds solid “Buy” and “Overweight” grades but includes a “Neutral” rating. Investors might view ServiceNow’s broader consensus of positive ratings as indicating stronger institutional confidence.
Risks specific to each company
The following categories identify the critical pressure points and systemic threats facing both firms in the 2026 market environment:
1. Market & Competition
AppLovin Corporation
- Faces intense competition in mobile app marketing and monetization platforms, with rapid innovation cycles.
ServiceNow, Inc.
- Operates in enterprise cloud software with strong incumbents, facing pressure to innovate in automation and AI workflows.
2. Capital Structure & Debt
AppLovin Corporation
- High debt-to-equity ratio (3.26) signals leverage risk and potential strain on cash flows.
ServiceNow, Inc.
- Low debt-to-equity ratio (0.25) indicates conservative capital structure and financial flexibility.
3. Stock Volatility
AppLovin Corporation
- Beta of 2.5 signals high stock price volatility, increasing risk for risk-averse investors.
ServiceNow, Inc.
- Beta near 1 (0.98) shows stock volatility close to market average, implying more stability.
4. Regulatory & Legal
AppLovin Corporation
- Subject to data privacy regulations impacting user data monetization strategies globally.
ServiceNow, Inc.
- Faces compliance demands in governance and risk management products, with scrutiny from enterprise clients.
5. Supply Chain & Operations
AppLovin Corporation
- Relies heavily on technology infrastructure and third-party integrations, vulnerable to service disruptions.
ServiceNow, Inc.
- Complex cloud infrastructure and partner ecosystem requires robust operational resilience.
6. ESG & Climate Transition
AppLovin Corporation
- Limited public data on ESG efforts may raise concerns among sustainability-focused investors.
ServiceNow, Inc.
- Increasing focus on ESG compliance and sustainable IT solutions aligns with market trends.
7. Geopolitical Exposure
AppLovin Corporation
- Global mobile app market exposure subjects it to regulatory shifts and trade tensions.
ServiceNow, Inc.
- Broad multinational customer base exposes it to geopolitical risks but diversified revenue mitigates impact.
Which company shows a better risk-adjusted profile?
AppLovin’s highest risk lies in its elevated leverage and stock volatility, which could pressure financial stability amid market cycles. ServiceNow’s primary concern is its stretched valuation, reflected in high P/E and P/B ratios, risking downside if growth slows. However, ServiceNow’s conservative debt levels and stable beta offer a more balanced risk profile. Notably, AppLovin’s debt-to-equity ratio of 3.26 flags significant financial risk, whereas ServiceNow’s 0.25 ratio signals prudence. Overall, ServiceNow exhibits a superior risk-adjusted profile due to lower leverage and volatility, despite valuation concerns.
Final Verdict: Which stock to choose?
AppLovin Corporation’s superpower lies in its exceptional capital efficiency and explosive profitability growth. Its ability to generate returns well above its cost of capital signals a durable competitive advantage. However, its high leverage remains a point of vigilance, requiring careful risk management. It suits investors targeting aggressive growth profiles.
ServiceNow, Inc. boasts a strategic moat rooted in its cloud dominance and strong recurring revenue stream. It presents a safer balance sheet with moderate leverage, offering relative stability compared to AppLovin. This profile fits investors who prefer Growth at a Reasonable Price (GARP) strategies seeking steadier cash flow growth.
If you prioritize rapid value creation and superior returns on invested capital, AppLovin outshines with its robust profitability and growth momentum. However, if you seek better financial stability and consistent revenue visibility, ServiceNow offers a more balanced risk-reward profile. Each appeals to distinct investor avatars with differing tolerance for risk and growth horizons.
Disclaimer: Investment carries a risk of loss of initial capital. The past performance is not a reliable indicator of future results. Be sure to understand risks before making an investment decision.
Go Further
I encourage you to read the complete analyses of AppLovin Corporation and ServiceNow, Inc. to enhance your investment decisions: