In the fast-evolving semiconductor industry, Applied Materials, Inc. (AMAT) and QUALCOMM Incorporated (QCOM) stand out as leaders driving innovation and shaping technology’s future. Both companies play pivotal roles—AMAT in manufacturing equipment for chip production, and QCOM in wireless technology and semiconductor design—creating significant market overlap and strategic competition. This article will explore their strengths and risks to help you decide which is the more compelling investment opportunity today.
Table of contents
Companies Overview
I will begin the comparison between Applied Materials, Inc. and QUALCOMM Incorporated by providing an overview of these two companies and their main differences.
Applied Materials Overview
Applied Materials, Inc. operates in the semiconductor industry, providing manufacturing equipment, services, and software to semiconductor, display, and related markets. The company’s segments include Semiconductor Systems, Applied Global Services, and Display and Adjacent Markets. It focuses on advancing chip fabrication technologies and display manufacturing, serving a global customer base from its headquarters in Santa Clara, California.
QUALCOMM Overview
QUALCOMM Incorporated specializes in developing and commercializing foundational wireless technologies globally. Its business segments are Qualcomm CDMA Technologies, Technology Licensing, and Strategic Initiatives, covering integrated circuits, patent licensing, and investments in emerging industries like 5G and AI. Headquartered in San Diego, California, QUALCOMM supports wireless voice, data communications, and related services worldwide.
Key similarities and differences
Both Applied Materials and QUALCOMM are major players in the semiconductor sector, but their business models differ: Applied Materials focuses on manufacturing equipment and services for chip and display production, while QUALCOMM centers on wireless technology development, patent licensing, and strategic investments. Both companies operate globally and invest heavily in technological innovation, yet their end markets and revenue sources reflect distinct industry roles.
Income Statement Comparison
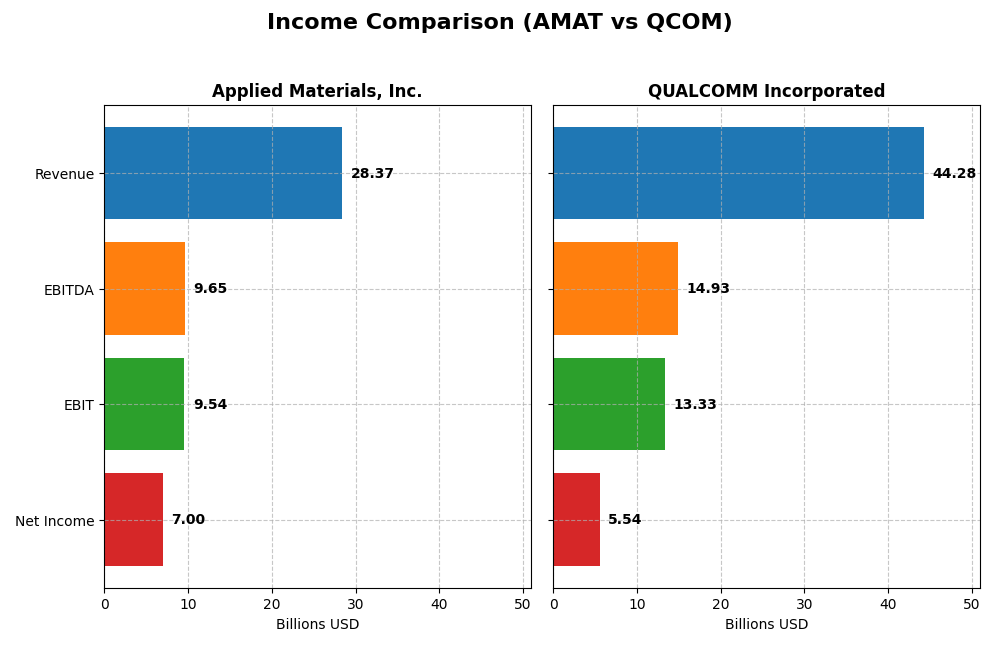
The table below compares key income statement metrics for Applied Materials, Inc. and QUALCOMM Incorporated for their most recent fiscal year.
| Metric | Applied Materials, Inc. (AMAT) | QUALCOMM Incorporated (QCOM) |
|---|---|---|
| Market Cap | 240.5B | 176.2B |
| Revenue | 28.37B | 44.28B |
| EBITDA | 9.65B | 14.93B |
| EBIT | 9.54B | 13.33B |
| Net Income | 7.00B | 5.54B |
| EPS | 8.71 | 5.06 |
| Fiscal Year | 2025 | 2025 |
Income Statement Interpretations
Applied Materials, Inc.
Applied Materials showed a steady revenue increase from $23.1B in 2021 to $28.4B in 2025, with net income rising from $5.9B to $7.0B over the same period. Margins remained robust, with a gross margin near 49% and a net margin around 25% in 2025. The latest year saw moderate revenue growth of 4.4%, a 7.1% gross profit increase, but a slight net margin decline, signaling mixed operational efficiency.
QUALCOMM Incorporated
QUALCOMM’s revenue advanced from $33.6B in 2021 to $44.3B in 2025, yet net income dropped significantly from $9.0B to $5.5B. Despite a high gross margin of 55.4%, net margin halved to 12.5% in 2025. The recent year featured a strong 13.7% revenue growth and 20.8% EBIT growth, but net margin and EPS fell sharply, indicating pressure on profitability despite top-line gains.
Which one has the stronger fundamentals?
Both companies exhibit favorable gross and EBIT margins, but Applied Materials maintains higher and more stable net margins with consistent net income growth. QUALCOMM’s stronger revenue growth contrasts with declining net income and margins, reflecting challenges in cost control or tax impact. Overall, Applied Materials shows a more balanced and resilient income statement profile.
Financial Ratios Comparison
The table below presents a side-by-side comparison of key financial ratios for Applied Materials, Inc. (AMAT) and QUALCOMM Incorporated (QCOM) based on their most recent fiscal year data.
| Ratios | Applied Materials, Inc. (AMAT) | QUALCOMM Incorporated (QCOM) |
|---|---|---|
| ROE | 34.3% | 26.1% |
| ROIC | 21.9% | 13.2% |
| P/E | 26.6 | 32.7 |
| P/B | 9.11 | 8.54 |
| Current Ratio | 2.61 | 2.82 |
| Quick Ratio | 1.87 | 2.10 |
| D/E (Debt to Equity) | 0.35 | 0.70 |
| Debt-to-Assets | 19.4% | 29.5% |
| Interest Coverage | 30.8 | 18.6 |
| Asset Turnover | 0.78 | 0.88 |
| Fixed Asset Turnover | 5.54 | 9.44 |
| Payout Ratio | 19.8% | 68.7% |
| Dividend Yield | 0.74% | 2.10% |
Interpretation of the Ratios
Applied Materials, Inc.
Applied Materials shows strong profitability with a 24.67% net margin, 34.28% ROE, and 21.96% ROIC, supported by a robust current ratio of 2.61 and low debt levels. However, valuation metrics such as a 26.58 P/E and 9.11 P/B are less favorable. The company pays dividends, but with a low 0.74% yield, indicating cautious distributions.
QUALCOMM Incorporated
QUALCOMM demonstrates solid profitability with a 12.51% net margin and 26.13% ROE, alongside a healthy current ratio of 2.82. Its debt-to-equity is moderate at 0.7. Valuation ratios like a 32.7 P/E and 8.54 P/B are less attractive. The dividend yield is higher at 2.1%, reflecting a more substantial shareholder return profile.
Which one has the best ratios?
Both companies have a favorable overall ratio profile with 64.29% favorable metrics. Applied Materials excels in profitability and leverage, while QUALCOMM offers stronger liquidity and a higher dividend yield. QUALCOMM has fewer unfavorable ratios but slightly more neutral ones, making the comparison balanced with distinct strengths and weaknesses.
Strategic Positioning
This section compares the strategic positioning of Applied Materials, Inc. and QUALCOMM Incorporated, including market position, key segments, and exposure to technological disruption:
Applied Materials, Inc.
- Leading semiconductor equipment provider facing competitive pressure in manufacturing technology.
- Diverse segments: Semiconductor Systems, Applied Global Services, Display and Adjacent Markets.
- Exposure through advanced manufacturing technologies and factory automation software in semiconductors.
QUALCOMM Incorporated
- Major wireless industry technology developer with strong patent licensing competition.
- Focused segments: Qualcomm CDMA Technologies, Technology Licensing, and Strategic Initiatives.
- Exposure via foundational wireless technologies, 5G, AI, automotive, and IoT investments.
Applied Materials, Inc. vs QUALCOMM Incorporated Positioning
Applied Materials shows a diversified business model across semiconductor equipment and services, while QUALCOMM concentrates on wireless technology and licensing. Applied Materials benefits from broad manufacturing technology, QUALCOMM from intellectual property and emerging tech investments.
Which has the best competitive advantage?
Both companies create value with ROIC above WACC but experience declining profitability. Applied Materials has a higher ROIC gap, indicating a slightly stronger moat despite similar “Slightly Favorable” ratings.
Stock Comparison
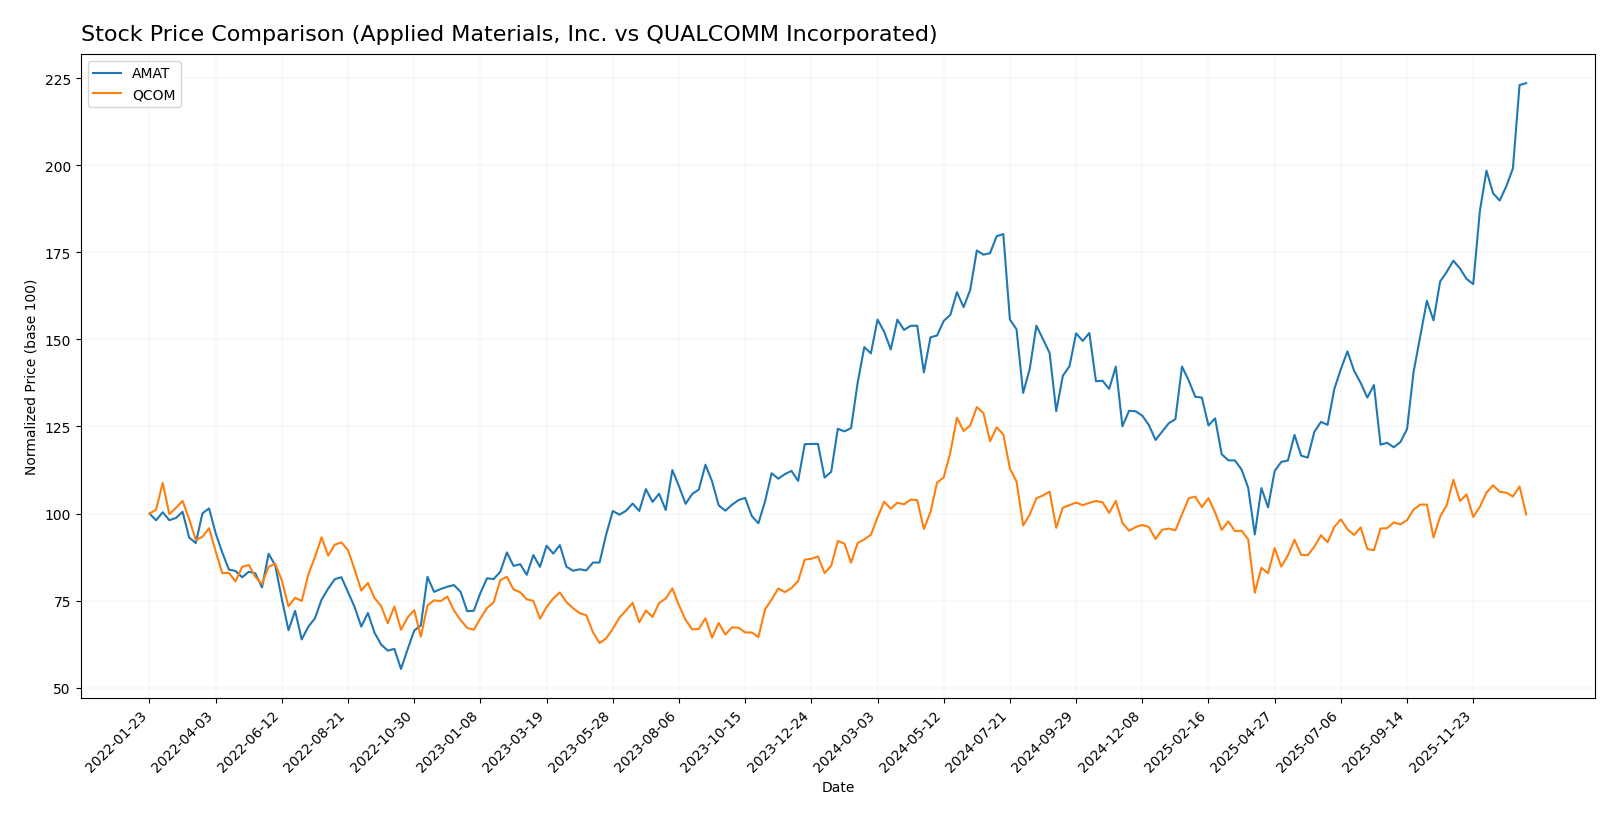
The stock price movements of Applied Materials, Inc. (AMAT) and QUALCOMM Incorporated (QCOM) over the past 12 months reveal distinct bullish trajectories with varying degrees of acceleration and volatility.
Trend Analysis
Applied Materials, Inc. (AMAT) exhibited a strong bullish trend with a 53.12% price increase over the past year, accompanied by accelerating momentum and high volatility, peaking at $301.89 and bottoming at $126.95.
QUALCOMM Incorporated (QCOM) also showed a bullish trend with a 6.22% increase over the same period, marked by acceleration but with lower volatility; however, its recent trend indicates a slight downturn of -9.04%.
Comparatively, Applied Materials delivered the highest market performance with a significantly greater overall price appreciation and stronger recent momentum than QUALCOMM.
Target Prices
The current analyst consensus suggests moderate upside potential for both Applied Materials, Inc. and QUALCOMM Incorporated.
| Company | Target High | Target Low | Consensus |
|---|---|---|---|
| Applied Materials, Inc. | 400 | 273 | 323.43 |
| QUALCOMM Incorporated | 210 | 165 | 185.71 |
Analysts expect Applied Materials to trade above its current price of 301.89 USD, with a consensus target of 323.43 USD. QUALCOMM’s consensus target of 185.71 USD also indicates a potential rise from its current 164.54 USD.
Analyst Opinions Comparison
This section compares analysts’ ratings and grades for Applied Materials, Inc. (AMAT) and QUALCOMM Incorporated (QCOM):
Rating Comparison
AMAT Rating
- Rating: B+, considered very favorable by analysts.
- Discounted Cash Flow Score: Moderate with a score of 3.
- ROE Score: Very favorable, highest score of 5 indicating strong profitability.
- ROA Score: Very favorable, highest score of 5 showing efficient asset use.
- Debt To Equity Score: Moderate risk with a score of 2.
- Overall Score: Moderate overall financial standing with a score of 3.
QCOM Rating
- Rating: B+, considered very favorable by analysts.
- Discounted Cash Flow Score: Favorable with a score of 4.
- ROE Score: Very favorable, highest score of 5 indicating strong profitability.
- ROA Score: Very favorable, highest score of 5 showing efficient asset use.
- Debt To Equity Score: Very unfavorable with a low score of 1 indicating higher financial risk.
- Overall Score: Moderate overall financial standing with a score of 3.
Which one is the best rated?
Both AMAT and QCOM share an identical overall rating of B+ and an overall score of 3, reflecting moderate financial standings. QCOM has a higher discounted cash flow score but a weaker debt-to-equity score compared to AMAT.
Scores Comparison
The following table compares the Altman Z-Score and Piotroski Score of Applied Materials, Inc. and QUALCOMM Incorporated:
AMAT Scores
- Altman Z-Score: 13.45, indicating a safe zone status.
- Piotroski Score: 7, reflecting strong financial health.
QCOM Scores
- Altman Z-Score: 6.37, indicating a safe zone status.
- Piotroski Score: 7, reflecting strong financial health.
Which company has the best scores?
Both AMAT and QCOM are in the safe zone for the Altman Z-Score and have a strong Piotroski Score of 7. AMAT’s Altman Z-Score is notably higher, indicating comparatively lower bankruptcy risk.
Grades Comparison
Here is the comparison of recent grades and ratings assigned to Applied Materials, Inc. and QUALCOMM Incorporated:
Applied Materials, Inc. Grades
The following table summarizes the recent grades from reliable grading companies for Applied Materials, Inc.:
| Grading Company | Action | New Grade | Date |
|---|---|---|---|
| B of A Securities | Maintain | Buy | 2026-01-13 |
| Susquehanna | Upgrade | Positive | 2026-01-12 |
| Cantor Fitzgerald | Maintain | Overweight | 2026-01-08 |
| B. Riley Securities | Maintain | Buy | 2025-12-18 |
| Mizuho | Maintain | Neutral | 2025-12-17 |
| Wells Fargo | Maintain | Overweight | 2025-12-15 |
| Jefferies | Maintain | Buy | 2025-12-15 |
| Keybanc | Maintain | Overweight | 2025-12-02 |
| UBS | Upgrade | Buy | 2025-11-25 |
| B. Riley Securities | Maintain | Buy | 2025-11-14 |
Overall, Applied Materials, Inc. shows a strong and consistent pattern of buy and overweight ratings, with occasional positive upgrades.
QUALCOMM Incorporated Grades
The following table summarizes the recent grades from reliable grading companies for QUALCOMM Incorporated:
| Grading Company | Action | New Grade | Date |
|---|---|---|---|
| Mizuho | Downgrade | Neutral | 2026-01-09 |
| Rosenblatt | Maintain | Buy | 2025-11-06 |
| B of A Securities | Maintain | Buy | 2025-11-06 |
| Mizuho | Maintain | Outperform | 2025-11-06 |
| Wells Fargo | Maintain | Underweight | 2025-11-06 |
| Piper Sandler | Maintain | Overweight | 2025-11-06 |
| UBS | Maintain | Neutral | 2025-11-06 |
| JP Morgan | Maintain | Overweight | 2025-11-04 |
| Citigroup | Maintain | Neutral | 2025-10-28 |
| Rosenblatt | Maintain | Buy | 2025-10-28 |
QUALCOMM Incorporated exhibits a mixed rating environment with buy and outperform ratings balanced by neutral and underweight stances, including a recent downgrade to neutral.
Which company has the best grades?
Applied Materials, Inc. has received predominantly buy and overweight grades with positive upgrades, indicating stronger analyst confidence compared to QUALCOMM Incorporated, which has a more varied distribution including downgrades and underweight ratings. This disparity may affect investor sentiment and perceived risk differently for each company.
Strengths and Weaknesses
Below is a comparative overview of key strengths and weaknesses for Applied Materials, Inc. (AMAT) and QUALCOMM Incorporated (QCOM), based on the latest financial and market data.
| Criterion | Applied Materials, Inc. (AMAT) | QUALCOMM Incorporated (QCOM) |
|---|---|---|
| Diversification | Strong diversification across semiconductor systems, global services, and display markets | Focused primarily on semiconductor chipsets and licensing, less diversified |
| Profitability | High net margin (24.67%) and ROIC (21.96%), but declining ROIC trend | Moderate net margin (12.51%) and ROIC (13.19%), also with declining ROIC trend |
| Innovation | Strong R&D focus in semiconductor manufacturing technology | Leading innovator in wireless technology and 5G chipsets |
| Global presence | Significant global operations with broad market reach | Extensive global footprint, especially in mobile communications |
| Market Share | Leading market position in semiconductor equipment | Dominant market share in mobile chipset licensing and manufacturing |
Key takeaways: Both companies are value creators with favorable overall financial health and strong global presence. AMAT benefits from broader diversification and higher profitability, while QCOM’s strength lies in innovation within wireless technology and licensing. Both face profitability pressure with declining ROIC trends, warranting cautious investment consideration.
Risk Analysis
Below is a comparative risk overview for Applied Materials, Inc. (AMAT) and QUALCOMM Incorporated (QCOM) as of 2025:
| Metric | Applied Materials, Inc. (AMAT) | QUALCOMM Incorporated (QCOM) |
|---|---|---|
| Market Risk | High beta (1.671) indicates greater sensitivity to market swings | Moderate beta (1.212) reflects moderate market volatility |
| Debt level | Low debt-to-equity (0.35) and debt-to-assets (19.4%) – favorable leverage | Moderate debt-to-equity (0.7) and higher debt-to-assets (29.5%) – neutral to favorable |
| Regulatory Risk | Moderate, given global semiconductor industry exposure and US-China trade tensions | Elevated, due to extensive IP licensing and antitrust scrutiny in multiple jurisdictions |
| Operational Risk | Moderate; diverse segments but some dependence on cyclical semiconductor capital spending | Moderate; reliance on licensing revenue and technology development in fast-evolving wireless markets |
| Environmental Risk | Moderate; manufacturing equipment industry with environmental compliance requirements | Moderate; tech manufacturing and supply chain footprint with sustainability focus |
| Geopolitical Risk | High; significant operations and sales in Asia-Pacific, subject to geopolitical tensions | High; exposure to global wireless markets and government contracts, sensitive to geopolitical shifts |
The most impactful risks are market volatility and geopolitical tensions for both companies. AMAT’s higher beta implies greater market sensitivity, while QCOM faces regulatory challenges due to its licensing business model. Both maintain strong balance sheets, but QCOM’s higher debt levels warrant cautious monitoring.
Which Stock to Choose?
Applied Materials, Inc. (AMAT) shows steady income growth over 2021-2025 with favorable profitability and strong financial ratios, including a 34.3% ROE and low debt levels. Its rating is very favorable (B+), supported by a solid Altman Z-Score and Piotroski score, though some valuation metrics appear less attractive.
QUALCOMM Incorporated (QCOM) displays higher revenue growth but weaker net income trends, with a 26.1% ROE and moderate debt levels. Its overall rating is equally very favorable (B+), backed by a safe-zone Altman Z-Score and strong Piotroski score, but with some neutral to unfavorable leverage and valuation ratios.
For risk-averse investors prioritizing financial stability and consistent profitability, AMAT’s stronger income quality and favorable debt ratios might appear more suitable. Conversely, growth-focused investors who accept higher volatility may find QCOM’s revenue expansion and cash flow yield more aligned with their objectives.
Disclaimer: Investment carries a risk of loss of initial capital. The past performance is not a reliable indicator of future results. Be sure to understand risks before making an investment decision.
Go Further
I encourage you to read the complete analyses of Applied Materials, Inc. and QUALCOMM Incorporated to enhance your investment decisions: