Home > Comparison > Technology > AAPL vs MSFT
The strategic rivalry between Apple Inc. and Microsoft Corporation shapes the evolving landscape of the global technology sector. Apple operates as a consumer electronics powerhouse, blending hardware innovation with subscription services. Microsoft leads as a software infrastructure giant, emphasizing cloud computing and enterprise solutions. This analysis pits Apple’s integrated device ecosystem against Microsoft’s diversified software platform to uncover which offers a superior risk-adjusted return for a diversified portfolio in 2026.

Table of contents
Companies Overview
Apple Inc. and Microsoft Corporation are titans shaping the global technology landscape with distinct yet overlapping market footprints.
Apple Inc.: Consumer Electronics Innovator
Apple dominates the consumer electronics sector by designing and marketing smartphones, personal computers, tablets, and wearables. Its core revenue engine revolves around flagship products like the iPhone, Mac, and iPad, complemented by a growing ecosystem of subscription services and the App Store platform. In 2026, Apple’s strategic focus centers on expanding its services and deepening customer engagement through proprietary hardware-software integration.
Microsoft Corporation: Software Infrastructure Powerhouse
Microsoft commands the software infrastructure space, generating revenue from cloud computing, productivity software, and enterprise solutions. Its Intelligent Cloud and Productivity segments, including Azure and Office 365, form the backbone of its business model. In 2026, Microsoft emphasizes cloud platform expansion and intelligent AI integrations to drive growth across enterprise and consumer markets.
Strategic Collision: Similarities & Divergences
Both companies leverage expansive ecosystems, but Apple prioritizes a closed hardware-software ecosystem, while Microsoft champions an open platform approach with cloud and software services spanning diverse devices. They fiercely compete in cloud computing and digital services, targeting individual users and enterprises alike. Their investment profiles diverge: Apple offers a hardware-driven growth story with high brand loyalty, whereas Microsoft provides robust cloud and enterprise software exposure with broad scalability.
Income Statement Comparison
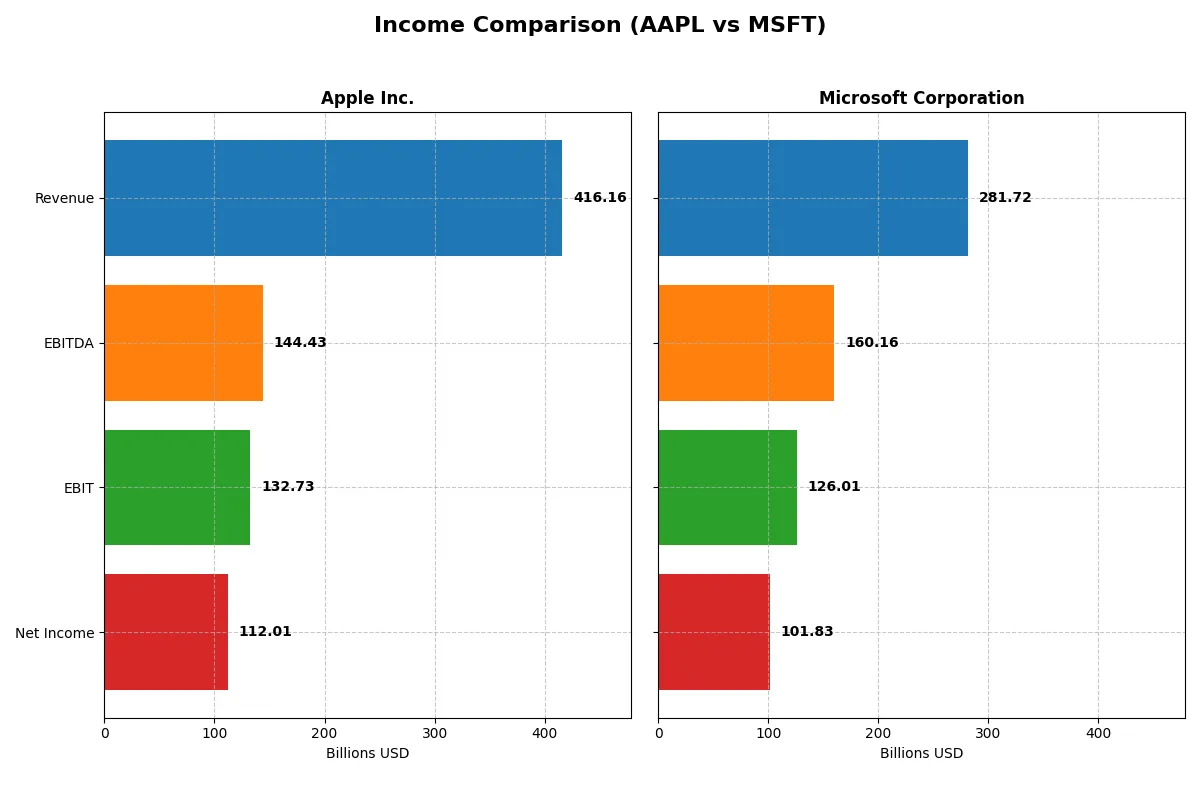
This data dissects the core profitability and scalability of both corporate engines to reveal who dominates the bottom line:
| Metric | Apple Inc. (AAPL) | Microsoft Corporation (MSFT) |
|---|---|---|
| Revenue | 416.2B | 281.7B |
| Cost of Revenue | 221.0B | 87.8B |
| Operating Expenses | 62.2B | 65.4B |
| Gross Profit | 195.2B | 193.9B |
| EBITDA | 144.4B | 160.2B |
| EBIT | 132.7B | 126.0B |
| Interest Expense | 0 | 2.4B |
| Net Income | 112.0B | 101.8B |
| EPS | 7.49 | 13.7 |
| Fiscal Year | 2025 | 2025 |
Income Statement Analysis: The Bottom-Line Duel
This income statement comparison reveals which company operates with greater efficiency and stronger profit dynamics in a competitive market environment.
Apple Inc. Analysis
Apple’s revenue rose steadily to 416B in 2025, with net income climbing to 112B, reflecting solid growth. Its gross margin holds firm at 46.9%, while net margin expanded to 26.9%, signaling improving profitability. The latest year shows strong momentum, driven by effective cost control and rising earnings per share.
Microsoft Corporation Analysis
Microsoft’s revenue surged to 282B in 2025, with net income reaching 102B, showcasing robust expansion. It boasts a superior gross margin of 68.8% and a net margin of 36.1%, both notably higher than industry averages. The company maintains high operating efficiency, supported by consistent growth in revenue and earnings per share.
Margin Power vs. Revenue Scale
Microsoft leads in margin strength and operational efficiency, with a gross margin 22 percentage points above Apple’s. Apple, meanwhile, leverages larger revenue scale and steady margin expansion. For investors, Microsoft’s higher profitability profile offers attractive efficiency, while Apple’s broad revenue base provides stability and growth potential.
Financial Ratios Comparison
These vital ratios act as a diagnostic tool to expose the underlying fiscal health, valuation premiums, and capital efficiency of the companies compared below:
| Ratios | Apple Inc. (AAPL) | Microsoft Corporation (MSFT) |
|---|---|---|
| ROE | 152% | 30% |
| ROIC | 52% | 22% |
| P/E | 34.1 | 36.3 |
| P/B | 51.8 | 10.8 |
| Current Ratio | 0.89 | 1.35 |
| Quick Ratio | 0.86 | 1.35 |
| D/E (Debt-to-Equity) | 1.67 | 0.18 |
| Debt-to-Assets | 34.3% | 9.8% |
| Interest Coverage | 0 | 53.9 |
| Asset Turnover | 1.16 | 0.46 |
| Fixed Asset Turnover | 6.82 | 1.23 |
| Payout Ratio | 13.8% | 23.6% |
| Dividend Yield | 0.40% | 0.65% |
| Fiscal Year | 2025 | 2025 |
Efficiency & Valuation Duel: The Vital Signs
Financial ratios serve as a company’s DNA, uncovering hidden risks and operational excellence that shape investor confidence and strategy.
Apple Inc.
Apple delivers exceptional profitability with a 152% ROE and a strong 27% net margin, signaling efficient capital use and robust earnings. However, its valuation appears stretched, with a high P/E of 34.1 and an elevated price-to-book of 51.8. Apple returns value through dividends, though yield remains modest at 0.4%, reflecting a balanced approach between shareholder payouts and reinvestment in R&D.
Microsoft Corporation
Microsoft posts solid profitability, with a 30% ROE and a superior 36% net margin, indicating efficient operations despite a lower asset turnover. Its valuation also looks expensive, marked by a P/E of 36.3 and a more reasonable price-to-book ratio of 10.8. Microsoft maintains a slightly higher dividend yield of 0.65% and boasts conservative leverage, favoring shareholder returns alongside strategic reinvestment in growth.
Premium Valuation vs. Operational Safety
Apple offers extraordinary returns on equity and capital but trades at a higher valuation premium and shows weaker liquidity. Microsoft presents a safer financial profile with moderate profitability, lower debt, and better liquidity despite its expensive valuation. Investors seeking aggressive growth may prefer Apple’s profile, while those prioritizing balance and stability might lean toward Microsoft.
Which one offers the Superior Shareholder Reward?
I compare Apple Inc. and Microsoft Corporation by their dividend yield, payout ratios, and buyback intensity to find the superior shareholder reward in 2026. Apple yields around 0.4% with a 14% payout ratio, balancing dividends and strong buybacks fueled by 89% FCF coverage. Microsoft offers a higher 0.65% yield but pays out 24% of earnings, with a moderate buyback scale. Apple’s buyback activity alongside a lower payout ratio suggests a more sustainable and flexible capital return model. Microsoft’s higher dividend yield is attractive but comes with less FCF coverage and higher payout risk. I conclude Apple Inc. offers a superior total return profile for long-term investors in 2026.
Comparative Score Analysis: The Strategic Profile
The radar chart reveals the fundamental DNA and trade-offs of Apple Inc. and Microsoft Corporation, highlighting their financial strengths and vulnerabilities across key metrics:
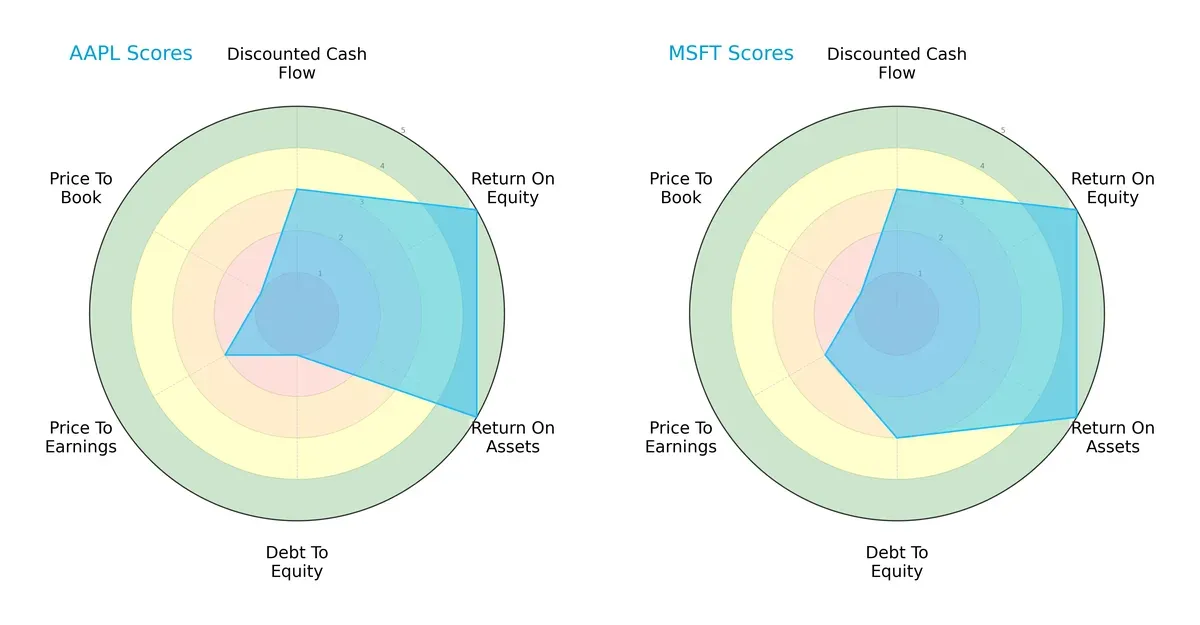
Both companies show identical DCF, ROE, and ROA scores, demonstrating strong profitability and cash flow fundamentals. Microsoft edges out Apple in debt management with a moderate debt-to-equity score of 3 versus Apple’s very unfavorable 1. However, both struggle with valuation metrics, scoring low on price-to-book. Microsoft presents a more balanced financial profile, while Apple relies heavily on operational efficiency despite a weaker balance sheet.
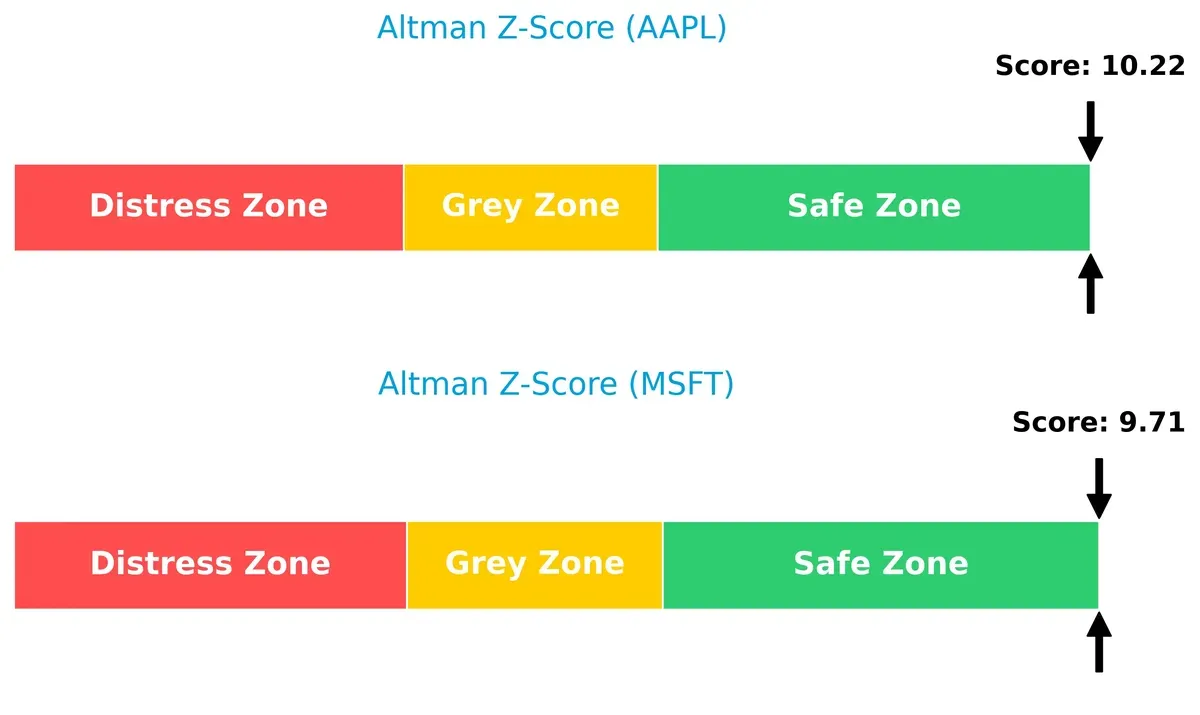
Bankruptcy Risk: Solvency Showdown
Apple’s Altman Z-Score of 10.22 slightly surpasses Microsoft’s 9.71, confirming both firms are firmly in the safe zone for long-term survival in this economic cycle:
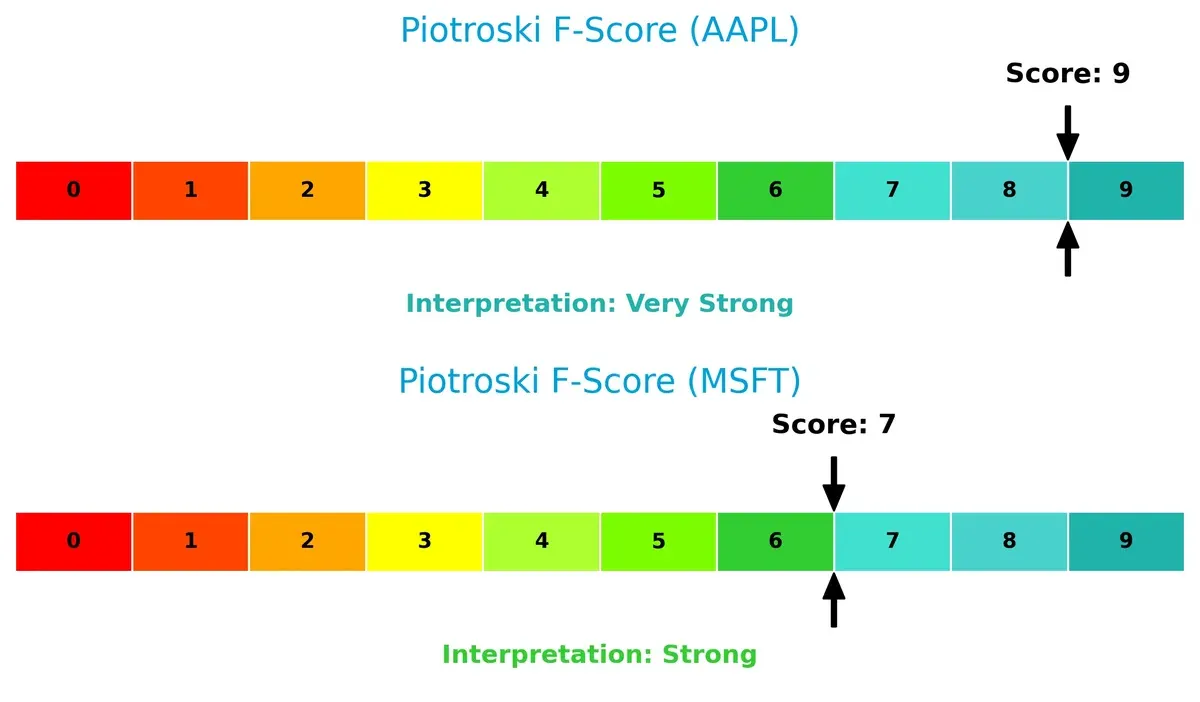
Financial Health: Quality of Operations
Apple leads with a Piotroski F-Score of 9, indicating peak financial health and operational strength. Microsoft’s score of 7 is strong but suggests some internal metrics could improve:
How are the two companies positioned?
This section dissects Apple and Microsoft’s operational DNA by comparing their revenue distribution and internal dynamics. The goal is to confront their economic moats to reveal which model delivers the strongest, most durable competitive advantage today.
Revenue Segmentation: The Strategic Mix
The following visual comparison dissects how Apple Inc. and Microsoft Corporation diversify their income streams and where their primary sector bets lie:
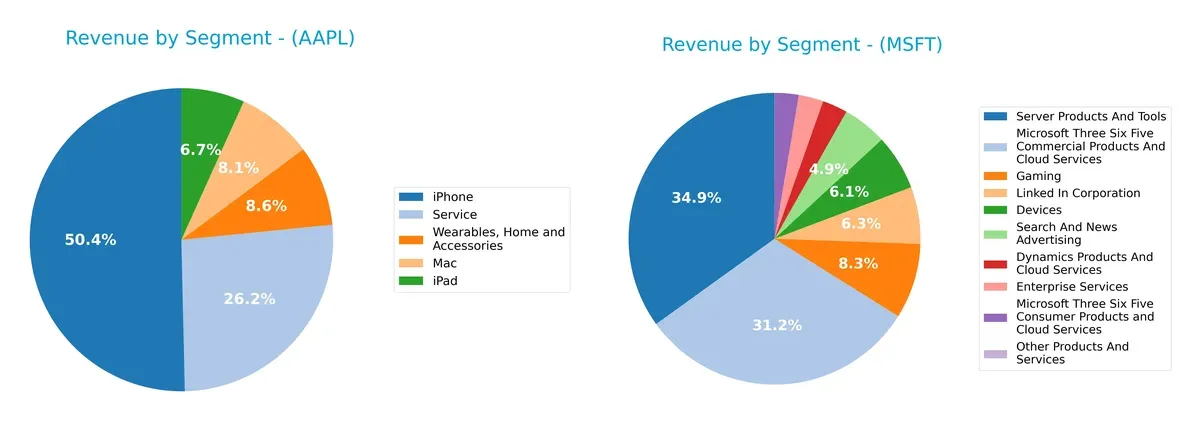
Apple’s revenue pivots heavily on the iPhone, generating $210B in 2025, dwarfing other segments like Services at $109B and Wearables at $36B. Microsoft displays a more diversified mix, with Server Products and Tools leading at $98B, followed by Microsoft 365 Commercial Services at $88B, and LinkedIn at $18B. Apple’s concentration signals strong ecosystem lock-in but exposes it to product cycle risks. Microsoft’s broad spread reduces dependency risks and anchors its cloud infrastructure dominance.
Strengths and Weaknesses Comparison
This table compares the strengths and weaknesses of Apple Inc. and Microsoft Corporation based on key financial and market criteria:
Apple Inc. Strengths
- Strong profitability with net margin 26.9% and ROIC 52%
- Extensive product diversification including iPhone, Services, Mac, and Wearables
- Global presence with significant revenue from Americas, Europe, Greater China
- High asset turnover indicating efficient use of assets
- Robust innovation in diverse hardware and software segments
Microsoft Corporation Strengths
- Higher net margin at 36.2% and strong ROE near 30%
- Diversified revenue streams from cloud, gaming, LinkedIn, Office, and server products
- Solid global revenue split between US and Non-US markets
- Low debt-to-equity ratio (0.18) indicating conservative leverage
- Favorable liquidity ratios supporting financial flexibility
Apple Inc. Weaknesses
- Unfavorable valuation multiples with PE 34 and PB 52, indicating high market expectations
- Low current ratio (0.89) signals potential short-term liquidity risk
- Higher debt-to-equity (1.67) compared to industry peers
- Lower dividend yield at 0.4%
- Some unfavorable ratios in valuation and leverage
Microsoft Corporation Weaknesses
- Unfavorable valuation multiples with PE 36 and PB 11
- Lower asset turnover (0.46) suggests less efficient asset utilization
- Dividend yield modest at 0.65%
- Some neutral or unfavorable metrics in asset turnover and valuation
Apple demonstrates strong profitability and asset efficiency, supported by diverse product lines and global reach, but faces valuation and liquidity concerns. Microsoft shows robust margins and conservative leverage with diversified revenue, though it lags in asset efficiency and faces similarly high valuation multiples. Each company’s financial profile highlights distinct strategic priorities and risk factors.
The Moat Duel: Analyzing Competitive Defensibility
A structural moat protects long-term profits from relentless competition and market disruption. Here is how Apple and Microsoft stack up:
Apple Inc.: Ecosystem Lock-in with Intangible Assets
Apple leverages a powerful ecosystem of hardware, software, and services, reflected in a very favorable ROIC exceeding WACC by 43%. This moat drives margin stability and growing profitability. New product launches and expanding services in 2026 should deepen this advantage.
Microsoft Corporation: Platform Dominance with Cost Advantage
Microsoft’s moat arises from its dominant software platforms and cloud infrastructure. Although ROIC remains above WACC, it declined by 7.5% recently. The firm sustains strong margins and revenue growth. Continued cloud expansion and AI integration offer growth but face intensifying competition.
Verdict: Ecosystem Lock-in vs. Platform Dominance
Apple’s moat is deeper and more durable, showing expanding profitability and value creation. Microsoft creates value but its declining ROIC signals caution. Apple is better positioned to defend market share in 2026.
Which stock offers better returns?
Apple Inc. and Microsoft Corporation stock prices show contrasting movements over the past year, with Apple surging strongly before slowing recently, while Microsoft’s modest gains faced sharper recent declines.
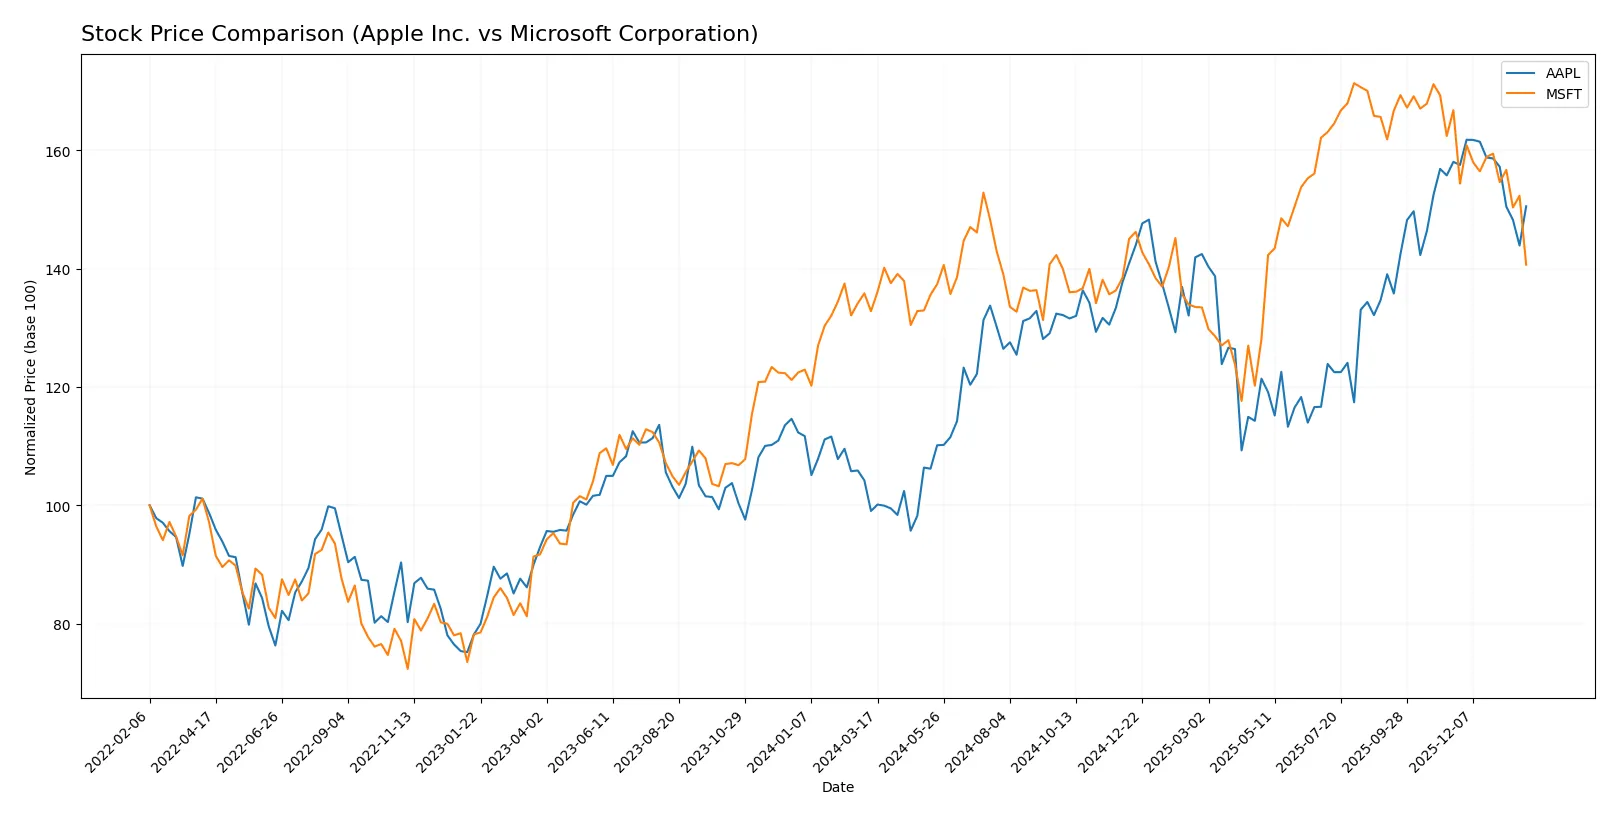
Trend Comparison
Apple’s stock rose 52% over the past 12 months, indicating a bullish trend with decelerating momentum. It reached a high of 278.85 and a low of 165.0, showing strong but slowing gains.
Microsoft’s stock increased 5.9% in the last year, also bullish but with decelerating strength. It hit a peak of 524.11 and a low of 359.84, reflecting moderate appreciation amid volatility.
Comparing both, Apple delivered significantly higher returns with a 52% gain versus Microsoft’s 5.9%, making Apple the stronger performer over the past year.
Target Prices
Analysts show a bullish consensus for both Apple Inc. and Microsoft Corporation, signaling strong upside potential.
| Company | Target Low | Target High | Consensus |
|---|---|---|---|
| Apple Inc. | 220 | 350 | 300.78 |
| Microsoft Corporation | 450 | 675 | 604.08 |
Apple’s target consensus at $300.78 suggests a 16% upside from its current $259.48 price. Microsoft’s $604.08 consensus implies a nearly 40% gain from $430.29.

Don’t Let Luck Decide Your Entry Point
Optimize your entry points with our advanced ProRealTime indicators. You’ll get efficient buy signals with precise price targets for maximum performance. Start outperforming now!
How do institutions grade them?
Here are the recent grades from reputable financial institutions for both companies:
Apple Inc. Grades
This table summarizes the latest institutional grades for Apple Inc.:
| Grading Company | Action | New Grade | Date |
|---|---|---|---|
| Rosenblatt | Maintain | Neutral | 2026-01-30 |
| Needham | Maintain | Hold | 2026-01-30 |
| Jefferies | Maintain | Hold | 2026-01-30 |
| Wedbush | Maintain | Outperform | 2026-01-30 |
| JP Morgan | Maintain | Overweight | 2026-01-30 |
| Maxim Group | Upgrade | Buy | 2026-01-30 |
| TD Cowen | Maintain | Buy | 2026-01-30 |
| DA Davidson | Maintain | Neutral | 2026-01-30 |
| Barclays | Maintain | Underweight | 2026-01-30 |
| JP Morgan | Maintain | Overweight | 2026-01-26 |
Microsoft Corporation Grades
This table lists the most recent institutional ratings for Microsoft Corporation:
| Grading Company | Action | New Grade | Date |
|---|---|---|---|
| Citigroup | Maintain | Buy | 2026-01-30 |
| Wells Fargo | Maintain | Overweight | 2026-01-29 |
| Wedbush | Maintain | Outperform | 2026-01-29 |
| Scotiabank | Maintain | Sector Outperform | 2026-01-29 |
| RBC Capital | Maintain | Outperform | 2026-01-29 |
| Stifel | Maintain | Buy | 2026-01-29 |
| Evercore ISI Group | Maintain | Outperform | 2026-01-29 |
| Keybanc | Maintain | Overweight | 2026-01-29 |
| Piper Sandler | Maintain | Overweight | 2026-01-29 |
| Cantor Fitzgerald | Maintain | Overweight | 2026-01-29 |
Which company has the best grades?
Microsoft holds consistently higher ratings, with multiple “Buy,” “Overweight,” and “Outperform” grades. Apple shows mixed signals, including “Hold” and “Neutral.” Investors may perceive Microsoft as stronger based on this institutional sentiment.
Risks specific to each company
The following categories identify the critical pressure points and systemic threats facing both firms in the 2026 market environment:
1. Market & Competition
Apple Inc.
- Faces intense competition in consumer electronics and services; innovation pace is crucial to maintain market share.
Microsoft Corporation
- Dominates software infrastructure with cloud growth, but faces stiff competition from AWS and Google Cloud.
2. Capital Structure & Debt
Apple Inc.
- High debt-to-equity ratio (1.67) signals leveraged balance sheet, increasing financial risk despite strong interest coverage.
Microsoft Corporation
- Low debt-to-equity ratio (0.18) reflects conservative leverage, supporting financial flexibility and risk mitigation.
3. Stock Volatility
Apple Inc.
- Beta of 1.093 indicates slightly above-market volatility; stock price range is $169–289, showing significant price swings.
Microsoft Corporation
- Beta of 1.073 suggests moderate volatility; wider price range from $345 to $555 signals occasional sharp moves.
4. Regulatory & Legal
Apple Inc.
- Subject to global antitrust scrutiny and privacy regulations, which could impact product offerings and services.
Microsoft Corporation
- Faces regulatory risks tied to data privacy, cloud security, and potential antitrust actions in multiple jurisdictions.
5. Supply Chain & Operations
Apple Inc.
- Reliant on complex global supply chains for hardware; disruptions or geopolitical tensions pose operational risks.
Microsoft Corporation
- Software-focused model reduces supply chain risk, but hardware segments like Surface and Xbox remain exposed to component shortages.
6. ESG & Climate Transition
Apple Inc.
- Commits to carbon neutrality, but faces challenges integrating ESG deeply into hardware production and sourcing.
Microsoft Corporation
- Aggressive climate goals and extensive ESG reporting support sustainability credentials, enhancing reputational strength.
7. Geopolitical Exposure
Apple Inc.
- Significant exposure to China for manufacturing and sales; trade tensions and policy shifts could disrupt operations.
Microsoft Corporation
- Diverse global footprint with cloud services less dependent on any single country, mitigating geopolitical risks.
Which company shows a better risk-adjusted profile?
Apple’s most pressing risk is its elevated leverage which heightens financial vulnerability despite its cash flow strength. Microsoft’s key risk lies in intense cloud competition that could pressure margins. Microsoft’s conservative capital structure and diversified revenue provide a more balanced risk profile. Notably, Apple’s current ratio below 1 raises liquidity concerns, while Microsoft’s stronger liquidity ratios support operational resilience. This combination leads me to favor Microsoft’s risk-adjusted stance amid today’s market complexities.
Final Verdict: Which stock to choose?
Apple Inc. wields unmatched capital efficiency, generating returns far above its cost of capital. Its superpower lies in relentless value creation and growing profitability. A point of vigilance remains its tight liquidity position, which could pressure short-term flexibility. Apple suits portfolios focused on aggressive growth with a tolerance for operational leverage.
Microsoft Corporation commands a strategic moat through cloud dominance and robust recurring revenue streams. Its safety profile is stronger than Apple’s, supported by a healthier balance sheet and more conservative leverage. Microsoft fits well in GARP portfolios seeking steady growth paired with financial stability and lower risk exposure.
If you prioritize dynamic capital returns and accelerating profitability, Apple outshines with its durable competitive advantage and superior ROIC trend. However, if you seek better stability and a fortress-like balance sheet, Microsoft offers a compelling scenario with lower financial risk and a resilient moat. Both stocks present slightly favorable fundamentals but cater to distinct investor profiles.
Disclaimer: Investment carries a risk of loss of initial capital. The past performance is not a reliable indicator of future results. Be sure to understand risks before making an investment decision.
Go Further
I encourage you to read the complete analyses of Apple Inc. and Microsoft Corporation to enhance your investment decisions: