In the fast-evolving semiconductor industry, QUALCOMM Incorporated and Analog Devices, Inc. stand out as leading innovators shaping wireless communication and signal processing technologies. Both companies operate within overlapping markets, focusing on cutting-edge solutions from 5G to advanced analog and mixed-signal integrated circuits. This comparison aims to help investors understand which company offers the most compelling growth and stability prospects in today’s tech landscape. Let’s explore which stock might best enhance your investment portfolio.

Table of contents
Companies Overview
I will begin the comparison between QUALCOMM and Analog Devices by providing an overview of these two companies and their main differences.
QUALCOMM Overview
QUALCOMM Incorporated focuses on developing and commercializing foundational technologies for the wireless industry globally. It operates through three segments: Qualcomm CDMA Technologies, Qualcomm Technology Licensing, and Qualcomm Strategic Initiatives. The company leads in integrated circuits and system software for wireless voice and data communications, licensing intellectual property, and investing in emerging technologies such as 5G and artificial intelligence.
Analog Devices Overview
Analog Devices, Inc. designs, manufactures, and markets integrated circuits and subsystems using analog, mixed-signal, and digital signal processing technologies. Its products include data converters, power management ICs, amplifiers, radio frequency ICs, and microelectromechanical systems. The company serves multiple markets including industrial, automotive, consumer, aerospace, and communications with a global sales network.
Key similarities and differences
Both QUALCOMM and Analog Devices operate in the semiconductor industry with a strong focus on advanced integrated circuit technologies. QUALCOMM emphasizes wireless communications and intellectual property licensing, whereas Analog Devices specializes in analog and mixed-signal processing components for diverse applications. QUALCOMM has a broader scope including strategic investments, while Analog Devices concentrates more on product design and manufacturing across multiple end markets.
Income Statement Comparison
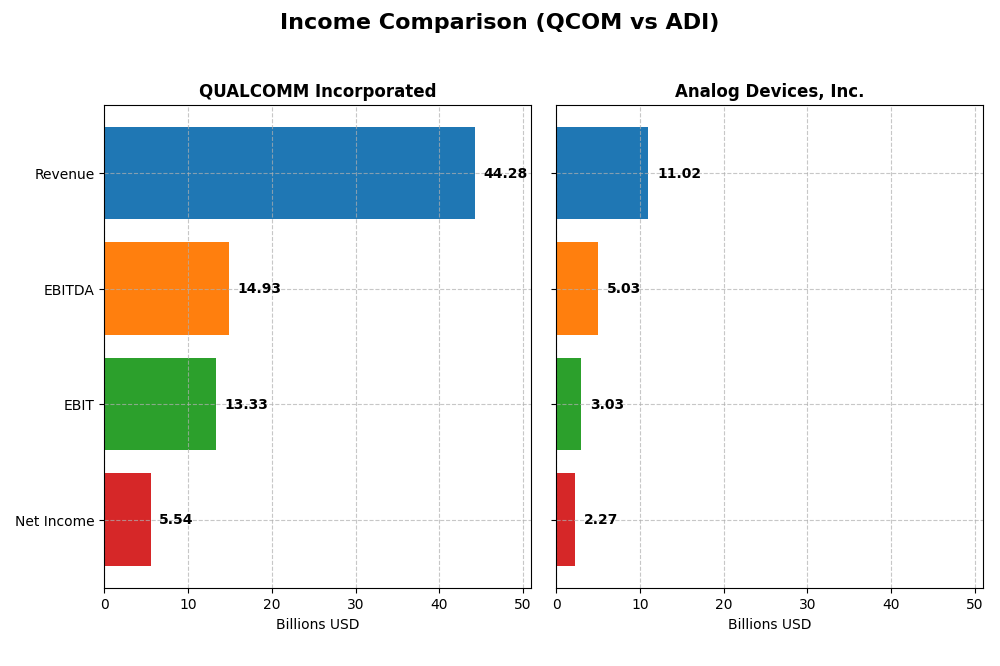
The table below presents a side-by-side comparison of key income statement metrics for QUALCOMM Incorporated and Analog Devices, Inc. based on their most recent fiscal year data.
| Metric | QUALCOMM Incorporated | Analog Devices, Inc. |
|---|---|---|
| Market Cap | 175B | 150B |
| Revenue | 44.3B | 11.0B |
| EBITDA | 14.9B | 5.0B |
| EBIT | 13.3B | 3.0B |
| Net Income | 5.5B | 2.3B |
| EPS | 5.06 | 4.59 |
| Fiscal Year | 2025 | 2025 |
Income Statement Interpretations
QUALCOMM Incorporated
QUALCOMM’s revenue showed a positive trend, increasing from $33.6B in 2021 to $44.3B in 2025, a 31.93% growth over five years. Net income, however, declined overall by 38.73%, falling to $5.54B in 2025. Gross and EBIT margins remained favorable, at 55.43% and 30.09% respectively, but net margin dropped notably in 2025, reflecting margin contraction despite solid top-line growth.
Analog Devices, Inc.
Analog Devices exhibited strong revenue growth, from $7.3B in 2021 to $11B in 2025, a 50.58% increase. Net income also rose robustly by 63.07%, reaching $2.27B in 2025. Margins stayed favorable, with gross margin near 54.66% and EBIT margin at 27.49%. The latest year showed improved net margin growth of 18.61%, evidencing enhanced profitability alongside healthy revenue expansion.
Which one has the stronger fundamentals?
Analog Devices displays stronger fundamentals with consistent growth across revenue, net income, and margins, all favorable over the period. QUALCOMM’s robust revenue growth is tempered by net income and margin declines, particularly the significant net margin contraction in 2025. Thus, Analog Devices’ income statement reflects more balanced and sustained financial health.
Financial Ratios Comparison
The table below presents the most recent key financial ratios for QUALCOMM Incorporated and Analog Devices, Inc., highlighting profitability, liquidity, leverage, efficiency, and dividend metrics for fiscal year 2025.
| Ratios | QUALCOMM Incorporated (QCOM) | Analog Devices, Inc. (ADI) |
|---|---|---|
| ROE | 26.13% | 6.70% |
| ROIC | 13.19% | 5.55% |
| P/E | 32.70 | 51.05 |
| P/B | 8.54 | 3.42 |
| Current Ratio | 2.82 | 2.19 |
| Quick Ratio | 2.10 | 1.68 |
| D/E (Debt-to-Equity) | 0.70 | 0.26 |
| Debt-to-Assets | 29.54% | 18.05% |
| Interest Coverage | 18.61 | 9.45 |
| Asset Turnover | 0.88 | 0.23 |
| Fixed Asset Turnover | 9.44 | 3.32 |
| Payout Ratio | 68.67% | 84.88% |
| Dividend Yield | 2.10% | 1.66% |
Interpretation of the Ratios
QUALCOMM Incorporated
QUALCOMM shows mostly strong financial ratios with favorable net margin (12.51%), ROE (26.13%), and ROIC (13.19%), reflecting efficient profitability and capital use. Liquidity is solid with a current ratio of 2.82. Concerns include high PE and PB ratios, indicating expensive valuation. The company pays dividends, yielding 2.1%, supported by stable free cash flow, though payout sustainability should be monitored.
Analog Devices, Inc.
Analog Devices presents a mixed ratio profile with a robust net margin of 20.58% but a weak ROE at 6.7%, signaling less effective equity utilization. Liquidity ratios are favorable, and debt levels are conservative. The high PE ratio suggests overvaluation risks. Dividend yield is modest at 1.66%, with a neutral status reflecting cautious investor sentiment toward returns and payout coverage.
Which one has the best ratios?
QUALCOMM’s ratios are globally more favorable, especially in profitability, liquidity, and shareholder returns, despite valuation concerns. Analog Devices has some strong points but suffers from lower equity returns and weaker asset turnover. Overall, QUALCOMM demonstrates a stronger ratio profile based on the provided data and evaluations.
Strategic Positioning
This section compares the strategic positioning of QUALCOMM and Analog Devices, including market position, key segments, and exposure to technological disruption:
QUALCOMM Incorporated
- Leading wireless technology developer with strong competitive pressure in semiconductors
- Key segments: QCT (integrated circuits for wireless tech), QTL (IP licensing), QSI (investments in AI, 5G, IoT)
- Focused on foundational wireless technologies; exposure to disruption via investments in 5G, AI, IoT
Analog Devices, Inc.
- Well-established semiconductor firm with moderate competitive pressure across multiple markets
- Key segments: Automotive, Industrial, Communications, Consumer markets with diverse product range
- Exposure to disruption through analog, mixed-signal, and digital signal processing innovations
QUALCOMM vs Analog Devices Positioning
QUALCOMM’s strategy is concentrated on wireless communications and IP licensing, leveraging its foundational technologies and strategic investments. Analog Devices pursues a more diversified approach across automotive, industrial, and consumer segments, focusing on analog and mixed-signal processing. QUALCOMM’s focus offers strong specialization, while Analog Devices benefits from broad market exposure.
Which has the best competitive advantage?
QUALCOMM shows a slightly favorable moat, creating value despite declining profitability. Analog Devices has a slightly unfavorable moat, currently shedding value but with improving profitability, indicating differing competitive strength dynamics.
Stock Comparison
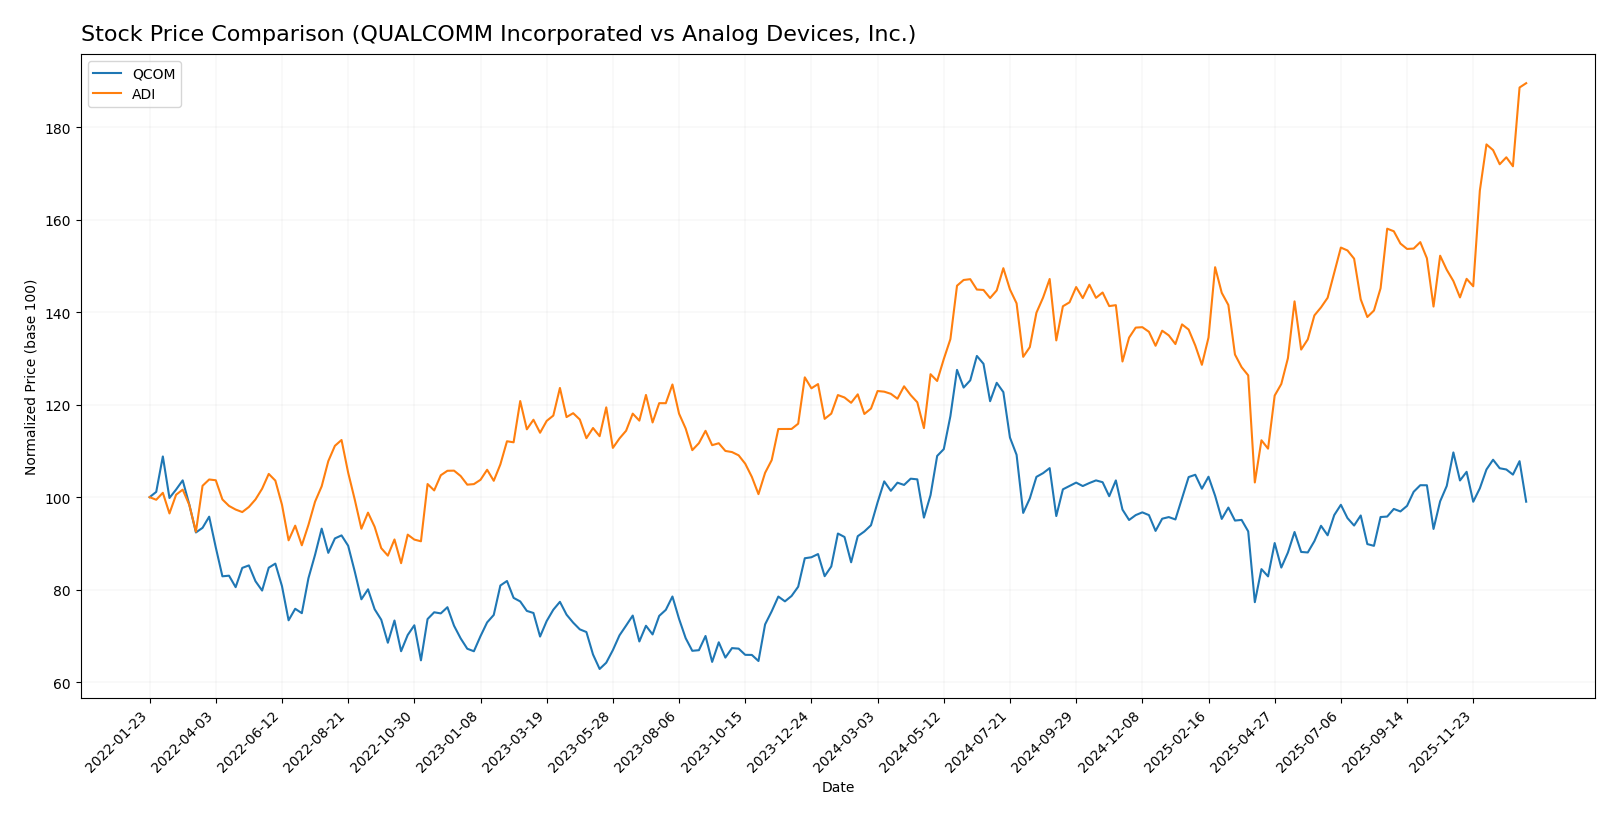
The stock price movements of QUALCOMM Incorporated (QCOM) and Analog Devices, Inc. (ADI) over the past 12 months reveal contrasting dynamics, with ADI showing a notably stronger bullish momentum and QCOM experiencing recent short-term weakness despite an overall upward trend.
Trend Analysis
QUALCOMM’s stock price increased by 5.43% over the past 12 months, indicating a bullish trend with acceleration. The price ranged from a low of 127.46 to a high of 215.33, with recent weeks showing a slight bearish correction of -9.72%.
Analog Devices posted a robust 59.08% gain over the same period, confirming a strong bullish trend with acceleration. The stock demonstrated high volatility with a standard deviation of 24.22, and a recent surge of 29.17% suggests momentum is intensifying.
Comparing the two, Analog Devices delivered the highest market performance with a substantially larger overall gain and stronger recent upward momentum than QUALCOMM.
Target Prices
The consensus target prices reflect bullish expectations from analysts for both QUALCOMM Incorporated and Analog Devices, Inc.
| Company | Target High | Target Low | Consensus |
|---|---|---|---|
| QUALCOMM Incorporated | 210 | 165 | 185.71 |
| Analog Devices, Inc. | 375 | 270 | 304.73 |
Analysts expect QUALCOMM’s stock to rise moderately above its current price of 163.09 USD, while Analog Devices is anticipated to sustain gains near its present level of 302.89 USD.
Analyst Opinions Comparison
This section compares analysts’ ratings and grades for QUALCOMM Incorporated and Analog Devices, Inc.:
Rating Comparison
QUALCOMM Rating
- Rating: B+, assessed as Very Favorable
- Discounted Cash Flow Score: 4, Favorable
- ROE Score: 5, Very Favorable
- ROA Score: 5, Very Favorable
- Debt To Equity Score: 1, Very Unfavorable
- Overall Score: 3, Moderate
Analog Devices Rating
- Rating: B-, assessed as Very Favorable
- Discounted Cash Flow Score: 4, Favorable
- ROE Score: 3, Moderate
- ROA Score: 3, Moderate
- Debt To Equity Score: 2, Moderate
- Overall Score: 3, Moderate
Which one is the best rated?
QUALCOMM holds a higher rating of B+ compared to Analog Devices’ B-, with stronger ROE and ROA scores. However, QUALCOMM’s debt to equity score is less favorable. Overall scores are equal at 3.
Scores Comparison
The comparison of scores for QUALCOMM and Analog Devices highlights their financial stability and strength:
QUALCOMM Scores
- Altman Z-Score: 6.37, indicating a safe zone with low bankruptcy risk.
- Piotroski Score: 7, reflecting strong financial health.
Analog Devices Scores
- Altman Z-Score: 6.99, indicating a safe zone with low bankruptcy risk.
- Piotroski Score: 7, reflecting strong financial health.
Which company has the best scores?
Both QUALCOMM and Analog Devices show strong financial health with identical Piotroski scores of 7. Analog Devices has a slightly higher Altman Z-Score, suggesting marginally better bankruptcy safety, based on the provided data.
Grades Comparison
Here is a detailed comparison of recent grades from recognized grading companies for the two semiconductor firms:
QUALCOMM Incorporated Grades
The table below shows recent analyst grades and actions for QUALCOMM Incorporated:
| Grading Company | Action | New Grade | Date |
|---|---|---|---|
| Mizuho | Downgrade | Neutral | 2026-01-09 |
| Rosenblatt | Maintain | Buy | 2025-11-06 |
| B of A Securities | Maintain | Buy | 2025-11-06 |
| Mizuho | Maintain | Outperform | 2025-11-06 |
| Wells Fargo | Maintain | Underweight | 2025-11-06 |
| Piper Sandler | Maintain | Overweight | 2025-11-06 |
| UBS | Maintain | Neutral | 2025-11-06 |
| JP Morgan | Maintain | Overweight | 2025-11-04 |
| Citigroup | Maintain | Neutral | 2025-10-28 |
| Rosenblatt | Maintain | Buy | 2025-10-28 |
QUALCOMM’s grades show a mix of Buy, Neutral, and Overweight ratings with one recent downgrade to Neutral by Mizuho, indicating some cautious sentiment among analysts.
Analog Devices, Inc. Grades
The table below shows recent analyst grades and actions for Analog Devices, Inc.:
| Grading Company | Action | New Grade | Date |
|---|---|---|---|
| Keybanc | Maintain | Overweight | 2026-01-13 |
| Truist Securities | Maintain | Hold | 2025-12-19 |
| UBS | Maintain | Buy | 2025-12-08 |
| Wells Fargo | Maintain | Equal Weight | 2025-11-26 |
| B of A Securities | Maintain | Buy | 2025-11-26 |
| Evercore ISI Group | Maintain | Outperform | 2025-11-26 |
| JP Morgan | Maintain | Overweight | 2025-11-26 |
| Baird | Maintain | Outperform | 2025-11-26 |
| Benchmark | Maintain | Buy | 2025-11-26 |
| Truist Securities | Maintain | Hold | 2025-11-26 |
Analog Devices maintains predominantly Buy, Overweight, and Outperform ratings, reflecting generally positive analyst confidence without recent downgrades.
Which company has the best grades?
Analog Devices has received a higher concentration of Buy and Outperform grades compared to QUALCOMM’s more mixed ratings including Neutral and Underweight. This broader positive consensus may signal comparatively stronger analyst confidence for Analog Devices, potentially influencing investor sentiment toward perceived stability and growth prospects.
Strengths and Weaknesses
Below is a comparative table highlighting key strengths and weaknesses of QUALCOMM Incorporated (QCOM) and Analog Devices, Inc. (ADI) based on the most recent data from 2025.
| Criterion | QUALCOMM Incorporated (QCOM) | Analog Devices, Inc. (ADI) |
|---|---|---|
| Diversification | Strong focus on wireless technology and chipsets with significant revenue from QCT segment; moderate diversification | Well-diversified across Automotive, Industrial, Consumer, and Communications sectors |
| Profitability | Favorable net margin (12.5%), high ROIC (13.2%), strong ROE (26.1%) | Higher net margin (20.6%) but lower ROE (6.7%) and neutral ROIC (5.6%) |
| Innovation | Slightly favorable economic moat; strong R&D in wireless tech but declining ROIC trend | Slightly unfavorable economic moat; increasing ROIC trend indicates improving innovation impact |
| Global presence | Large global footprint through chip licensing and QTL segment | Global presence with broad industrial and automotive applications |
| Market Share | Leading market share in mobile chipset technology | Strong presence in analog and mixed-signal semiconductors, growing in automotive |
Key takeaways: QUALCOMM exhibits strong profitability and leadership in mobile chipset technology but faces a declining ROIC trend, signaling caution. Analog Devices shows improving profitability and diversification, although it currently sheds value with a slightly unfavorable moat, presenting potential upside with ongoing innovation.
Risk Analysis
Below is a comparative risk overview for QUALCOMM Incorporated (QCOM) and Analog Devices, Inc. (ADI) based on their most recent 2025 financial and operational data.
| Metric | QUALCOMM Incorporated (QCOM) | Analog Devices, Inc. (ADI) |
|---|---|---|
| Market Risk | Beta 1.21, moderate volatility, P/E 32.7 (unfavorable) | Beta 1.03, lower volatility, P/E 51.05 (unfavorable) |
| Debt level | Debt-to-Equity 0.7 (neutral), Debt-to-Assets 29.5% (favorable) | Debt-to-Equity 0.26 (favorable), Debt-to-Assets 18.1% (favorable) |
| Regulatory Risk | Exposure to telecom patents and licensing laws globally | Exposure to international trade policies affecting semiconductor sales |
| Operational Risk | Complex supply chain for advanced chips and licensing | Dependence on manufacturing efficiency and tech innovation cycles |
| Environmental Risk | Moderate, technology sector pressure on sustainability | Moderate, with industrial and automotive market focus requiring compliance |
| Geopolitical Risk | US-China tech tensions impacting supply and IP rights | Similar exposure to geopolitical trade disputes and export controls |
QUALCOMM faces higher market risk due to its elevated valuation multiples and moderate leverage, while Analog Devices benefits from lower debt but contends with higher P/E risk. Geopolitical tensions, especially US-China relations, remain the most impactful risk for both companies, potentially disrupting supply chains and market access.
Which Stock to Choose?
QUALCOMM Incorporated (QCOM) shows a favorable income evolution with strong revenue and EBIT growth, despite recent declines in net margin and EPS. Its financial ratios are largely favorable, including high ROE and dividend yield, with moderate debt levels and a very favorable B+ rating.
Analog Devices, Inc. (ADI) displays consistently favorable income growth across all metrics, including net margin and EPS improvements. Its financial ratios are slightly favorable overall, with low debt and a solid current ratio, although ROE is weaker; the company holds a very favorable B- rating.
Investors focused on stable income growth and strong profitability might find ADI appealing due to its consistent earnings improvements and a slightly favorable financial ratio profile. Conversely, those valuing higher returns on equity and dividends could see QCOM as more attractive, despite some recent margin pressures.
Disclaimer: Investment carries a risk of loss of initial capital. The past performance is not a reliable indicator of future results. Be sure to understand risks before making an investment decision.
Go Further
I encourage you to read the complete analyses of QUALCOMM Incorporated and Analog Devices, Inc. to enhance your investment decisions: