QUALCOMM Incorporated and Ambarella, Inc. are two key players in the semiconductor industry, each driving innovation in wireless technology and video processing, respectively. While QUALCOMM focuses on foundational wireless communications and licensing, Ambarella specializes in advanced video and AI semiconductor solutions. Their overlapping presence in cutting-edge technology markets makes this comparison crucial. Join me as we explore which company presents the most compelling investment opportunity in 2026.

Table of contents
Companies Overview
I will begin the comparison between QUALCOMM and Ambarella by providing an overview of these two companies and their main differences.
QUALCOMM Overview
QUALCOMM Incorporated is a major player in the wireless technology industry, focusing on the development and commercialization of foundational technologies worldwide. The company operates through three segments: Qualcomm CDMA Technologies, Qualcomm Technology Licensing, and Qualcomm Strategic Initiatives. Its expertise spans integrated circuits, system software, and intellectual property licensing related to 3G, 4G, and 5G communications. QUALCOMM is headquartered in San Diego, CA, and employs approximately 49,000 people.
Ambarella Overview
Ambarella, Inc. specializes in semiconductor solutions for video processing, including high-definition compression, image processing, and deep neural network processing. Its system-on-a-chip designs integrate video, image, AI, and audio processing for diverse applications such as automotive cameras, security cameras, robotics, and consumer devices. Headquartered in Santa Clara, CA, Ambarella employs about 941 people and sells primarily to original design and equipment manufacturers.
Key similarities and differences
Both QUALCOMM and Ambarella operate in the semiconductor industry and focus on advanced technology solutions. QUALCOMM has a broader scope, targeting wireless communications and licensing intellectual property, while Ambarella concentrates on video and image processing chips with AI integration. QUALCOMM’s business is more diversified with multiple segments and a larger workforce, whereas Ambarella has a narrower product focus and smaller scale, emphasizing specialized video semiconductor solutions.
Income Statement Comparison
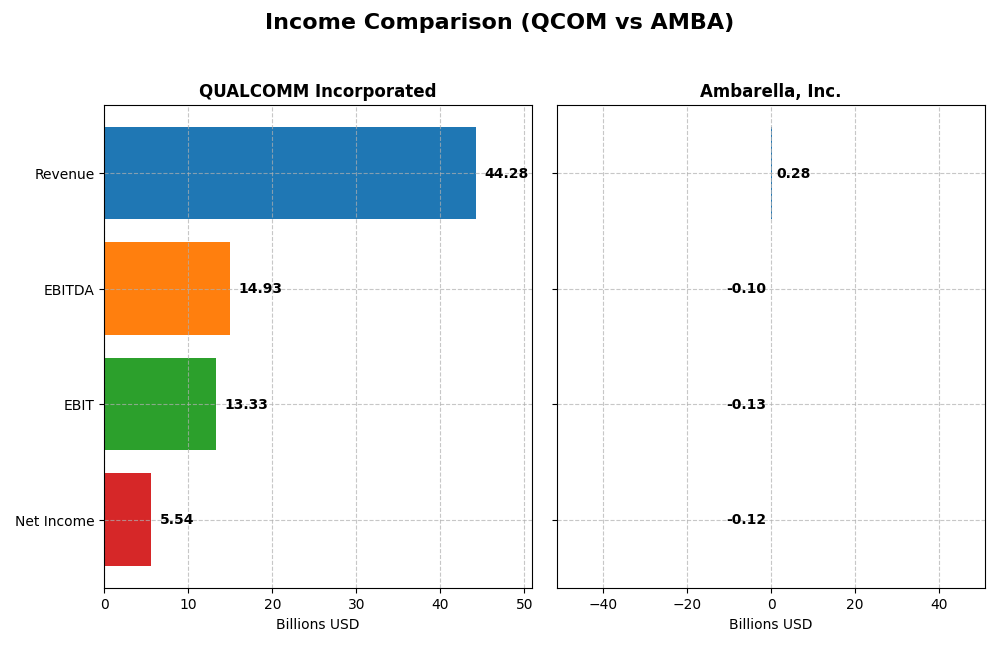
The following table presents a side-by-side comparison of key income statement metrics for QUALCOMM Incorporated and Ambarella, Inc. for their most recent fiscal years.
| Metric | QUALCOMM Incorporated | Ambarella, Inc. |
|---|---|---|
| Market Cap | 175.3B | 2.8B |
| Revenue | 44.3B | 285M |
| EBITDA | 14.9B | -101M |
| EBIT | 13.3B | -127M |
| Net Income | 5.54B | -117M |
| EPS | 5.06 | -2.84 |
| Fiscal Year | 2025 | 2025 |
Income Statement Interpretations
QUALCOMM Incorporated
QUALCOMM’s revenue showed a favorable growth trend from 2021 to 2025, increasing from $33.6B to $44.3B, with gross margins steady around 55%. Net income declined overall, from $9.0B in 2021 to $5.5B in 2025, reflecting a shrinking net margin to 12.5%. The 2025 year saw strong revenue and EBIT growth but a notable drop in net margin and EPS.
Ambarella, Inc.
Ambarella’s revenue increased favorably from $223M in 2021 to $285M in 2025, with gross margin remaining strong at 60.5%. Despite a rise in EBIT and net margin in the latest year, net income stayed negative at -$117M in 2025. The company showed improving profitability trends, yet net margins and EPS remained unfavorable overall.
Which one has the stronger fundamentals?
Both companies exhibit favorable revenue growth and strong gross margins, with 64.3% favorable income statement metrics. QUALCOMM’s scale and positive EBIT margins contrast with Ambarella’s persistent net losses and negative EBIT margin. Ambarella’s improving trends are offset by long-term net income declines, while QUALCOMM maintains higher absolute profitability despite recent margin pressures.
Financial Ratios Comparison
The table below presents a side-by-side comparison of key financial ratios for QUALCOMM Incorporated (QCOM) and Ambarella, Inc. (AMBA) based on their most recent fiscal year data.
| Ratios | QUALCOMM Incorporated (2025) | Ambarella, Inc. (2025) |
|---|---|---|
| ROE | 26.13% | -20.86% |
| ROIC | 13.19% | -21.96% |
| P/E | 32.70 | -27.05 |
| P/B | 8.54 | 5.64 |
| Current Ratio | 2.82 | 2.65 |
| Quick Ratio | 2.10 | 2.36 |
| D/E (Debt-to-Equity) | 0.70 | 0.0094 |
| Debt-to-Assets | 29.54% | 0.76% |
| Interest Coverage | 18.61 | 0 |
| Asset Turnover | 0.88 | 0.41 |
| Fixed Asset Turnover | 9.44 | 19.96 |
| Payout Ratio | 68.67% | 0 |
| Dividend Yield | 2.10% | 0 |
Interpretation of the Ratios
QUALCOMM Incorporated
QUALCOMM shows predominantly strong financial ratios with favorable net margin (12.51%), ROE (26.13%), and ROIC (13.19%), alongside a solid current ratio of 2.82 suggesting good liquidity. Some valuation metrics like P/E (32.7) and P/B (8.54) appear stretched, which may raise concerns. The company offers a dividend yielding 2.1%, supported by solid free cash flow, indicating a sustainable shareholder return.
Ambarella, Inc.
Ambarella exhibits weak profitability ratios with a negative net margin (-41.12%), ROE (-20.86%), and ROIC (-21.96%), reflecting operational challenges. Liquidity remains sound with a current ratio of 2.65, and a low debt level (debt to assets 0.76%). The firm does not pay dividends, likely due to ongoing losses and a focus on reinvestment and R&D, consistent with its high research-to-revenue ratio.
Which one has the best ratios?
Based on the evaluations, QUALCOMM presents a more favorable financial profile with higher profitability, better liquidity, and sustainable dividend payouts. Ambarella’s ratios highlight significant profitability weaknesses and lack of dividends, despite sound liquidity and low leverage. QUALCOMM’s overall ratio quality supports a stronger financial position compared to Ambarella’s unfavorable metrics.
Strategic Positioning
This section compares the strategic positioning of QUALCOMM Incorporated and Ambarella, Inc. based on market position, key segments, and exposure to technological disruption:
QUALCOMM Incorporated
- Leading global player in wireless semiconductors with strong scale and competitive pressure.
- Diversified segments: integrated circuits, licensing of wireless IP, and strategic investments.
- Exposure through investment in early-stage 5G, AI, automotive, and IoT; licensing business mitigates disruption.
Ambarella, Inc.
- Smaller market cap with higher volatility, operating in niche video semiconductor markets.
- Focused on video semiconductor solutions for automotive, security, and consumer markets.
- Relies on innovation in video processing and AI for automotive and security cameras amid evolving tech.
QUALCOMM Incorporated vs Ambarella, Inc. Positioning
QUALCOMM follows a diversified strategy with multiple revenue streams and broad technology investments, offering stability but facing intense competition. Ambarella’s concentrated focus on video semiconductor niches may allow agility but increases dependence on fewer markets.
Which has the best competitive advantage?
QUALCOMM shows a slightly favorable moat with value creation despite declining profitability, while Ambarella faces very unfavorable moat status, destroying value with decreasing returns, indicating lower competitive advantage based on MOAT evaluation.
Stock Comparison
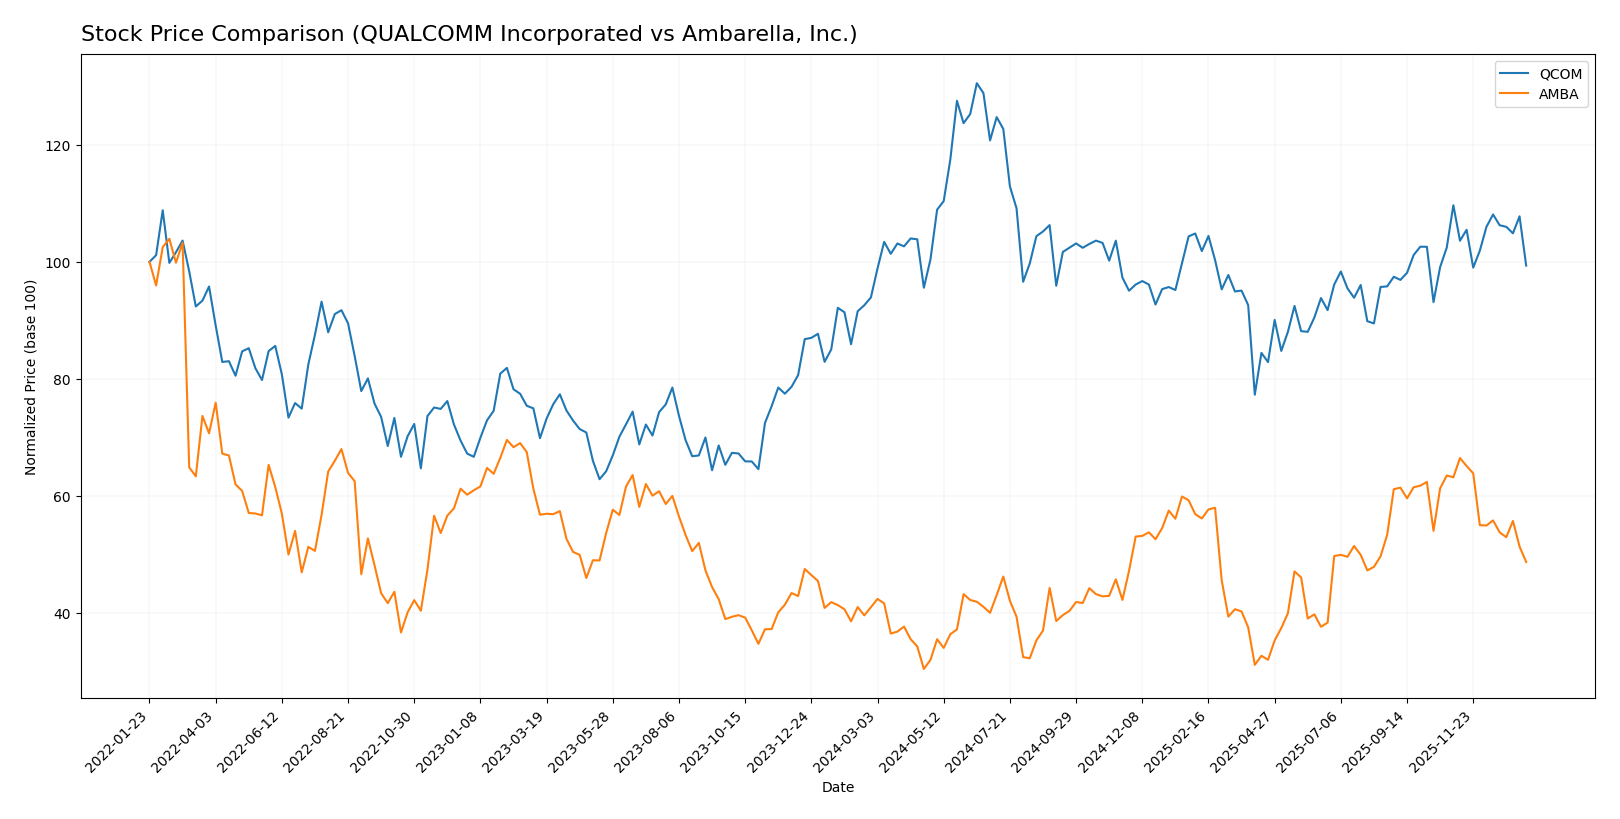
The stock price chart over the past 12 months highlights significant bullish trends for both QUALCOMM Incorporated and Ambarella, Inc., with notable price rallies and recent downward corrections shaping their trading dynamics.
Trend Analysis
QUALCOMM Incorporated’s stock showed a bullish trend with a 5.79% gain over the past year, accompanied by acceleration and a high volatility of 16.08. It reached a peak of 215.33 before recent modest declines.
Ambarella, Inc. experienced a stronger bullish trend, gaining 18.86% over the last 12 months despite decelerating momentum and lower volatility at 12.81. The stock hit a high of 89.67 but recently faced sharper declines.
Comparing both, Ambarella delivered the highest market performance with an 18.86% price increase versus QUALCOMM’s 5.79%, despite both encountering recent negative trends.
Target Prices
Analysts provide a positive target price consensus for these semiconductor companies, indicating potential upside from current levels.
| Company | Target High | Target Low | Consensus |
|---|---|---|---|
| QUALCOMM Incorporated | 210 | 165 | 185.71 |
| Ambarella, Inc. | 115 | 80 | 97.5 |
The consensus targets for QUALCOMM and Ambarella suggest upside potential of approximately 13% and 48% respectively compared to their current prices of $163.66 and $65.70. Analysts maintain an optimistic outlook on both stocks.
Analyst Opinions Comparison
This section compares analysts’ ratings and financial grades for QUALCOMM Incorporated (QCOM) and Ambarella, Inc. (AMBA):
Rating Comparison
QCOM Rating
- Rating: B+, indicating a very favorable overall evaluation.
- Discounted Cash Flow Score: 4, signaling a favorable valuation based on future cash flows.
- ROE Score: 5, very favorable efficiency in generating profit from equity.
- ROA Score: 5, very favorable asset utilization for earnings generation.
- Debt To Equity Score: 1, very unfavorable financial risk due to high leverage.
AMBA Rating
- Rating: C+, reflecting a very favorable overall evaluation.
- Discounted Cash Flow Score: 3, showing a moderate valuation outlook.
- ROE Score: 1, very unfavorable efficiency in generating profit from equity.
- ROA Score: 1, very unfavorable asset utilization for earnings generation.
- Debt To Equity Score: 4, favorable financial risk with lower reliance on debt.
Which one is the best rated?
Based strictly on the provided data, QCOM holds a higher overall rating (B+) and stronger ROE and ROA scores compared to AMBA. However, AMBA has a better debt-to-equity score, indicating lower financial risk. Overall, QCOM is better rated.
Scores Comparison
Here is a comparison of the Altman Z-Score and Piotroski Score for the two companies:
QUALCOMM Scores
- Altman Z-Score: 6.37, indicating a safe zone with low bankruptcy risk.
- Piotroski Score: 7, reflecting strong financial health and value.
Ambarella Scores
- Altman Z-Score: 10.69, indicating a safe zone with very low bankruptcy risk.
- Piotroski Score: 3, indicating very weak financial strength.
Which company has the best scores?
Ambarella has a higher Altman Z-Score, suggesting stronger bankruptcy safety, but QUALCOMM’s Piotroski Score is significantly higher, showing stronger financial health overall. The scores present mixed strengths for each company.
Grades Comparison
The following section presents the recent grades assigned to QUALCOMM Incorporated and Ambarella, Inc.:
QUALCOMM Incorporated Grades
This table summarizes recent grades and rating actions from well-known grading companies for QUALCOMM Incorporated.
| Grading Company | Action | New Grade | Date |
|---|---|---|---|
| Mizuho | Downgrade | Neutral | 2026-01-09 |
| Rosenblatt | Maintain | Buy | 2025-11-06 |
| B of A Securities | Maintain | Buy | 2025-11-06 |
| Mizuho | Maintain | Outperform | 2025-11-06 |
| Wells Fargo | Maintain | Underweight | 2025-11-06 |
| Piper Sandler | Maintain | Overweight | 2025-11-06 |
| UBS | Maintain | Neutral | 2025-11-06 |
| JP Morgan | Maintain | Overweight | 2025-11-04 |
| Citigroup | Maintain | Neutral | 2025-10-28 |
| Rosenblatt | Maintain | Buy | 2025-10-28 |
Overall, QUALCOMM shows a mix of Buy and Neutral ratings, with some Outperform and Overweight recommendations, indicating a generally favorable but cautious sentiment.
Ambarella, Inc. Grades
This table presents recent grades and rating actions from recognized grading companies for Ambarella, Inc.
| Grading Company | Action | New Grade | Date |
|---|---|---|---|
| B of A Securities | Maintain | Neutral | 2025-11-26 |
| Needham | Maintain | Buy | 2025-11-26 |
| Stifel | Maintain | Buy | 2025-11-26 |
| Rosenblatt | Maintain | Buy | 2025-11-26 |
| Rosenblatt | Maintain | Buy | 2025-11-24 |
| Stifel | Maintain | Buy | 2025-08-29 |
| Needham | Maintain | Buy | 2025-08-29 |
| Northland Capital Markets | Maintain | Outperform | 2025-08-29 |
| Morgan Stanley | Maintain | Overweight | 2025-08-29 |
| Oppenheimer | Maintain | Perform | 2025-08-29 |
Ambarella’s grades consistently show Buy and Outperform ratings, reflecting a strong positive consensus among analysts.
Which company has the best grades?
Ambarella, Inc. has received more consistent Buy and Outperform ratings compared to QUALCOMM Incorporated, which exhibits a broader range of Neutral and Buy grades. This pattern may influence investors differently in terms of perceived growth potential and risk exposure.
Strengths and Weaknesses
The table below summarizes the key strengths and weaknesses of QUALCOMM Incorporated (QCOM) and Ambarella, Inc. (AMBA) based on their recent financial and operational performance.
| Criterion | QUALCOMM Incorporated (QCOM) | Ambarella, Inc. (AMBA) |
|---|---|---|
| Diversification | Strong product diversification: QCT $38.4B, QTL $5.6B in 2025 | Limited diversification, focused on specialized chips |
| Profitability | Favorable net margin 12.51%, ROIC 13.19%, value creator | Negative net margin -41.12%, ROIC -21.96%, value destroyer |
| Innovation | Consistent innovation with high fixed asset turnover 9.44 | Innovation present but declining profitability |
| Global presence | Extensive global reach with stable revenue streams | Smaller scale and less global penetration |
| Market Share | Leading market share in mobile chipset industry | Niche player with limited market share |
Key takeaways: QUALCOMM demonstrates solid profitability, diversification, and global presence, though its profitability trend is slightly declining. Ambarella struggles with profitability and value creation, showing risks that warrant caution for investors.
Risk Analysis
Below is a comparative risk overview for QUALCOMM Incorporated (QCOM) and Ambarella, Inc. (AMBA) based on the most recent data from 2025.
| Metric | QUALCOMM Incorporated (QCOM) | Ambarella, Inc. (AMBA) |
|---|---|---|
| Market Risk | Beta 1.21 – moderate volatility | Beta 1.95 – high volatility |
| Debt level | Moderate debt-to-equity 0.7, debt/assets 29.54% | Very low debt-to-equity 0.01, debt/assets 0.76% |
| Regulatory Risk | Moderate, given global wireless licensing and patents | Moderate, exposure to diverse markets and automotive regulations |
| Operational Risk | Favorable operational efficiency and strong margins | Unfavorable margins and operational efficiency |
| Environmental Risk | Moderate; technology sector focus but limited direct impact | Low direct impact, but dependency on hardware manufacturing |
| Geopolitical Risk | Exposure to global supply chains and US government contracts | Exposure to global automotive and consumer markets |
The most impactful risks are market volatility for Ambarella due to its high beta and poor profitability, and Qualcomm’s regulatory and geopolitical risks related to its patent licensing and government contracts. Qualcomm’s strong financial health mitigates most risks, while Ambarella’s negative margins and weak financial scores heighten its operational and financial vulnerabilities.
Which Stock to Choose?
QUALCOMM Incorporated (QCOM) shows a favorable income evolution with a 13.66% revenue growth in 2025 and solid profitability metrics, despite some decline in net margin and EPS growth. Financial ratios are largely favorable, reflecting strong returns on equity (26.13%) and invested capital (13.19%), moderate debt levels, and a strong liquidity position. Its rating is very favorable with a B+ grade.
Ambarella, Inc. (AMBA) exhibits favorable revenue growth of 25.78% in 2025, but suffers from significant profitability challenges with negative net margin (-41.12%) and returns on equity (-20.86%). Financial ratios show mixed results, with strong liquidity and low debt but unfavorable profitability and efficiency metrics. The overall rating is moderate with a C+ grade.
Investors focused on value creation and financial stability may find QUALCOMM’s profile more favorable due to its consistent profitability, robust financial ratios, and strong rating. Conversely, those with a higher risk tolerance and growth-oriented strategies might interpret Ambarella’s recent revenue growth positively despite its profitability issues and unfavorable financial ratios.
Disclaimer: Investment carries a risk of loss of initial capital. The past performance is not a reliable indicator of future results. Be sure to understand risks before making an investment decision.
Go Further
I encourage you to read the complete analyses of QUALCOMM Incorporated and Ambarella, Inc. to enhance your investment decisions: