Home > Comparison > Consumer Cyclical > AMZN vs PDD
The strategic rivalry between Amazon.com, Inc. and PDD Holdings Inc. defines the current trajectory of the global specialty retail sector. Amazon operates as a capital-intensive giant with a vast global footprint spanning retail and cloud services. In contrast, PDD Holdings leverages a leaner, technology-driven e-commerce model focused on emerging markets. This analysis aims to identify which company’s strategy delivers superior risk-adjusted returns for diversified portfolios amid evolving consumer trends.

Table of contents
Companies Overview
Amazon.com, Inc. and PDD Holdings Inc. both command significant footprints in the global specialty retail sector.
Amazon.com, Inc.: Global E-commerce and Cloud Giant
Amazon dominates specialty retail through its diverse revenue streams, including North America, International sales, and its high-margin Amazon Web Services (AWS). Its core business combines retail sales, third-party seller programs, and technology products. In 2026, Amazon focuses on expanding AWS capabilities while integrating physical and digital retail for a seamless consumer experience.
PDD Holdings Inc.: Emerging Digital Commerce Powerhouse
PDD Holdings operates primarily through Pinduoduo and Temu, leveraging social and agricultural e-commerce to connect buyers and sellers in multiple product categories. Its revenue engine thrives on user engagement and marketplace growth across China and internationally. The company’s 2026 strategy concentrates on deepening digital economy integration and scaling its emerging online marketplace platforms.
Strategic Collision: Similarities & Divergences
Amazon and PDD share a consumer-centric retail focus but diverge sharply in business models: Amazon blends closed ecosystems with cloud services; PDD emphasizes an open, social-driven marketplace. Their battleground is expanding digital commerce globally, especially in emerging markets. Amazon’s scale and AWS moat contrast with PDD’s rapid user growth and niche market penetration, defining distinct risk-reward profiles for investors.
Income Statement Comparison
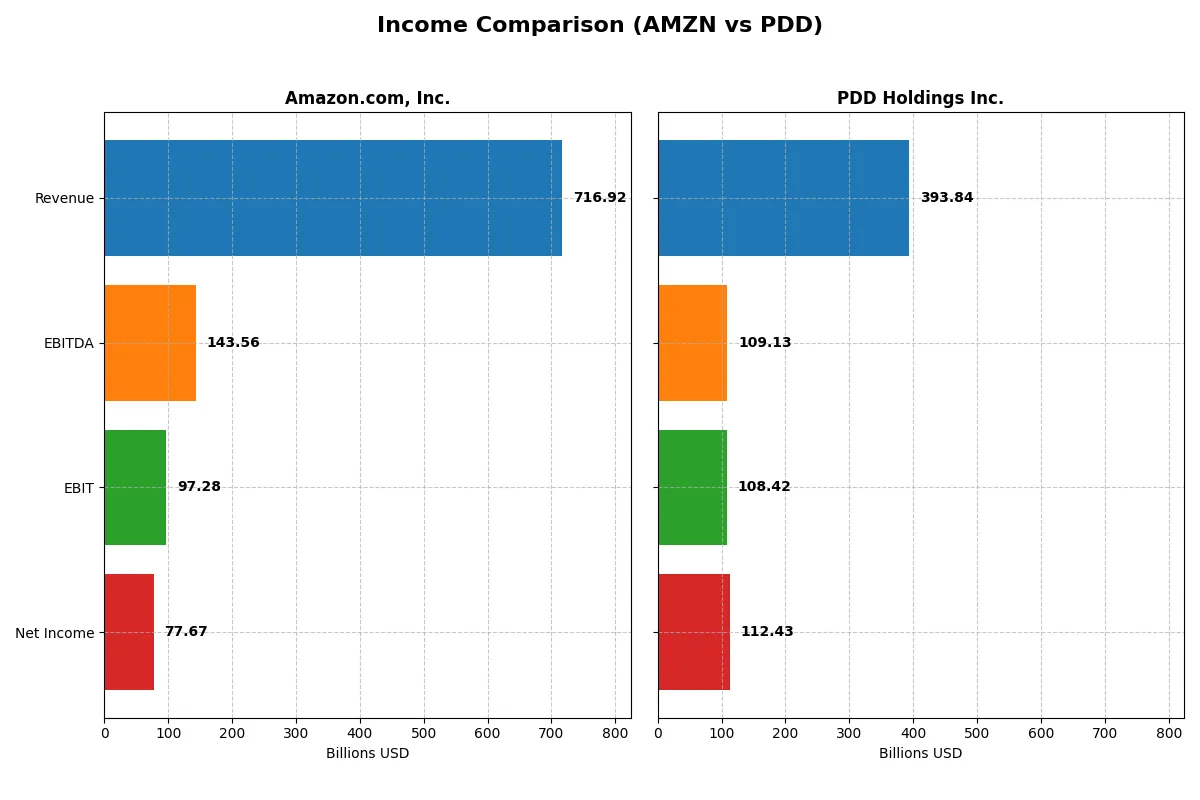
This data dissects the core profitability and scalability of both corporate engines to reveal who dominates the bottom line:
| Metric | Amazon.com, Inc. (AMZN) | PDD Holdings Inc. (PDD) |
|---|---|---|
| Revenue | 717B | 394B |
| Cost of Revenue | 356B | 154B |
| Operating Expenses | 281B | 132B |
| Gross Profit | 361B | 240B |
| EBITDA | 144B | 109B |
| EBIT | 97B | 108B |
| Interest Expense | 2.3B | 0 |
| Net Income | 77.7B | 112.4B |
| EPS | 7.29 | 81.24 |
| Fiscal Year | 2025 | 2024 |
Income Statement Analysis: The Bottom-Line Duel
This income statement comparison reveals the true efficiency and profitability of two major corporate engines in their most recent fiscal years.
Amazon.com, Inc. Analysis
Amazon’s revenue surged from $470B in 2021 to $717B in 2025, with net income rebounding from a loss in 2022 to $77.7B in 2025. Gross margin improved to 50.3%, while net margin expanded to 10.8%, signaling strong operational leverage. The 2025 jump in EBIT and EPS growth demonstrates robust momentum and effective cost control despite rising operating expenses.
PDD Holdings Inc. Analysis
PDD’s revenue exploded from CNY 59.5B in 2020 to CNY 394B in 2024, with net income soaring to CNY 112B. Its gross margin of 60.9% and net margin of 28.6% highlight exceptional profitability. The sharp growth across all profitability metrics in 2024, including EBIT rising 85%, reflects powerful operational efficiency and rapid scaling in a competitive e-commerce market.
Margin Power vs. Revenue Scale
PDD dominates with superior margins and explosive profit growth, outpacing Amazon’s more moderate but steady margin expansion and larger revenue base. Amazon offers scale and consistent margin improvement, while PDD impresses with raw profitability and growth velocity. For investors, PDD’s high-margin profile appeals to growth-focused portfolios; Amazon suits those favoring scale with improving efficiency.
Financial Ratios Comparison
These vital ratios act as a diagnostic tool to expose the underlying fiscal health, valuation premiums, and capital efficiency for Amazon.com, Inc. and PDD Holdings Inc.:
| Ratios | Amazon.com, Inc. (AMZN) | PDD Holdings Inc. (PDD) |
|---|---|---|
| ROE | 18.9% | 35.9% |
| ROIC | 10.7% | 28.4% |
| P/E | 31.8 | 8.7 |
| P/B | 6.0 | 3.1 |
| Current Ratio | 1.05 | 2.21 |
| Quick Ratio | 0.88 | 2.20 |
| D/E (Debt-to-Equity) | 0.37 | 0.03 |
| Debt-to-Assets | 18.7% | 2.1% |
| Interest Coverage | 35.2 | 0 |
| Asset Turnover | 0.88 | 0.78 |
| Fixed Asset Turnover | 2.01 | 66.3 |
| Payout Ratio | 0 | 0 |
| Dividend Yield | 0 | 0 |
| Fiscal Year | 2025 | 2024 |
Efficiency & Valuation Duel: The Vital Signs
Financial ratios serve as a company’s DNA, exposing hidden risks and revealing operational prowess that shapes investor confidence.
Amazon.com, Inc.
Amazon posts a solid ROE of 18.9% and a net margin of 10.8%, indicating efficient profitability. However, its P/E of 31.8 suggests the stock trades at a premium. Amazon refrains from dividends, instead reinvesting heavily in R&D (15% of revenue) to fuel growth and innovation, supporting long-term shareholder value.
PDD Holdings Inc.
PDD exhibits an impressive ROE of 35.9% and a net margin of 28.6%, reflecting strong operational efficiency. Its P/E ratio of 8.7 marks the stock as attractively valued. Despite no dividends, PDD maintains a robust balance sheet and reinvests cash flow to accelerate growth, with a current ratio of 2.21 signaling excellent liquidity.
Premium Valuation vs. Operational Efficiency
PDD offers superior profitability with a more attractive valuation and stronger liquidity than Amazon. Amazon’s premium multiples reflect market confidence in its growth but carry valuation risk. Investors favoring high operational returns and balance sheet strength may lean toward PDD, while those prioritizing innovation-led growth might consider Amazon’s profile.
Which one offers the Superior Shareholder Reward?
I observe that neither Amazon nor PDD pays dividends, focusing instead on reinvestment and buybacks. Amazon’s free cash flow per share is modest at 0.7 USD, while PDD boasts a robust 87 CNY, signaling stronger capital generation. Amazon’s payout ratio is zero, and its share buybacks have been limited recently. PDD also retains a zero dividend payout but demonstrates aggressive share repurchase capacity, supported by a high free cash flow yield and low debt. I conclude PDD’s distribution philosophy, underpinned by superior free cash flow and sustainable buybacks, offers a more attractive total shareholder return profile in 2026.
Comparative Score Analysis: The Strategic Profile
The radar chart reveals the fundamental DNA and trade-offs of Amazon.com, Inc. and PDD Holdings Inc., outlining their financial strengths and valuation dynamics:
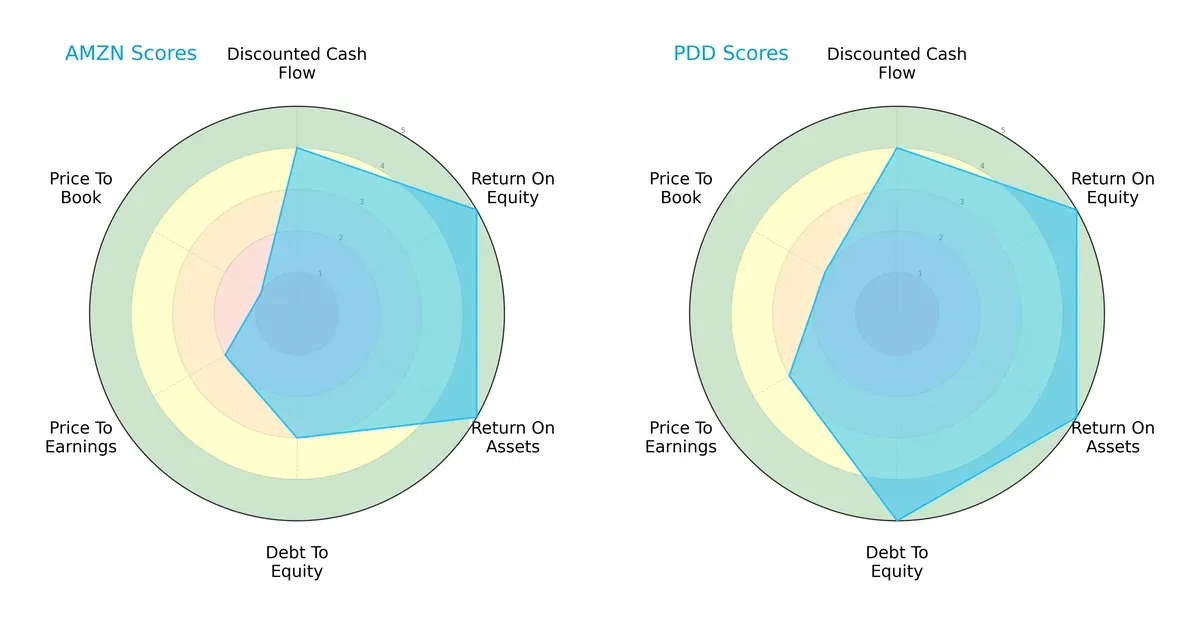
Both companies exhibit strong operational efficiency with top scores in ROE and ROA (5 each). PDD holds a distinct advantage in financial leverage with a debt-to-equity score of 5, signaling a robust balance sheet compared to Amazon’s moderate 3. Valuation metrics tilt in PDD’s favor as well, with slightly better P/E (3 vs. 2) and P/B scores (2 vs. 1). Amazon shows a more uneven profile, relying heavily on operational strength but burdened by less favorable valuation and leverage scores. PDD presents a more balanced and financially prudent profile for 2026 investors.
Bankruptcy Risk: Solvency Showdown
Amazon’s Altman Z-Score of 5.22 slightly exceeds PDD’s 5.10, placing both comfortably in the safe zone:
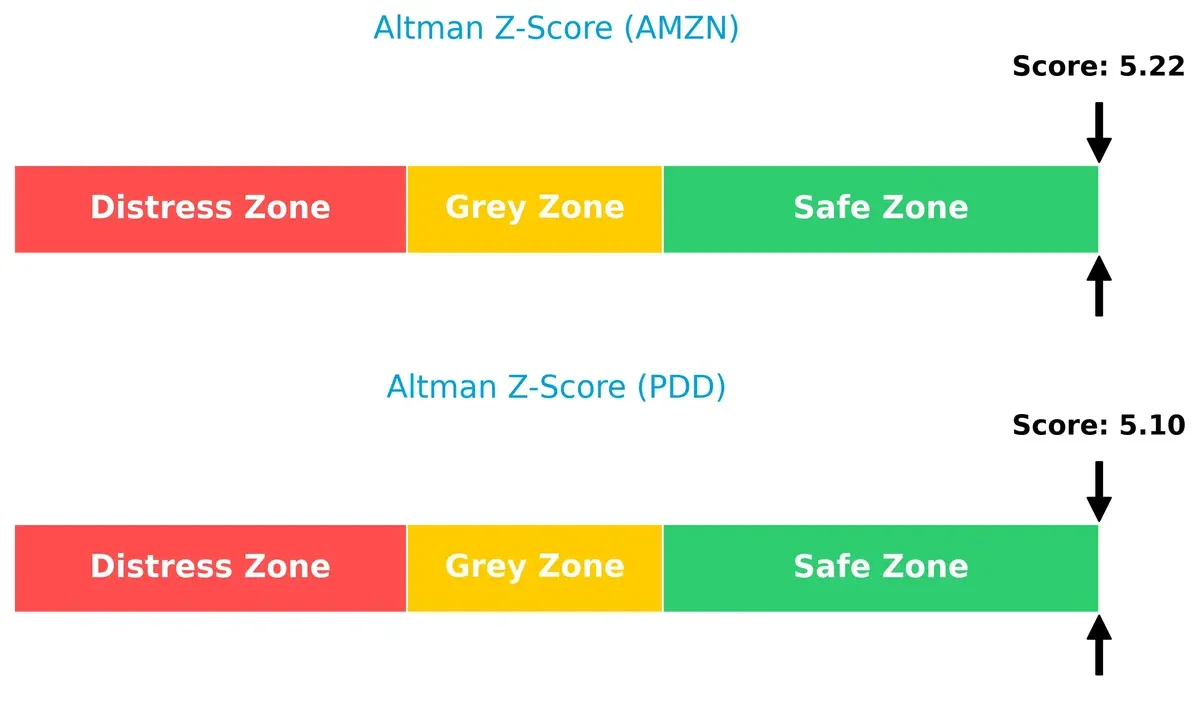
These scores indicate a low bankruptcy risk for either company, reflecting strong solvency and resilience amid current economic cycles.
Financial Health: Quality of Operations
PDD scores a 6 on the Piotroski F-Score, edging out Amazon’s 5, both landing in the average financial health range:
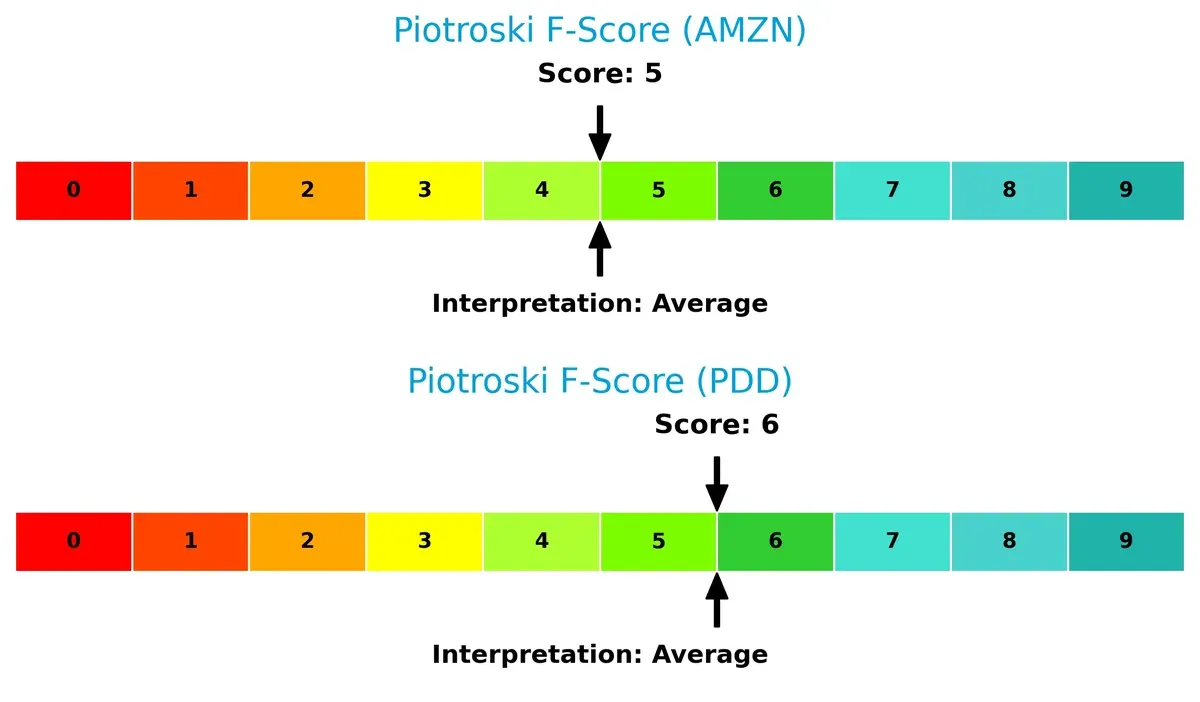
While neither firm shows red flags, PDD’s higher score suggests marginally stronger internal financial controls and operational quality. This subtle difference may influence risk-conscious investors seeking stability.
How are the two companies positioned?
This section dissects Amazon and PDD’s operational DNA by comparing their revenue distribution and internal dynamics, including strengths and weaknesses. The final goal is to confront their economic moats to identify which model delivers the most resilient, sustainable competitive advantage today.
Revenue Segmentation: The Strategic Mix
This visual comparison dissects how Amazon.com, Inc. and PDD Holdings Inc. diversify their income streams and where their primary sector bets lie:
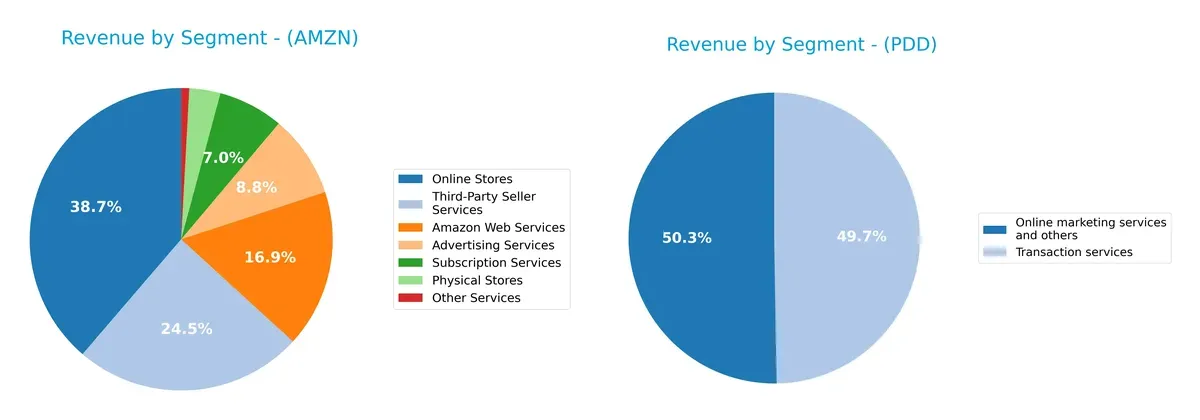
Amazon.com, Inc. displays a highly diversified revenue base, anchored by Online Stores at $247B and Third-Party Seller Services at $156B, with AWS contributing $108B. In contrast, PDD Holdings relies heavily on two nearly equal segments: Online Marketing Services and Transaction Services, both near 198B CNY. Amazon’s broad ecosystem reduces concentration risk, while PDD’s dual reliance suggests vulnerability but also a focused strategic bet on platform monetization.
Strengths and Weaknesses Comparison
This table compares the Strengths and Weaknesses of Amazon.com, Inc. and PDD Holdings Inc.:
Amazon.com, Inc. Strengths
- Diverse revenue streams including AWS, online stores, advertising, subscriptions, and third-party services
- Favorable profitability ratios with net margin 10.83% and ROE 18.89%
- Strong global presence with significant North America and European sales
PDD Holdings Inc. Strengths
- High profitability with net margin 28.55%, ROE 35.89%, and ROIC 28.35%
- Very favorable capital structure with low debt ratios and high interest coverage
- Lower valuation multiples with PE 8.71 indicating potential value
Amazon.com, Inc. Weaknesses
- Unfavorable valuation multiples with PE 31.83 and PB 6.01
- Neutral liquidity ratios indicating modest short-term financial flexibility
- No dividend yield for income investors
PDD Holdings Inc. Weaknesses
- Unfavorable PB ratio at 3.13 despite strong earnings
- Limited geographic diversification data compared to Amazon
- No dividend yield which may limit income appeal
Amazon’s strengths lie in its diversified business model and global scale, supporting resilience across market cycles. PDD excels in profitability and capital efficiency but shows less geographic transparency. Both companies face valuation and dividend yield challenges that investors should monitor closely.
The Moat Duel: Analyzing Competitive Defensibility
A structural moat is the fortress protecting long-term profits from competition’s relentless erosion. Let’s dissect the core competitive advantages of two retail giants:
Amazon.com, Inc.: Scale and Ecosystem Switching Costs
Amazon’s moat stems from its vast ecosystem and switching costs embedded in Prime membership and AWS services. This manifests in stable margins (13.6% EBIT) despite fierce competition. In 2026, expanding AWS and international markets could deepen its advantage, but rising costs risk margin pressure.
PDD Holdings Inc.: Rapid Growth and Cost Leadership
PDD’s moat centers on aggressive cost advantage and innovative social commerce, contrasting Amazon’s ecosystem lock-in. Its superior ROIC exceeds WACC by 23.7%, reflecting efficient capital use and margin expansion (28.6% net margin). Looking ahead, PDD’s rapid revenue growth (59% last year) and market penetration offer strong disruptive potential.
Verdict: Ecosystem Lock-In vs. Cost Leadership Scale
PDD holds the deeper moat with a wide ROIC-WACC gap and explosive growth, signaling superior value creation and capital efficiency. Amazon’s moat remains broad but shallower, relying on scale and ecosystem. PDD is better positioned to defend and expand market share amid evolving retail dynamics.
Which stock offers better returns?
The past year reveals Amazon.com, Inc. with a strong 20.58% price rise, decelerating but bullish, while PDD Holdings Inc. faces a 14.96% decline amid decelerating bearish momentum.
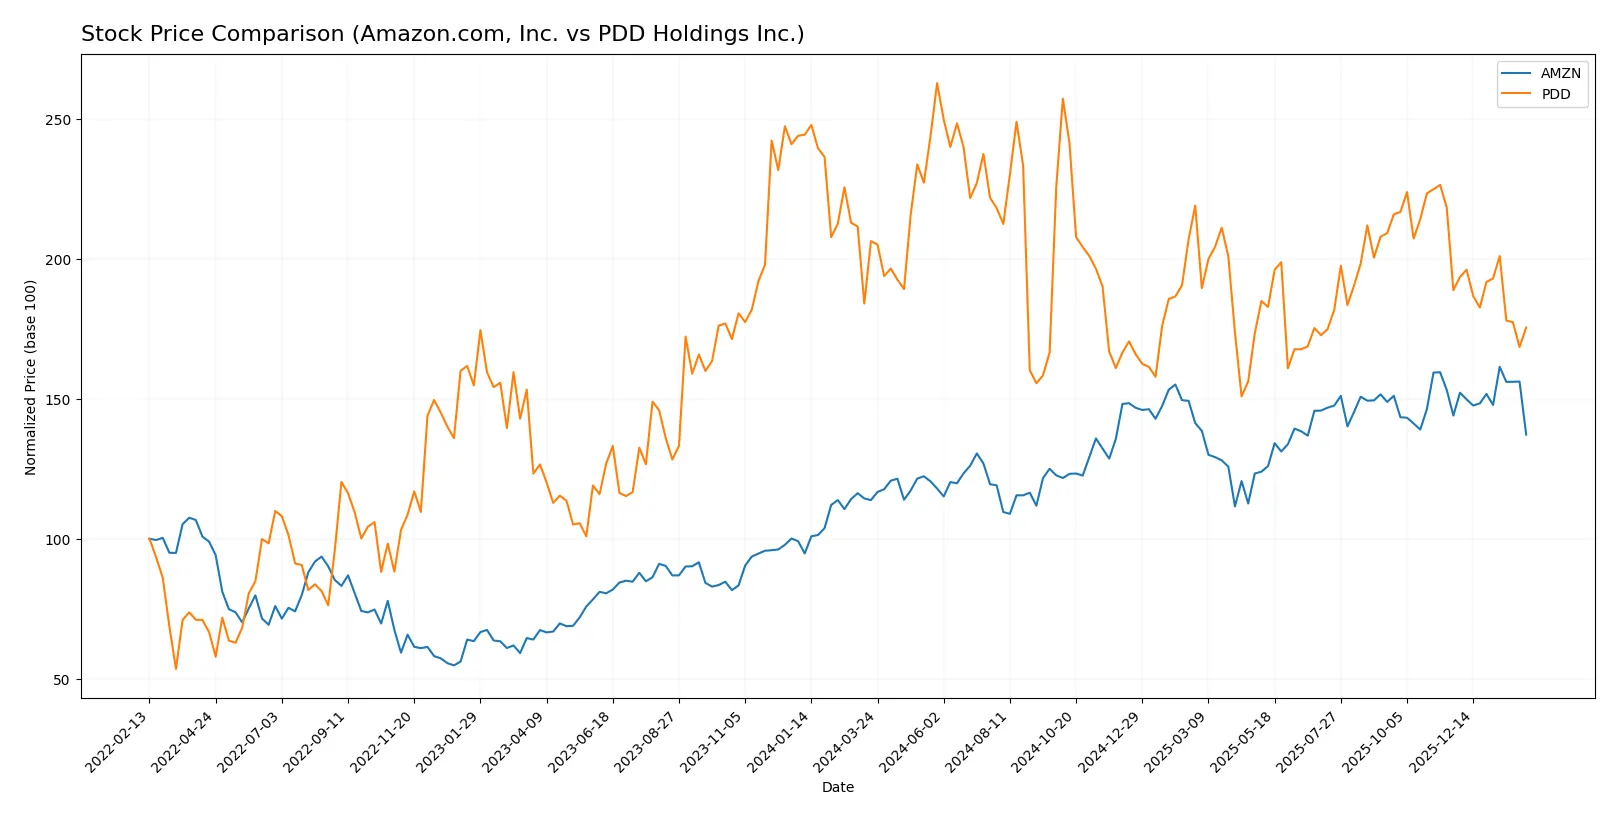
Trend Comparison
Amazon’s stock rose 20.58% over 12 months, showing a bullish trend with decelerating momentum and high volatility (21.86 std dev), peaking at 247.38 and bottoming at 166.94.
PDD’s stock fell 14.96% over the same period, marking a bearish trend with deceleration and moderate volatility (15.76 std dev), reaching a high of 157.57 and a low near 90.5.
Amazon outperformed PDD, delivering the highest market return while PDD’s share price declined, reflecting weaker investor confidence and volume trends.
Target Prices
Analysts present a moderate optimism for Amazon.com, Inc. and PDD Holdings Inc., with target consensus prices above current levels.
| Company | Target Low | Target High | Consensus |
|---|---|---|---|
| Amazon.com, Inc. | 175 | 315 | 283.86 |
| PDD Holdings Inc. | 120 | 170 | 147.38 |
Amazon’s target consensus at $283.86 exceeds its current $210.32 price, implying upside potential. PDD’s $147.38 consensus also suggests a meaningful valuation increase from $105.23.

Don’t Let Luck Decide Your Entry Point
Optimize your entry points with our advanced ProRealTime indicators. You’ll get efficient buy signals with precise price targets for maximum performance. Start outperforming now!
How do institutions grade them?
Amazon.com, Inc. Grades
Here are recent grades from reputable financial institutions for Amazon.com, Inc.:
| Grading Company | Action | New Grade | Date |
|---|---|---|---|
| BMO Capital | maintain | Outperform | 2026-02-06 |
| Oppenheimer | maintain | Outperform | 2026-02-06 |
| Wedbush | maintain | Outperform | 2026-02-06 |
| Evercore ISI Group | maintain | Outperform | 2026-02-06 |
| Argus Research | maintain | Buy | 2026-02-06 |
| Telsey Advisory Group | maintain | Outperform | 2026-02-06 |
| Piper Sandler | maintain | Overweight | 2026-02-06 |
| Citizens | maintain | Market Outperform | 2026-02-06 |
| RBC Capital | maintain | Outperform | 2026-02-06 |
| Wells Fargo | maintain | Overweight | 2026-02-06 |
PDD Holdings Inc. Grades
Below are recent grades from recognized financial firms for PDD Holdings Inc.:
| Grading Company | Action | New Grade | Date |
|---|---|---|---|
| Freedom Capital Markets | maintain | Buy | 2026-01-06 |
| B of A Securities | maintain | Neutral | 2025-11-19 |
| New Street Research | downgrade | Neutral | 2025-08-26 |
| B of A Securities | maintain | Neutral | 2025-08-26 |
| Barclays | maintain | Overweight | 2025-08-26 |
| Benchmark | maintain | Buy | 2025-08-26 |
| Benchmark | maintain | Buy | 2025-05-28 |
| JP Morgan | maintain | Neutral | 2025-05-28 |
| China Renaissance | downgrade | Hold | 2025-05-28 |
| Jefferies | maintain | Buy | 2025-05-27 |
Which company has the best grades?
Amazon.com, Inc. consistently earns Outperform and Buy ratings from top firms, signaling strong institutional confidence. PDD Holdings shows mixed grades, including downgrades to Neutral and Hold, indicating more cautious sentiment. Investors may perceive Amazon’s grades as stronger validation of growth prospects.
Risks specific to each company
The following categories identify the critical pressure points and systemic threats facing both firms in the 2026 market environment:
1. Market & Competition
Amazon.com, Inc.
- Faces intense global retail competition and margin pressure despite strong AWS growth.
PDD Holdings Inc.
- Operates in a highly competitive Chinese e-commerce market with rising domestic and international rivals.
2. Capital Structure & Debt
Amazon.com, Inc.
- Moderate leverage with debt-to-assets at 18.7% and strong interest coverage of 42.78x.
PDD Holdings Inc.
- Very low leverage; debt-to-assets at 2.1% and infinite interest coverage, indicating financial stability.
3. Stock Volatility
Amazon.com, Inc.
- Beta at 1.385 signals higher volatility relative to the market.
PDD Holdings Inc.
- Near-zero beta (-0.014) indicates low correlation and less volatility versus the market.
4. Regulatory & Legal
Amazon.com, Inc.
- Subject to US and international antitrust scrutiny and data privacy regulations.
PDD Holdings Inc.
- Faces Chinese regulatory tightening and international trade restrictions impacting growth.
5. Supply Chain & Operations
Amazon.com, Inc.
- Complex global supply chain vulnerable to disruptions and rising logistics costs.
PDD Holdings Inc.
- Supply chain risks tied to Chinese manufacturing and cross-border logistics for Temu marketplace.
6. ESG & Climate Transition
Amazon.com, Inc.
- High carbon footprint with ongoing investments in renewable energy and sustainability goals.
PDD Holdings Inc.
- Emerging ESG focus but less mature climate transition strategy compared to global peers.
7. Geopolitical Exposure
Amazon.com, Inc.
- Exposure to US-China tensions impacting international operations and supply chains.
PDD Holdings Inc.
- Significant geopolitical risk from US-China relations and potential export restrictions.
Which company shows a better risk-adjusted profile?
Amazon’s primary risk lies in regulatory and market competition pressures in mature markets. PDD’s largest risk is geopolitical exposure, which threatens its cross-border expansion and supply chain. PDD’s very low leverage and favorable financial ratios suggest a stronger risk-adjusted profile. However, Amazon’s diversified business segments and robust capital structure provide resilience. Recent data show PDD’s near-zero beta and minimal debt as distinct advantages amid current market volatility.
Final Verdict: Which stock to choose?
Amazon’s superpower lies in its relentless scale and operational efficiency, driving consistent revenue and profit growth. Its slightly stretched valuation and modest liquidity ratios call for vigilance. Amazon fits well in portfolios seeking aggressive growth with a tolerance for premium pricing and cyclical market pressures.
PDD Holdings commands a robust strategic moat through its razor-thin capital intensity and superior return on invested capital, signaling a durable competitive advantage. Its strong balance sheet offers better financial safety relative to Amazon. PDD suits investors looking for growth at a reasonable price with solid cash flow generation.
If you prioritize aggressive growth and are comfortable with a premium valuation, Amazon’s market dominance and improving profitability make it a compelling choice. However, if you seek better stability and a stronger moat with attractive earnings yield, PDD offers superior value creation at a more reasonable price point. Both present analytical scenarios worth consideration depending on your risk appetite and investment horizon.
Disclaimer: Investment carries a risk of loss of initial capital. The past performance is not a reliable indicator of future results. Be sure to understand risks before making an investment decision.
Go Further
I encourage you to read the complete analyses of Amazon.com, Inc. and PDD Holdings Inc. to enhance your investment decisions: