Home > Comparison > Technology > MSFT vs AKAM
The strategic rivalry between Microsoft Corporation and Akamai Technologies defines the current trajectory of the software infrastructure sector. Microsoft operates as a diversified technology powerhouse, blending cloud, productivity, and personal computing. Akamai specializes in cloud security and content delivery, focusing on internet performance optimization. This head-to-head contrasts scale and diversification against niche expertise. This analysis will determine which business model offers superior risk-adjusted potential for a diversified portfolio in 2026.
Table of contents
Companies Overview
Microsoft and Akamai hold pivotal roles in the software infrastructure market, shaping cloud and internet security landscapes.
Microsoft Corporation: Global Software Infrastructure Titan
Microsoft dominates software infrastructure with a diverse revenue base spanning cloud computing, productivity tools, and personal computing devices. Its strategic focus in 2026 emphasizes expanding Azure cloud services and integrating AI-driven enterprise solutions. Microsoft leverages its vast ecosystem, including Office 365 and LinkedIn, to maintain a competitive edge in software licensing and cloud adoption.
Akamai Technologies, Inc.: Internet Security and Performance Specialist
Akamai specializes in cloud services that secure and optimize content delivery over the internet. Its revenue primarily comes from cybersecurity, media delivery, and edge computing solutions. In 2026, Akamai concentrates on enhancing edge compute capabilities and expanding cybersecurity offerings, aiming to protect infrastructure and improve digital experiences for global enterprises and developers.
Strategic Collision: Similarities & Divergences
Both companies operate within software infrastructure but diverge sharply in philosophy. Microsoft pursues a broad platform ecosystem integrating cloud, productivity, and devices, while Akamai focuses narrowly on edge security and content delivery. Their primary battleground lies in cloud infrastructure and security services. Microsoft’s scale and diversification contrast with Akamai’s specialized niche, creating distinct risk and growth profiles for investors.
Income Statement Comparison
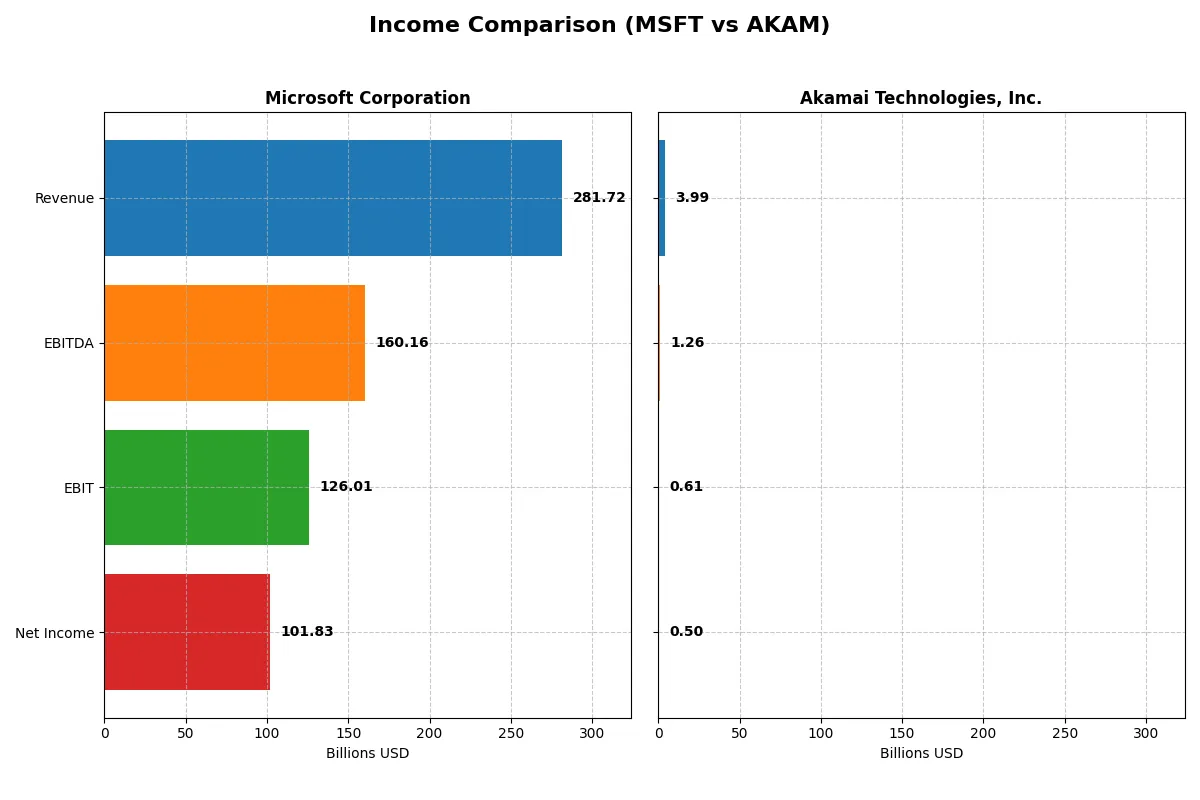
The following data dissects the core profitability and scalability of both corporate engines to reveal who dominates the bottom line:
| Metric | Microsoft Corporation (MSFT) | Akamai Technologies, Inc. (AKAM) |
|---|---|---|
| Revenue | 282B | 4B |
| Cost of Revenue | 88B | 1.62B |
| Operating Expenses | 65.4B | 1.84B |
| Gross Profit | 194B | 2.37B |
| EBITDA | 160.2B | 1.26B |
| EBIT | 126B | 614M |
| Interest Expense | 2.39B | 27M |
| Net Income | 101.8B | 505M |
| EPS | 13.7 | 3.34 |
| Fiscal Year | 2025 | 2024 |
Income Statement Analysis: The Bottom-Line Duel
This income statement comparison reveals which company converts revenue into profit most efficiently, exposing the engine strength behind each corporate giant.
Microsoft Corporation Analysis
Microsoft’s revenue surged from 168B in 2021 to 282B in 2025, with net income growing from 61B to 102B. Gross margins hold robust at nearly 69%, and net margins remain strong around 36%. In 2025, Microsoft maintained momentum with double-digit revenue and EBIT growth, reflecting operational excellence and disciplined cost management.
Akamai Technologies, Inc. Analysis
Akamai’s revenue rose modestly from 3.2B in 2020 to 4.0B in 2024, but net income declined from 557M to 505M. Gross margin stands at a healthy 59%, yet net margin lags at 12.6%. The latest year showed shrinking EBIT and net margin, signaling pressure on profitability and operational efficiency despite slight revenue gains.
Verdict: Market Scale vs. Margin Durability
Microsoft outpaces Akamai decisively with superior revenue scale and margin durability. Microsoft’s 36% net margin dwarfs Akamai’s 12.6%, underscoring better cost control and capital allocation. For investors, Microsoft’s high-growth, high-profit profile presents a stronger fundamental case than Akamai’s challenged margin and profit trends.
Financial Ratios Comparison
These vital ratios act as a diagnostic tool to expose the underlying fiscal health, valuation premiums, and capital efficiency of each company analyzed:
| Ratios | Microsoft Corporation (MSFT) | Akamai Technologies, Inc. (AKAM) |
|---|---|---|
| ROE | 29.6% | 10.4% |
| ROIC | 22.0% | 4.7% |
| P/E | 36.3 | 28.7 |
| P/B | 10.8 | 3.0 |
| Current Ratio | 1.35 | 1.23 |
| Quick Ratio | 1.35 | 1.23 |
| D/E (Debt-to-Equity) | 0.18 | 0.95 |
| Debt-to-Assets | 9.8% | 44.7% |
| Interest Coverage | 53.9 | 19.7 |
| Asset Turnover | 0.46 | 0.38 |
| Fixed Asset Turnover | 1.23 | 1.33 |
| Payout Ratio | 23.6% | 0% |
| Dividend Yield | 0.65% | 0% |
| Fiscal Year | 2025 | 2024 |
Efficiency & Valuation Duel: The Vital Signs
Financial ratios serve as a company’s DNA, exposing hidden risks and revealing operational excellence critical for investors’ decisions.
Microsoft Corporation
Microsoft shows robust profitability with a 29.65% ROE and a strong 36.15% net margin, signaling efficient operations. However, its valuation appears stretched, with a P/E of 36.31 and a P/B of 10.76. Shareholders receive a modest 0.65% dividend yield, while the company reinvests heavily in R&D for sustained growth.
Akamai Technologies, Inc.
Akamai posts a modest 10.35% ROE and a 12.65% net margin, reflecting moderate efficiency. Its valuation, though lower than Microsoft’s, remains elevated with a P/E of 28.68 and neutral P/B of 2.97. The company pays no dividend, focusing instead on reinvestment, albeit with a weaker 4.74% ROIC that signals limited capital efficiency.
Premium Valuation vs. Operational Safety
Microsoft commands a premium valuation but delivers superior returns on equity and invested capital, reflecting operational excellence. Akamai offers a cheaper valuation but weaker profitability and reinvestment efficiency. Investors seeking growth and quality may lean toward Microsoft, while those prioritizing valuation might consider Akamai’s neutral risk profile.
Which one offers the Superior Shareholder Reward?
I compare Microsoft and Akamai’s shareholder return strategies. Microsoft pays a modest dividend yield of ~0.65% with a sustainable payout ratio near 24%, backed by strong free cash flow (9.6B per share) and robust buyback programs. Akamai pays no dividends, instead reinvesting cash flow (~5.5B per share) into growth and acquisitions, but its higher debt load and weaker free cash flow coverage raise risks. Microsoft’s consistent dividend plus aggressive buybacks offer a more balanced and sustainable total return. I conclude Microsoft provides the superior shareholder reward in 2026.
Comparative Score Analysis: The Strategic Profile
The radar chart reveals the fundamental DNA and trade-offs of Microsoft Corporation and Akamai Technologies, highlighting their distinct financial strengths and weaknesses:
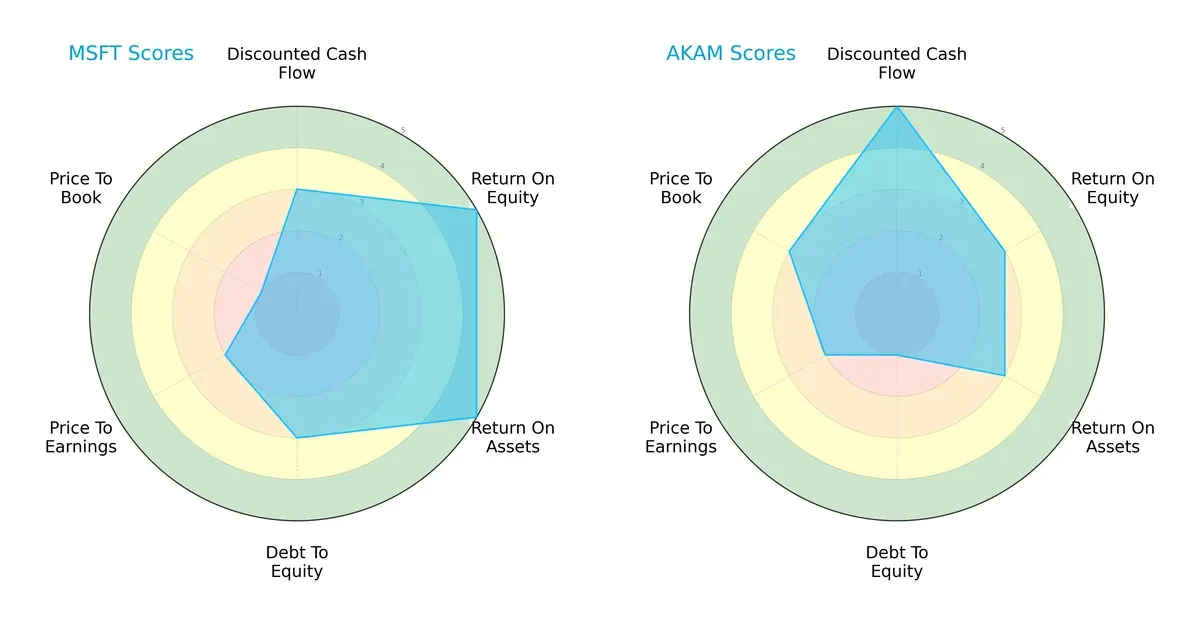
Microsoft shows superior returns with very favorable ROE and ROA scores (5 each), reflecting efficient capital use and asset management. Akamai excels in discounted cash flow valuation (score of 5), suggesting strong future cash generation potential. However, Microsoft maintains a more balanced profile overall, with moderate debt-to-equity (3) and valuation scores, while Akamai’s low debt-to-equity score (1) signals higher financial risk. Akamai relies on its DCF strength but lags in profitability metrics compared to Microsoft.
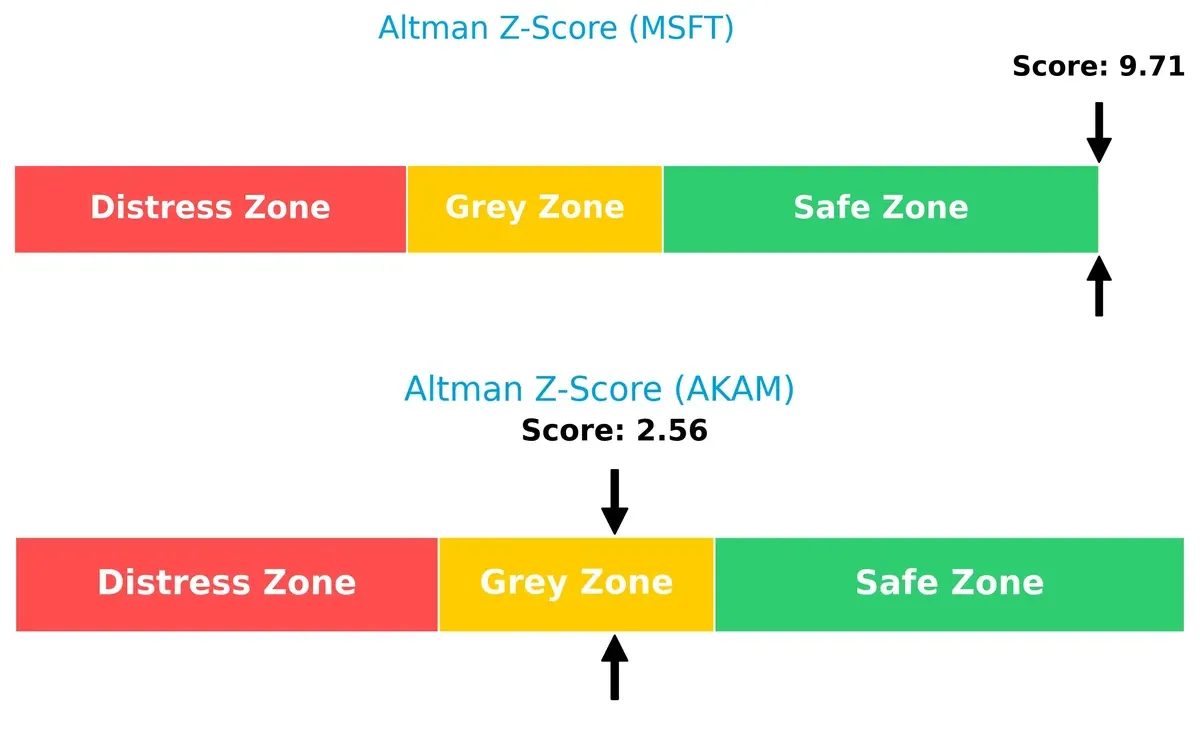
Bankruptcy Risk: Solvency Showdown
Microsoft’s Altman Z-Score of 9.7 places it comfortably in the safe zone, indicating robust long-term solvency. Akamai’s 2.56 score sits in the grey zone, signaling moderate bankruptcy risk in this market cycle:
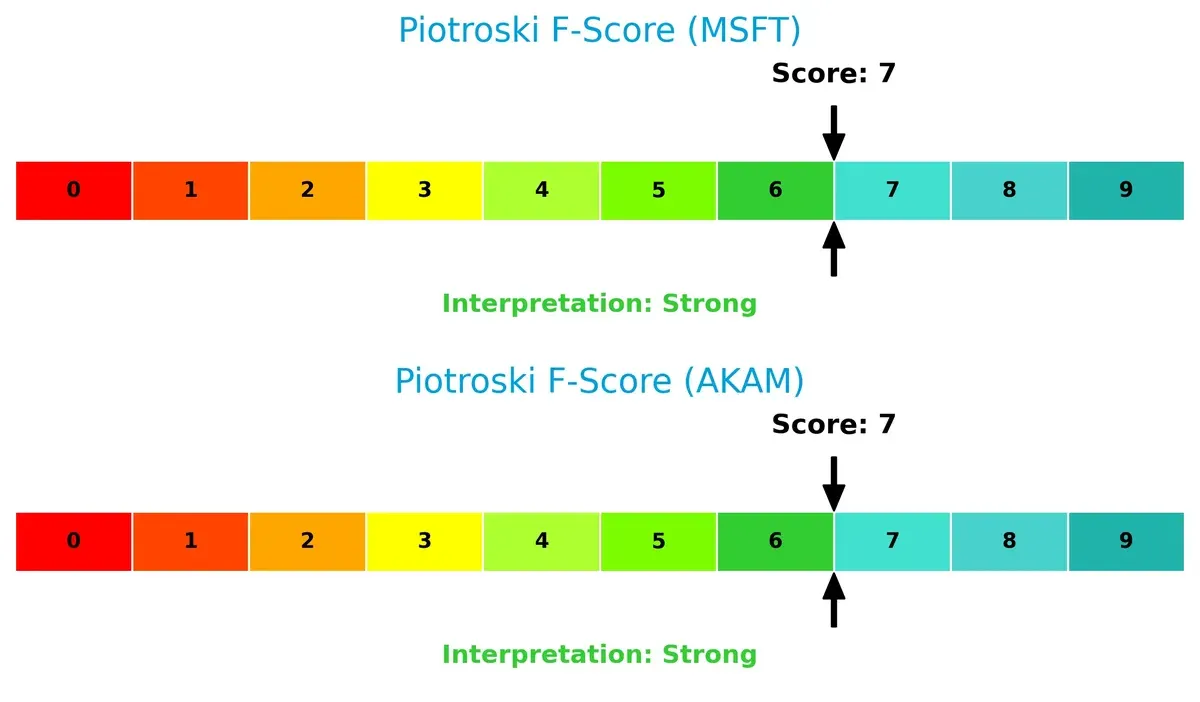
Financial Health: Quality of Operations
Both firms score a solid 7 on the Piotroski F-Score, denoting strong financial health. Neither exhibits red flags in profitability, leverage, or liquidity metrics, confirming operational quality:
How are the two companies positioned?
This section dissects the operational DNA of Microsoft and Akamai by comparing their revenue distribution by segment and internal strengths and weaknesses. The goal is to confront their economic moats and identify which model delivers the most resilient, sustainable advantage today.
Revenue Segmentation: The Strategic Mix
This visual comparison dissects how Microsoft Corporation and Akamai Technologies diversify their income streams and where their primary sector bets lie:
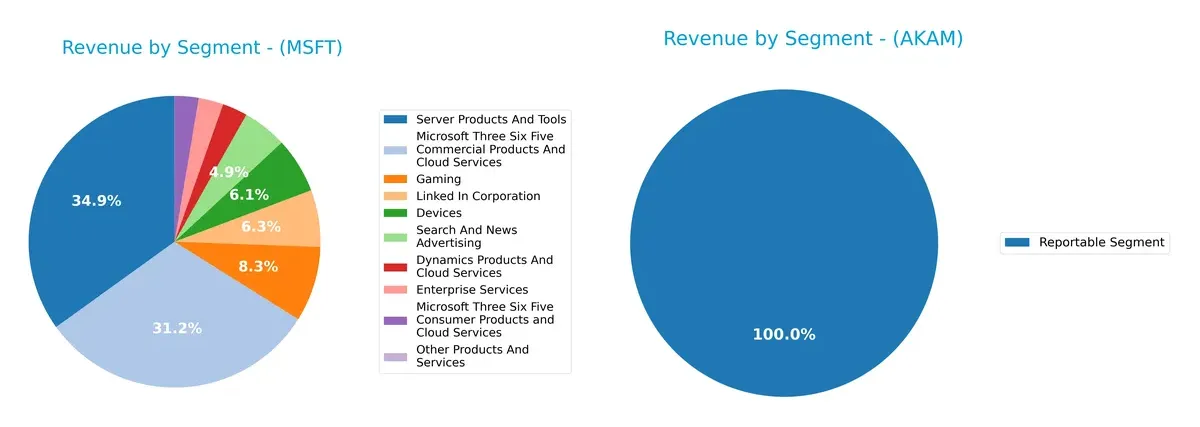
Microsoft dominates with a broad portfolio spanning 10+ significant segments, including Server Products ($98.4B) and Microsoft 365 Commercial ($87.8B). Akamai relies solely on a single reported segment ($3.99B), indicating less diversification. Microsoft’s mix anchors its ecosystem lock-in and infrastructure strength, while Akamai’s concentration signals higher dependence on its core network services, exposing it to sector-specific risks in 2024.
Strengths and Weaknesses Comparison
This table compares the Strengths and Weaknesses of Microsoft Corporation and Akamai Technologies, Inc.:
Microsoft Strengths
- Highly diversified product portfolio across cloud, enterprise, gaming, and devices
- Strong global presence with $137B non-US and $145B US revenue
- Favorable profitability with 36% net margin and 22% ROIC
- Robust financial health with low debt and strong interest coverage
- Innovation visible in cloud and software services growth
Akamai Strengths
- Focused revenue stream with stable $4B segment revenue
- Favorable net margin of 12.65% and interest coverage ratio
- Adequate liquidity with neutral current and favorable quick ratios
- Balanced debt profile with neutral leverage ratios
- Solid US and international sales near $2B each, showing global reach
Microsoft Weaknesses
- High valuation multiples with unfavorable PE of 36.3 and PB of 10.8
- Unfavorable asset turnover at 0.46 indicating lower asset efficiency
- Dividend yield is low at 0.65%, less attractive for income investors
Akamai Weaknesses
- Low ROIC at 4.74% below WACC of 6.14% signals weak capital efficiency
- Unfavorable dividend yield at 0%, no income for shareholders
- Asset turnover also low at 0.38, suggesting operational challenges
Microsoft’s strengths lie in its scale, diversification, and strong profitability, which support a resilient business model. Akamai’s strengths focus on stable profitability and global sales but face capital efficiency and valuation challenges. Each company’s weaknesses highlight areas for strategic focus in improving asset use and shareholder returns.
The Moat Duel: Analyzing Competitive Defensibility
A structural moat is the only reliable barrier protecting long-term profits from relentless competitive erosion:
Microsoft Corporation: Ecosystem Lock-in and Intangible Assets
Microsoft’s moat stems from its vast ecosystem and strong intangible assets like Office 365 and Azure. This manifests in a high ROIC with stable margins near 45%. In 2026, expanding cloud and AI services could deepen its competitive edge.
Akamai Technologies, Inc.: Niche Cost Advantage and Security Focus
Akamai relies on cost-efficient content delivery and cybersecurity solutions. Its moat is narrower, reflected in lower ROIC and declining profitability versus Microsoft. Growth opportunities exist in edge computing, but margin pressure persists.
Moat Battle: Ecosystem Dominance vs. Specialized Cost Efficiency
Microsoft holds the deeper moat with a ROIC well above WACC, consistently creating value. Akamai’s shrinking ROIC signals a fragile moat. Microsoft is clearly better positioned to defend and expand market share in 2026.
Which stock offers better returns?
The past year reveals contrasting price dynamics: Microsoft gained 5.93% but slowed recently, while Akamai lost 12.48% overall yet accelerated upward late in the period.
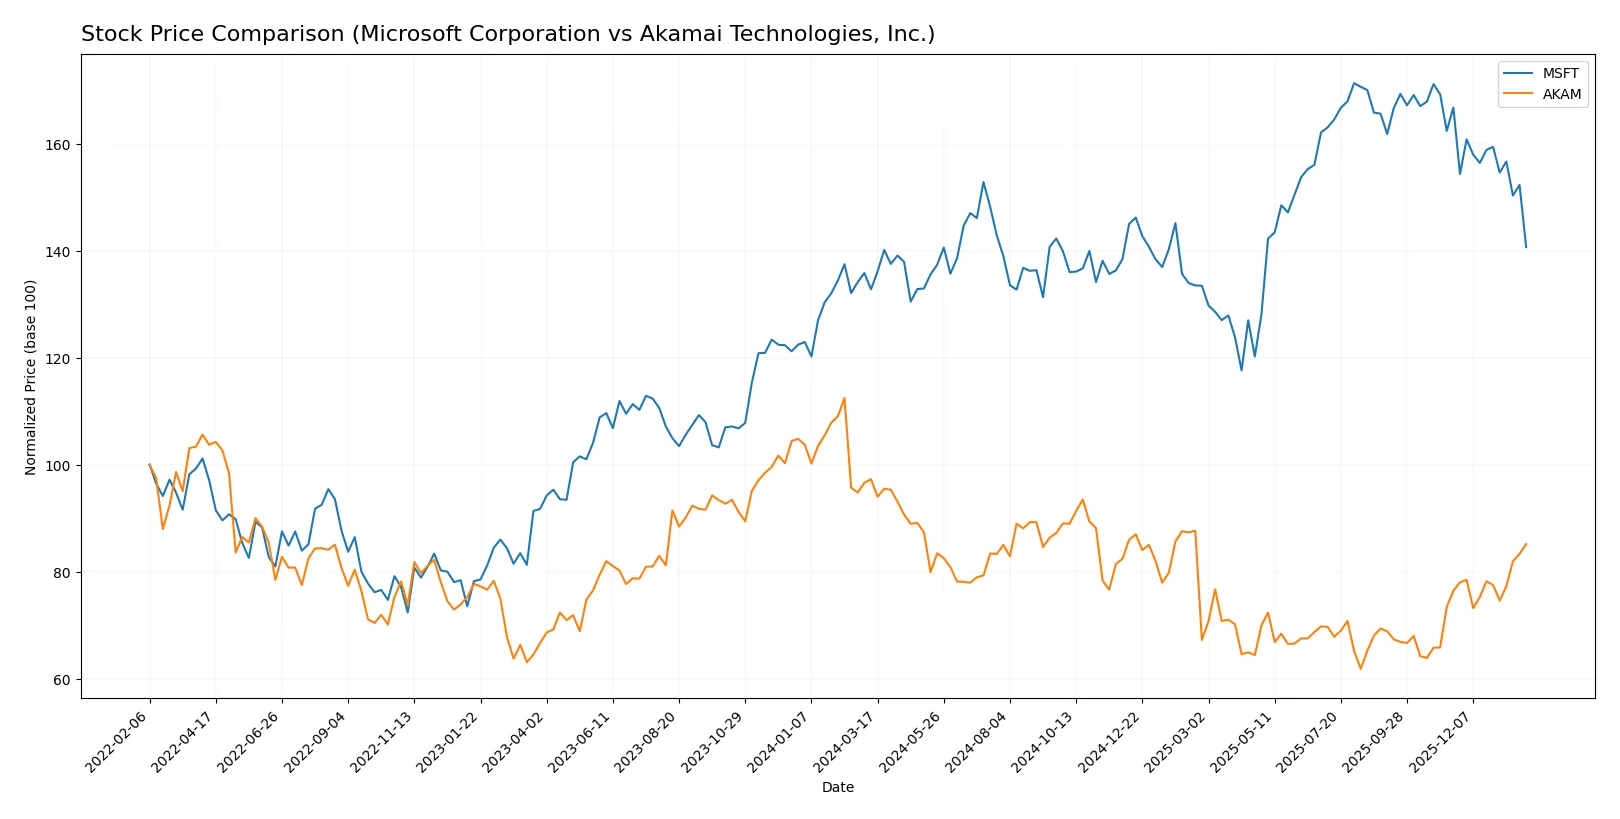
Trend Comparison
Microsoft’s stock shows a 5.93% gain over 12 months, marking a bullish trend with decelerating momentum. Prices ranged between 359.84 and 524.11, with high volatility at 41.93 standard deviation.
Akamai’s stock declined 12.48% over the same period, reflecting a bearish trend but with accelerating recovery recently, gaining 11.45% in the last 2.5 months. Volatility remains moderate at 10.59 standard deviation.
Microsoft outperformed Akamai in total returns despite recent weakness. Akamai’s recent rally narrows the gap, but Microsoft leads in market performance over the past year.
Target Prices
Analysts present a bullish consensus for both Microsoft Corporation and Akamai Technologies, signaling strong upside potential.
| Company | Target Low | Target High | Consensus |
|---|---|---|---|
| Microsoft Corporation | 450 | 675 | 604.08 |
| Akamai Technologies, Inc. | 89 | 115 | 104.8 |
Microsoft’s target consensus at 604.08 implies a 40% premium to its current 430.29 price, reflecting robust confidence in its cloud and software dominance. Akamai’s consensus target of 104.8 also suggests upside from 97.15, indicating moderate growth expectations.

Don’t Let Luck Decide Your Entry Point
Optimize your entry points with our advanced ProRealTime indicators. You’ll get efficient buy signals with precise price targets for maximum performance. Start outperforming now!
How do institutions grade them?
Microsoft Corporation Grades
The following table summarizes recent grades from major financial institutions for Microsoft Corporation:
| Grading Company | Action | New Grade | Date |
|---|---|---|---|
| Citigroup | Maintain | Buy | 2026-01-30 |
| Wells Fargo | Maintain | Overweight | 2026-01-29 |
| Wedbush | Maintain | Outperform | 2026-01-29 |
| Scotiabank | Maintain | Sector Outperform | 2026-01-29 |
| RBC Capital | Maintain | Outperform | 2026-01-29 |
| Stifel | Maintain | Buy | 2026-01-29 |
| Evercore ISI Group | Maintain | Outperform | 2026-01-29 |
| Keybanc | Maintain | Overweight | 2026-01-29 |
| Piper Sandler | Maintain | Overweight | 2026-01-29 |
| Cantor Fitzgerald | Maintain | Overweight | 2026-01-29 |
Akamai Technologies, Inc. Grades
The following table summarizes recent grades from major financial institutions for Akamai Technologies, Inc.:
| Grading Company | Action | New Grade | Date |
|---|---|---|---|
| Citigroup | Maintain | Neutral | 2026-01-16 |
| Morgan Stanley | Upgrade | Overweight | 2026-01-12 |
| Scotiabank | Maintain | Sector Outperform | 2026-01-09 |
| RBC Capital | Maintain | Sector Perform | 2026-01-05 |
| Piper Sandler | Maintain | Neutral | 2026-01-05 |
| Keybanc | Upgrade | Overweight | 2025-12-15 |
| TD Cowen | Maintain | Hold | 2025-11-13 |
| Citigroup | Maintain | Neutral | 2025-11-11 |
| Scotiabank | Maintain | Sector Outperform | 2025-11-07 |
| Piper Sandler | Maintain | Neutral | 2025-11-07 |
Which company has the best grades?
Microsoft consistently receives strong buy and outperform ratings from top-tier institutions, reflecting broad confidence. Akamai’s grades are more mixed, with several neutral and sector perform ratings. Investors may view Microsoft’s grades as signaling stronger institutional endorsement and potential stability.
Risks specific to each company
The following categories identify the critical pressure points and systemic threats facing both firms in the 2026 market environment:
1. Market & Competition
Microsoft Corporation
- Dominates cloud and software markets but faces intense competition from peers and rapid tech innovation.
Akamai Technologies, Inc.
- Competes in niche cloud security and delivery with pressure from larger cloud providers expanding services.
2. Capital Structure & Debt
Microsoft Corporation
- Low debt-to-equity ratio (0.18) signals conservative leverage and strong financial flexibility.
Akamai Technologies, Inc.
- High debt-to-equity ratio (0.95) raises financial risk and limits capital allocation flexibility.
3. Stock Volatility
Microsoft Corporation
- Beta of 1.07 indicates volatility slightly above market average, reflecting tech sector cyclicality.
Akamai Technologies, Inc.
- Lower beta of 0.69 shows less sensitivity to market swings, offering relative stability.
4. Regulatory & Legal
Microsoft Corporation
- Subject to global antitrust scrutiny and data privacy regulations that could impact business operations.
Akamai Technologies, Inc.
- Faces cybersecurity compliance demands and potential liability from service disruptions or breaches.
5. Supply Chain & Operations
Microsoft Corporation
- Complex global hardware and software supply chain vulnerable to geopolitical and logistical disruptions.
Akamai Technologies, Inc.
- Operational reliance on internet infrastructure and data centers exposes it to network failures and latency issues.
6. ESG & Climate Transition
Microsoft Corporation
- Leading ESG initiatives with strong commitments to carbon neutrality and sustainable operations.
Akamai Technologies, Inc.
- ESG efforts improving but less visible scale and impact compared to larger peers.
7. Geopolitical Exposure
Microsoft Corporation
- Global footprint exposes it to trade tensions, sanctions, and regional regulatory shifts.
Akamai Technologies, Inc.
- International operations face risks from data localization laws and geopolitical instability.
Which company shows a better risk-adjusted profile?
Microsoft’s most impactful risk is regulatory scrutiny, which can disrupt its dominant market position. Akamai’s capital structure risk, marked by high leverage, threatens its financial stability. I observe Microsoft’s low debt and strong Altman Z-score (9.7) position it better on a risk-adjusted basis. Akamai’s grey zone Altman Z-score (2.56) and near 1 debt-to-equity ratio raise red flags despite stable operational metrics. The recent rise in Microsoft’s regulatory pressures confirms the need for cautious monitoring.
Final Verdict: Which stock to choose?
Microsoft Corporation’s superpower lies in its unmatched efficiency and robust value creation, evidenced by a strong ROIC well above its cost of capital. Its main point of vigilance is the premium valuation, which might pressure returns if growth slows. It fits well in an aggressive growth portfolio seeking market leadership.
Akamai Technologies’ strategic moat centers on its niche in content delivery and network security, offering recurring revenue stability. Compared to Microsoft, it presents a more cautious safety profile, though with declining profitability trends. It suits investors favoring GARP — balancing growth potential with reasonable valuation.
If you prioritize sustained value creation and market dominance, Microsoft outshines due to its superior profitability and financial strength. However, if you seek a more conservative growth approach with a focus on recurring revenue streams, Akamai offers better stability despite weaker profitability metrics.
Disclaimer: Investment carries a risk of loss of initial capital. The past performance is not a reliable indicator of future results. Be sure to understand risks before making an investment decision.
Go Further
I encourage you to read the complete analyses of Microsoft Corporation and Akamai Technologies, Inc. to enhance your investment decisions: