In the dynamic healthcare sector, Agilent Technologies, Inc. and RadNet, Inc. stand out as key players in medical diagnostics and research. Agilent focuses on advanced laboratory instruments and life sciences solutions, while RadNet specializes in outpatient diagnostic imaging services and AI-driven cancer detection. This comparison highlights their innovation strategies and market presence to help investors identify which company offers the most compelling investment opportunity today. Let’s explore which one deserves a place in your portfolio.
Table of contents
Companies Overview
I will begin the comparison between Agilent Technologies, Inc. and RadNet, Inc. by providing an overview of these two companies and their main differences.
Agilent Technologies Overview
Agilent Technologies, Inc. focuses on providing application-driven solutions to life sciences, diagnostics, and applied chemical markets globally. It offers a broad range of instruments and software for laboratory analysis, including chromatography, mass spectrometry, spectroscopy, and genomics. Headquartered in Santa Clara, California, Agilent holds a strong position in the medical diagnostics and research industry with a market cap of 42B USD.
RadNet Overview
RadNet, Inc. operates outpatient diagnostic imaging centers across the United States, delivering services such as MRI, CT, PET, mammography, and ultrasound. It also develops imaging software and AI tools to enhance diagnostic accuracy. Based in Los Angeles, California, RadNet manages 347 centers and has a market cap of 6B USD, positioning itself as a key player in medical diagnostics and radiology.
Key similarities and differences
Both companies operate within the healthcare diagnostics and research sector but differ in their core activities. Agilent primarily manufactures and sells analytical instruments and software across multiple scientific fields, while RadNet focuses on providing diagnostic imaging services and related AI solutions. Agilent’s business model is product-centric and global, whereas RadNet’s is service-oriented and regionally concentrated in the US.
Income Statement Comparison
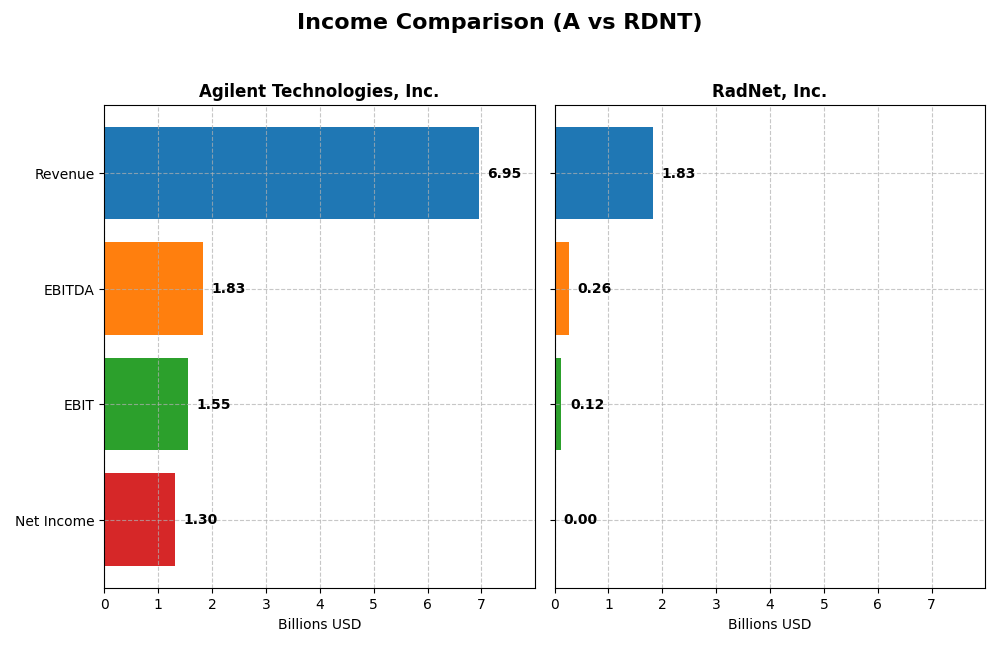
The table below compares key income statement metrics for Agilent Technologies, Inc. and RadNet, Inc. based on their most recent fiscal year data.
| Metric | Agilent Technologies, Inc. | RadNet, Inc. |
|---|---|---|
| Market Cap | 42.1B | 6.0B |
| Revenue | 6.95B | 1.83B |
| EBITDA | 1.84B | 263M |
| EBIT | 1.55B | 125M |
| Net Income | 1.30B | 2.79M |
| EPS | 4.59 | 0.038 |
| Fiscal Year | 2025 | 2024 |
Income Statement Interpretations
Agilent Technologies, Inc.
From 2021 to 2025, Agilent Technologies showed steady revenue growth, reaching $6.95B in 2025, with net income rising to $1.3B. Margins remained robust, with a gross margin around 52.4% and net margin near 18.8%. The latest year saw moderate revenue growth of 6.7%, slight margin contraction, but a favorable 3.2% EPS increase, reflecting stable profitability despite EBIT decline.
RadNet, Inc.
RadNet’s revenue grew significantly over 2020-2024, hitting $1.83B in 2024, with net income rising sharply to $2.8M. Margins stayed thin, gross margin at 13.6%, and net margin very low at 0.15%. The most recent year showed strong revenue and EBIT growth over 13% and 20.7%, respectively, but net margin and EPS declined sharply, indicating margin pressures despite top-line gains.
Which one has the stronger fundamentals?
Agilent Technologies presents stronger fundamentals with high and stable margins, consistent net income growth, and favorable overall income statement metrics. RadNet shows impressive revenue and net income growth rates but struggles with thin margins and recent EPS declines. Agilent’s greater scale and margin stability provide a more solid income profile compared to RadNet’s volatile earnings and low profitability.
Financial Ratios Comparison
The table below presents a side-by-side comparison of key financial ratios for Agilent Technologies, Inc. and RadNet, Inc., based on their latest fiscal year data for 2025 and 2024 respectively.
| Ratios | Agilent Technologies, Inc. (2025) | RadNet, Inc. (2024) |
|---|---|---|
| ROE | 19.3% | 0.31% |
| ROIC | 12.6% | 3.1% |
| P/E | 31.8 | 1826.3 |
| P/B | 6.14 | 5.65 |
| Current Ratio | 1.96 | 2.12 |
| Quick Ratio | 1.52 | 2.12 |
| D/E | 0.50 | 1.92 |
| Debt-to-Assets | 26.4% | 52.6% |
| Interest Coverage | 13.2 | 1.31 |
| Asset Turnover | 0.55 | 0.56 |
| Fixed Asset Turnover | 3.43 | 1.37 |
| Payout ratio | 21.6% | 0% |
| Dividend yield | 0.68% | 0% |
Interpretation of the Ratios
Agilent Technologies, Inc.
Agilent shows a majority of favorable ratios, including strong net margin (18.75%), ROE (19.33%), and ROIC (12.57%), supported by a solid current ratio (1.96) and low debt ratios. However, its high P/E (31.79) and P/B (6.14) ratios are less favorable, indicating possible overvaluation concerns. The company pays dividends with a modest yield of 0.68%, reflecting a cautious payout approach.
RadNet, Inc.
RadNet exhibits generally weak ratios, with very low net margin (0.15%), ROE (0.31%), and ROIC (3.14%), alongside high debt levels (D/E 1.92, debt to assets 52.6%) and limited interest coverage (1.56). Its P/E ratio is extremely high at 1826.32, signaling valuation risk. RadNet does not pay dividends, likely focusing on managing debt and operational challenges.
Which one has the best ratios?
Agilent Technologies clearly outperforms RadNet with a predominantly favorable ratio profile, stronger profitability, and better leverage metrics. RadNet’s financials are marked by unfavorable profitability and leverage ratios, as well as valuation concerns. Overall, Agilent presents a more robust financial position based on these key ratios.
Strategic Positioning
This section compares the strategic positioning of Agilent Technologies, Inc. and RadNet, Inc., including market position, key segments, and exposure to technological disruption:
Agilent Technologies, Inc.
- Leading medical diagnostics and research equipment firm, facing competitive pressure in healthcare technology.
- Diverse segments: Life Sciences, Diagnostics, CrossLab services drive growth through instrumentation and software.
- Exposure to technological disruption via advanced laboratory automation, genetic analysis, and software solutions.
RadNet, Inc.
- Mid-sized outpatient diagnostic imaging service provider in the US, competing regionally with moderate pressure.
- Focused on diagnostic imaging services and AI-driven radiology software, revenue mainly from insurance and patient services.
- Invests in AI for mammography and cancer imaging interpretation, integrating tech to enhance diagnostic accuracy.
Agilent Technologies, Inc. vs RadNet, Inc. Positioning
Agilent’s strategy is diversified across diagnostics, life sciences, and lab services, providing multiple growth drivers but increasing complexity. RadNet is concentrated in imaging and related software, allowing focused innovation but higher dependency on US outpatient diagnostics.
Which has the best competitive advantage?
Agilent holds a slightly favorable moat with value creation despite declining profitability, indicating a stronger competitive advantage. RadNet shows a slightly unfavorable moat, shedding value but with improving profitability, suggesting a less stable advantage.
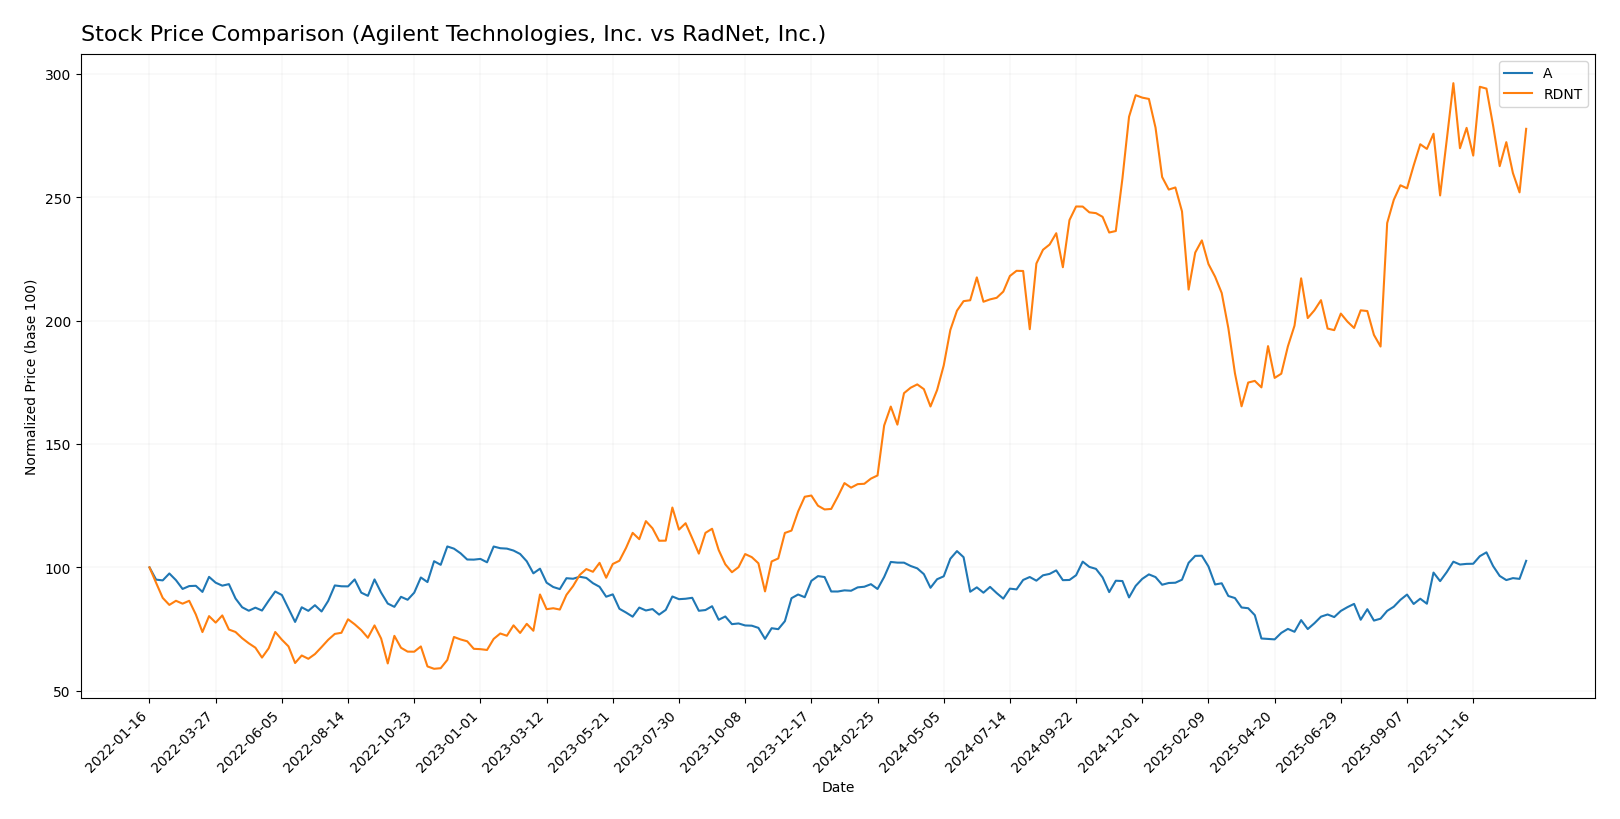
Stock Comparison
The past year showed distinct bullish trends for both Agilent Technologies, Inc. and RadNet, Inc., with RadNet displaying a notably higher overall price appreciation despite recent deceleration in momentum.
Trend Analysis
Agilent Technologies, Inc. exhibited a 10.15% price increase over the last 12 months, indicating a bullish trend with deceleration. The stock ranged from a low of 102.48 to a high of 154.23, with recent slight negative slope despite a small 0.33% gain.
RadNet, Inc. experienced a strong bullish trend, rising 104.23% in the same period with deceleration. The price fluctuated between 38.29 and 83.41. Recent months show a bearish short-term trend, declining 6.25%.
Comparing both, RadNet delivered the highest market performance over the past year, significantly outperforming Agilent in total price appreciation despite recent downward pressure on its stock.
Target Prices
The current analyst consensus presents optimistic target prices for both Agilent Technologies, Inc. and RadNet, Inc.
| Company | Target High | Target Low | Consensus |
|---|---|---|---|
| Agilent Technologies, Inc. | 180 | 130 | 165 |
| RadNet, Inc. | 95 | 90 | 92.25 |
Analysts expect Agilent Technologies’ stock to appreciate moderately above its current price of $148.52, while RadNet, Inc. shows a closer target range near $92.25 compared to its current $78.20.
Analyst Opinions Comparison
This section compares analysts’ ratings and grades for Agilent Technologies, Inc. (A) and RadNet, Inc. (RDNT):
Rating Comparison
A Rating
- Rating: B+, considered very favorable by analysts.
- Discounted Cash Flow Score: 4, indicating a favorable valuation outlook.
- ROE Score: 5, reflecting very efficient profit generation from equity.
- ROA Score: 5, indicating very effective asset utilization.
- Debt To Equity Score: 2, representing moderate financial risk.
- Overall Score: 3, a moderate overall financial standing.
RDNT Rating
- Rating: D+, considered very unfavorable by analysts.
- Discounted Cash Flow Score: 1, indicating a very unfavorable valuation.
- ROE Score: 1, showing very poor efficiency in generating profit from equity.
- ROA Score: 1, indicating very poor asset utilization.
- Debt To Equity Score: 1, representing very high financial risk.
- Overall Score: 1, a very unfavorable overall financial standing.
Which one is the best rated?
Agilent Technologies (A) is clearly better rated than RadNet (RDNT) across all provided financial metrics. A holds favorable to very favorable scores, while RDNT scores are very unfavorable in the same categories.
Scores Comparison
The scores comparison between Agilent Technologies, Inc. and RadNet, Inc. is as follows:
Agilent Technologies, Inc. Scores
- Altman Z-Score: 5.21, indicating a safe zone from bankruptcy risk.
- Piotroski Score: 6, reflecting average financial strength and value.
RadNet, Inc. Scores
- Altman Z-Score: 2.16, placing the company in the grey zone for bankruptcy risk.
- Piotroski Score: 2, considered very weak financial strength and value.
Which company has the best scores?
Based strictly on the data, Agilent Technologies exhibits stronger financial stability with a safe zone Altman Z-Score and average Piotroski Score, whereas RadNet falls into a grey zone with very weak Piotroski results.
Grades Comparison
The following analysis compares the recent grades provided by reputable grading companies for Agilent Technologies, Inc. and RadNet, Inc.:
Agilent Technologies, Inc. Grades
This table summarizes recent grades from credible financial institutions for Agilent Technologies, Inc.:
| Grading Company | Action | New Grade | Date |
|---|---|---|---|
| Evercore ISI Group | Upgrade | Outperform | 2026-01-05 |
| Barclays | Upgrade | Overweight | 2025-12-15 |
| JP Morgan | Maintain | Overweight | 2025-11-25 |
| Wells Fargo | Maintain | Overweight | 2025-11-25 |
| B of A Securities | Maintain | Neutral | 2025-11-25 |
| UBS | Maintain | Buy | 2025-11-25 |
| Barclays | Maintain | Equal Weight | 2025-11-25 |
| Citigroup | Maintain | Buy | 2025-11-25 |
| Baird | Maintain | Outperform | 2025-11-25 |
| TD Cowen | Maintain | Buy | 2025-10-14 |
Overall, Agilent Technologies has a generally positive outlook with multiple upgrades and a consensus rating of “Buy,” showing strong analyst confidence.
RadNet, Inc. Grades
This table summarizes recent grades from reputable financial analysts for RadNet, Inc.:
| Grading Company | Action | New Grade | Date |
|---|---|---|---|
| B. Riley Securities | Maintain | Buy | 2025-12-01 |
| Barclays | Maintain | Overweight | 2025-11-13 |
| Truist Securities | Maintain | Buy | 2025-11-12 |
| Truist Securities | Maintain | Buy | 2025-09-03 |
| Barclays | Maintain | Overweight | 2025-09-03 |
| Raymond James | Maintain | Strong Buy | 2025-08-13 |
| Truist Securities | Maintain | Buy | 2025-04-11 |
| Barclays | Maintain | Overweight | 2025-03-24 |
| Raymond James | Upgrade | Strong Buy | 2025-03-05 |
| Barclays | Maintain | Overweight | 2025-01-22 |
RadNet, Inc. maintains a positive rating trend with several “Buy” and “Strong Buy” grades and a consensus rating of “Buy,” reflecting consistent analyst support.
Which company has the best grades?
Both companies hold a “Buy” consensus, but Agilent Technologies shows more recent upgrades to higher ratings like “Outperform,” while RadNet has steady “Buy” and “Strong Buy” grades. Investors may interpret this as Agilent having slightly stronger upward momentum in grades.
Strengths and Weaknesses
Below is a comparison table highlighting the key strengths and weaknesses of Agilent Technologies, Inc. (A) and RadNet, Inc. (RDNT) based on their recent financial and operational data.
| Criterion | Agilent Technologies, Inc. (A) | RadNet, Inc. (RDNT) |
|---|---|---|
| Diversification | Highly diversified across Life Sciences, Diagnostics, and Applied Markets segments with revenues above $2.7B in Life Sciences alone | Less diversified, primarily focused on Healthcare Imaging and Insurance segments; Commercial Insurance dominates with ~$1B revenue |
| Profitability | Strong profitability with net margin 18.75%, ROE 19.33%, and ROIC 12.57%, indicating efficient capital use | Very low profitability: net margin 0.15%, ROE 0.31%, and ROIC 3.14%, showing weak returns relative to cost of capital |
| Innovation | Consistently invests in advanced technologies across segments, supporting a robust innovation pipeline | Innovation level unclear; financials suggest limited investment in new technologies or product lines |
| Global presence | Significant global footprint supported by diversified product lines and markets | More regional/national focus with limited global scale |
| Market Share | Large market share in scientific instruments and diagnostics markets; steady revenue growth | Smaller market share in healthcare imaging with revenue growth challenges and high price-to-earnings ratio |
Key takeaways: Agilent Technologies demonstrates strong diversification, profitability, and global reach, making it a more stable and value-creating investment despite a slight decline in ROIC trend. RadNet shows improving ROIC but remains unprofitable with high leverage and limited diversification, posing higher risk for investors.
Risk Analysis
Below is a comparative table outlining key risks for Agilent Technologies, Inc. (A) and RadNet, Inc. (RDNT) based on the most recent data for 2025 and 2024 respectively:
| Metric | Agilent Technologies, Inc. (A) | RadNet, Inc. (RDNT) |
|---|---|---|
| Market Risk | Beta 1.29 indicates moderate market volatility risk | Beta 1.51 indicates higher market volatility risk |
| Debt level | Debt-to-Equity 0.5 (favorable), Debt-to-Assets 26.35% (favorable) | Debt-to-Equity 1.92 (unfavorable), Debt-to-Assets 52.6% (unfavorable) |
| Regulatory Risk | Moderate – operates globally in healthcare diagnostics, subject to FDA and other regulations | Moderate to high – operates diagnostic imaging centers heavily regulated by healthcare laws |
| Operational Risk | Moderate – complex product lines and global distribution | Moderate to high – reliance on outpatient imaging centers and AI tech deployment |
| Environmental Risk | Low to moderate – standard manufacturing impacts | Low – primarily service-based with limited manufacturing footprint |
| Geopolitical Risk | Low to moderate – US headquartered with global markets | Low – US centric operations |
In synthesis, RadNet carries the most impactful risks due to its high leverage, weaker profitability, and operational challenges in a competitive diagnostic imaging sector. Agilent shows stronger financial stability and lower debt risk, mitigating market and operational risks more effectively. Investors should weigh RadNet’s financial distress signals carefully against potential growth from AI innovations.
Which Stock to Choose?
Agilent Technologies, Inc. (A) shows a generally favorable income evolution with solid profitability, reflected in an 18.75% net margin and a 19.33% ROE. Its debt levels are well managed, supported by a favorable debt-to-equity ratio of 0.5 and strong interest coverage of 13.81. The company holds a very favorable B+ rating, despite some unfavorable valuation ratios.
RadNet, Inc. (RDNT) presents a mixed income evolution with low profitability metrics, including a 0.15% net margin and a minimal 0.31% ROE. Its financial leverage is higher, with a debt-to-equity ratio of 1.92 and weaker interest coverage at 1.56. The firm’s rating is D+, indicating very unfavorable overall financial health and valuation concerns.
Investors focused on stability and quality might find Agilent’s favorable rating and strong profitability more aligned with their profile, while those with a tolerance for risk and growth orientation could interpret RadNet’s improving profitability trends and significant revenue growth as potential opportunities, despite its weaker rating and higher debt.
Disclaimer: Investment carries a risk of loss of initial capital. The past performance is not a reliable indicator of future results. Be sure to understand risks before making an investment decision.
Go Further
I encourage you to read the complete analyses of Agilent Technologies, Inc. and RadNet, Inc. to enhance your investment decisions: