Home > Comparison > Technology > AMD vs QCOM
The strategic rivalry between Advanced Micro Devices, Inc. (AMD) and QUALCOMM Incorporated shapes the semiconductor industry’s evolution. AMD operates as a diversified chipmaker focused on computing and graphics solutions. QUALCOMM leads with a licensing-driven model emphasizing wireless communications technology. This analysis pits AMD’s growth-oriented manufacturing against QUALCOMM’s intellectual property moat to identify the superior risk-adjusted opportunity for a balanced portfolio.
Table of contents
Companies Overview
Advanced Micro Devices and QUALCOMM stand as pivotal forces in the semiconductor industry, shaping technology’s future.
Advanced Micro Devices, Inc.: Innovator in Computing and Graphics
Advanced Micro Devices dominates as a semiconductor company focused on high-performance computing and graphics solutions. Its core revenue stems from selling x86 microprocessors, GPUs, and server processors to OEMs and cloud providers. In 2026, AMD sharpens its strategic focus on expanding its data center presence and enhancing semi-custom SoC products, leveraging innovation in CPUs and GPUs to challenge market incumbents.
QUALCOMM Incorporated: Leader in Wireless Technology
QUALCOMM excels as a foundational technology provider for wireless communications worldwide. It generates revenue through integrated circuits and licensing intellectual property in 3G, 4G, and 5G technologies. In 2026, QUALCOMM emphasizes advancing 5G adoption and diversifying investments in AI, automotive, and IoT sectors, while maintaining strong licensing income and government contracts, reinforcing its leadership in wireless connectivity.
Strategic Collision: Similarities & Divergences
Both companies compete in semiconductors but diverge sharply in approach: AMD pursues open computing platforms targeting data centers and gaming, while QUALCOMM focuses on a closed ecosystem anchored in wireless standards and IP licensing. Their primary battleground lies in connectivity-enabled computing devices. AMD’s innovation-driven growth contrasts with QUALCOMM’s steady licensing cash flow, highlighting distinct risk-return profiles for investors.
Income Statement Comparison
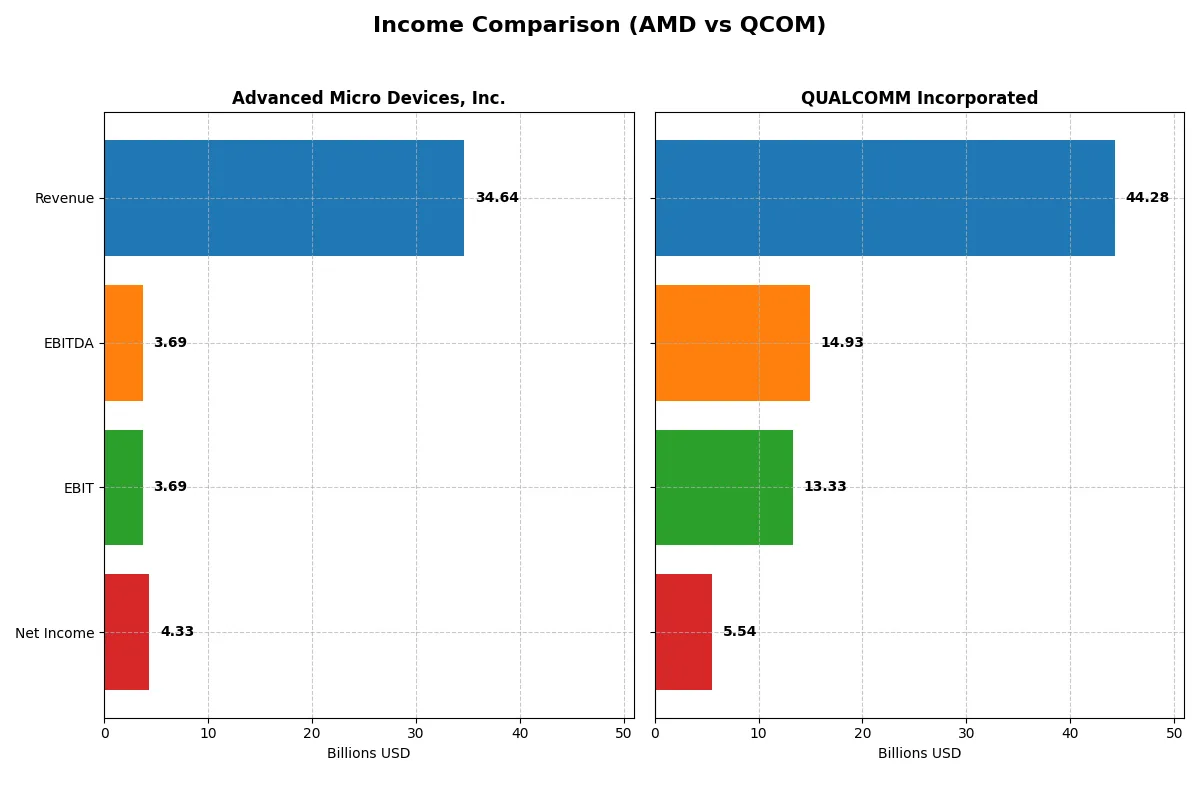
This data dissects the core profitability and scalability of both corporate engines to reveal who dominates the bottom line:
| Metric | Advanced Micro Devices, Inc. (AMD) | QUALCOMM Incorporated (QCOM) |
|---|---|---|
| Revenue | 34.6B | 44.3B |
| Cost of Revenue | 17.5B | 19.7B |
| Operating Expenses | 13.5B | 12.2B |
| Gross Profit | 17.2B | 24.5B |
| EBITDA | 3.7B | 14.9B |
| EBIT | 3.7B | 13.3B |
| Interest Expense | 131M | 664M |
| Net Income | 4.3B | 5.5B |
| EPS | 2.67 | 5.06 |
| Fiscal Year | 2025 | 2025 |
Income Statement Analysis: The Bottom-Line Duel
This income statement comparison exposes which company wields greater operational efficiency and bottom-line strength in a dynamic market environment.
Advanced Micro Devices, Inc. (AMD) Analysis
AMD’s revenue surged from 22.7B in 2023 to 34.6B in 2025, reflecting a robust 34% one-year growth. Its gross margin holds steady at a favorable 49.5%, while the net margin climbed to 12.5%, signaling improved profitability. The 2025 net income more than doubled to 4.3B, driven by strong operating leverage and disciplined expense management.
QUALCOMM Incorporated (QCOM) Analysis
QUALCOMM’s revenue reached 44.3B in 2025, growing 13.7% year-over-year but lagging AMD’s momentum. It maintains a superior gross margin of 55.4% and a strong EBIT margin above 30%, showcasing efficient cost control. However, net income declined to 5.5B in 2025, down from over 10B in 2024, reflecting margin pressure and a sharp net margin contraction.
Margin Momentum vs. Revenue Acceleration
AMD delivers stronger revenue and net income growth, doubling net profits in just two years with expanding margins. QUALCOMM, while commanding higher gross and EBIT margins, exhibits weakening net income and margins amid slower growth. For investors, AMD’s profile appeals more to those prioritizing growth and margin expansion, while QUALCOMM suits those valuing margin stability despite recent earnings softness.
Financial Ratios Comparison
These vital ratios act as a diagnostic tool to expose the underlying fiscal health, valuation premiums, and capital efficiency of these companies:
| Ratios | Advanced Micro Devices, Inc. (AMD) | QUALCOMM Incorporated (QCOM) |
|---|---|---|
| ROE | 2.85% (2024) | 26.13% (2025) |
| ROIC | 2.49% (2024) | 13.19% (2025) |
| P/E | 124 (2024) | 33 (2025) |
| P/B | 3.52 (2024) | 8.54 (2025) |
| Current Ratio | 2.62 (2024) | 2.82 (2025) |
| Quick Ratio | 1.83 (2024) | 2.10 (2025) |
| D/E | 3.8% (2024) | 69.8% (2025) |
| Debt-to-Assets | 3.2% (2024) | 29.5% (2025) |
| Interest Coverage | 20.7 (2024) | 18.6 (2025) |
| Asset Turnover | 0.37 (2024) | 0.88 (2025) |
| Fixed Asset Turnover | 10.63 (2024) | 9.44 (2025) |
| Payout ratio | 0% (2024) | 68.7% (2025) |
| Dividend yield | 0% (2024) | 2.10% (2025) |
| Fiscal Year | 2024 | 2025 |
Efficiency & Valuation Duel: The Vital Signs
Financial ratios act as a company’s DNA, exposing hidden risks and operational strengths essential for informed investment decisions.
Advanced Micro Devices, Inc.
AMD posts a favorable net margin of 12.51% but reports zero return on equity and invested capital, signaling operational challenges. Its P/E ratio at 80.54 marks the stock as highly expensive. Without dividends, AMD channels cash into aggressive R&D, dedicating 25% of revenue to innovation, reflecting a growth-focused reinvestment strategy.
QUALCOMM Incorporated
QUALCOMM displays robust profitability with a 26.13% ROE and 13.19% ROIC, indicating efficient capital use. The P/E of 32.7 suggests moderate valuation, though its high P/B of 8.54 signals some premium pricing. The company balances growth and shareholder returns, offering a 2.1% dividend yield alongside solid cash flow and manageable debt levels.
Premium Valuation vs. Operational Safety
QUALCOMM delivers a superior balance of profitability and valuation with a favorable ratio profile, while AMD’s stretched valuation and weak returns raise caution. Investors seeking operational safety and steady income may prefer QUALCOMM’s stable metrics, whereas those betting on growth might consider AMD’s reinvestment emphasis despite its risks.
Which one offers the Superior Shareholder Reward?
I compare AMD’s zero dividend yield and absence of buybacks with QUALCOMM’s 2.1% dividend yield and active buyback program. AMD reinvests heavily in R&D, reflected in robust free cash flow but no distributions. QUALCOMM balances 36% payout ratio dividends with buybacks, delivering steady income and capital return. QUALCOMM’s sustainable mix of dividends and buybacks offers superior total return and lower risk for 2026 investors.
Comparative Score Analysis: The Strategic Profile
The radar chart reveals the fundamental DNA and trade-offs of Advanced Micro Devices, Inc. and QUALCOMM Incorporated, highlighting their core financial strengths and vulnerabilities:
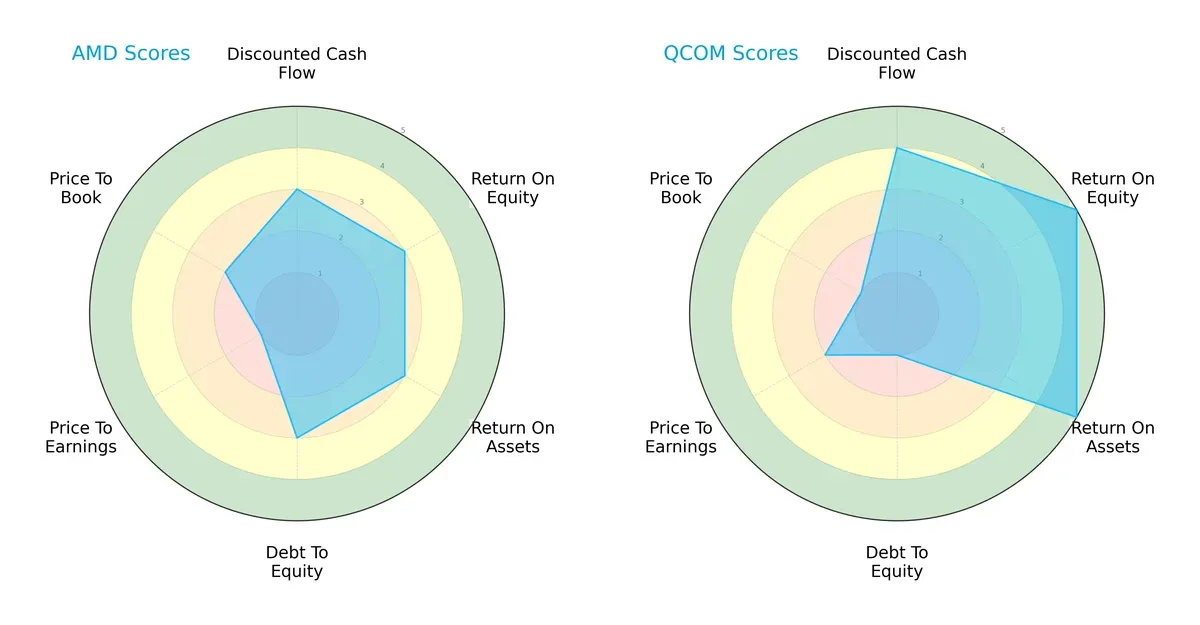
QUALCOMM leads with superior returns, scoring 5 in both ROE and ROA, demonstrating outstanding efficiency in generating profits and asset utilization. AMD holds a balanced but moderate profile, scoring 3 across DCF, ROE, ROA, and Debt/Equity, indicating steady but unspectacular performance. AMD’s valuation metrics reveal a weakness, with a very unfavorable P/E score of 1 versus QUALCOMM’s moderate 2, suggesting AMD might be undervalued or facing earnings concerns. However, QUALCOMM’s aggressive debt profile, scoring 1 on Debt/Equity, raises caution despite its financial prowess. Overall, QUALCOMM relies on operational excellence but carries higher leverage risk, while AMD presents a more evenly distributed risk-return profile.
—
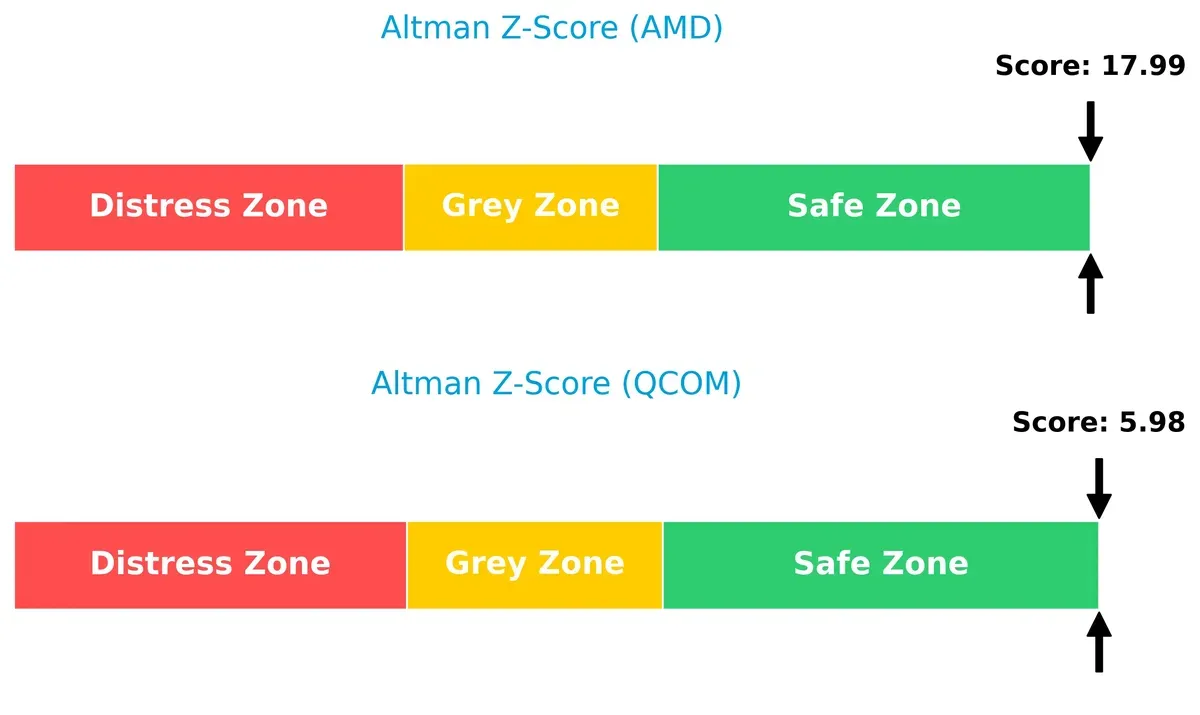
Bankruptcy Risk: Solvency Showdown
QUALCOMM’s Altman Z-Score of 6.0 versus AMD’s 18.0 places both firms safely above distress thresholds, but AMD’s score signals a significantly stronger solvency buffer in this cycle:
—
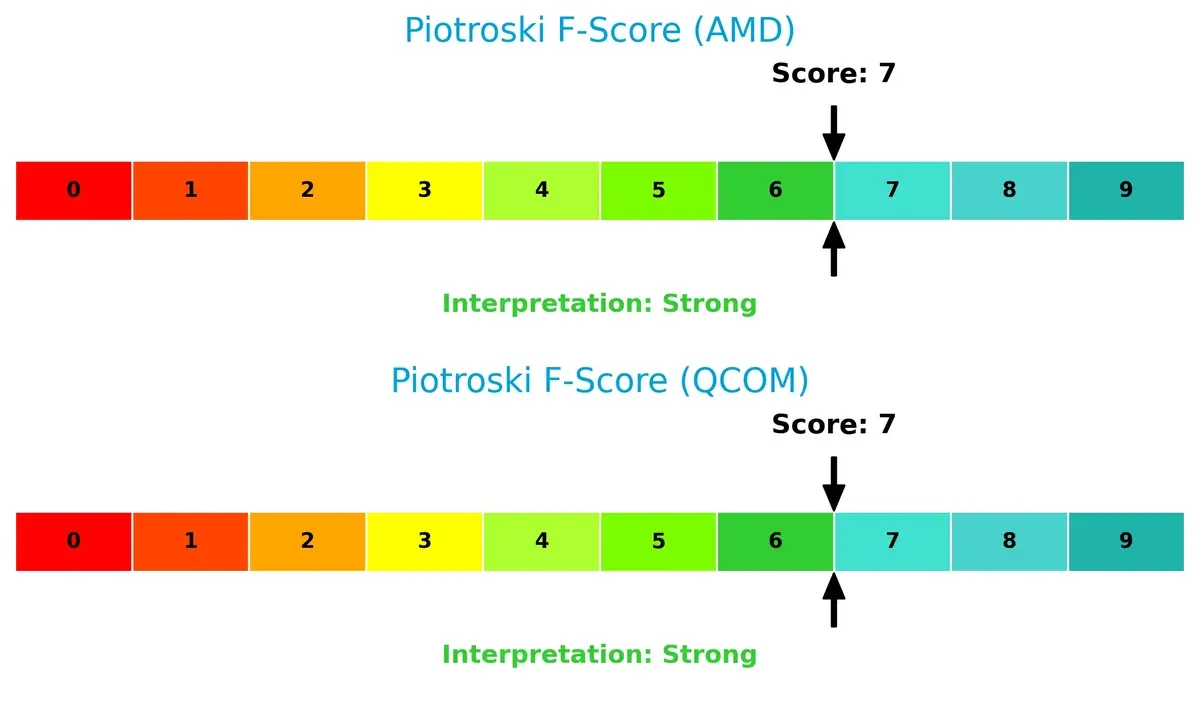
Financial Health: Quality of Operations
Both companies post strong Piotroski F-Scores of 7, indicating solid financial health and robust internal metrics. Neither shows immediate red flags, reflecting sound profitability, liquidity, and operational efficiency:
How are the two companies positioned?
This section dissects AMD and QCOM’s operational DNA by comparing their revenue distribution and internal dynamics. The goal is to confront their economic moats to determine which model offers the most resilient competitive advantage today.
Revenue Segmentation: The Strategic Mix
This visual comparison dissects how Advanced Micro Devices, Inc. and QUALCOMM Incorporated diversify their income streams and where their primary sector bets lie:
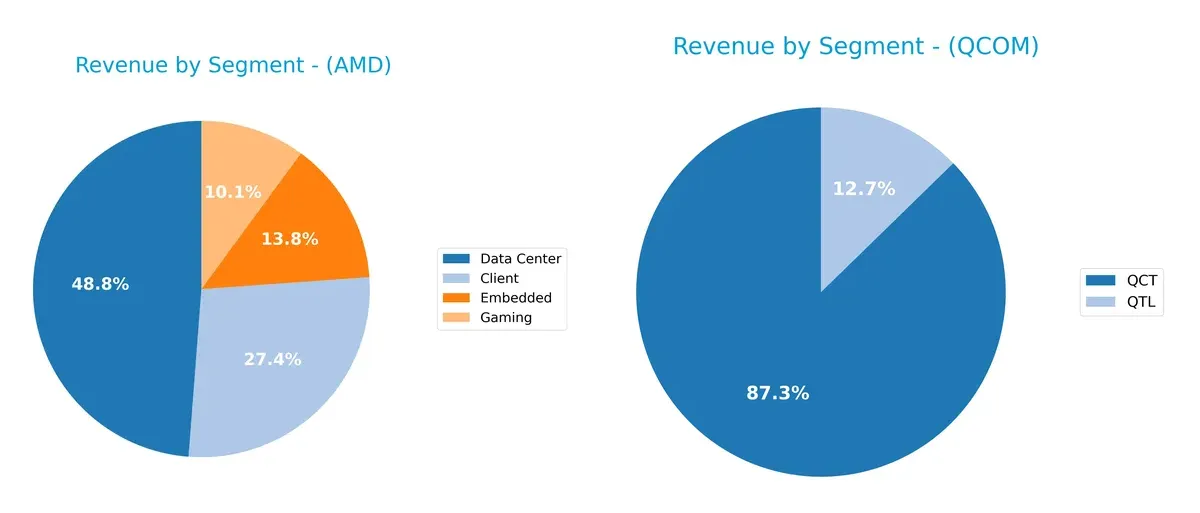
Advanced Micro Devices, Inc. balances revenue across Data Center ($12.6B), Client ($7.1B), Embedded ($3.6B), and Gaming ($2.6B). QUALCOMM leans heavily on QCT ($38.4B) with smaller contributions from QTL ($5.6B) and negligible QSI. AMD’s diversified mix reduces concentration risk and signals multi-sector agility. QUALCOMM’s dominance in QCT anchors its infrastructure leadership but raises exposure to chipset market cycles.
Strengths and Weaknesses Comparison
This table compares the Strengths and Weaknesses of AMD and QCOM based on diversification, profitability, financials, innovation, global presence, and market share:
AMD Strengths
- Diverse product segments including Client, Data Center, Embedded, and Gaming
- Strong presence in the US and China markets
- Favorable net margin and interest coverage ratios
- Low debt and debt-to-assets ratios support financial stability
QCOM Strengths
- Large revenue base driven by QCT and QTL segments
- Favorable profitability with high ROE and ROIC
- Solid liquidity ratios and manageable debt level
- Dividend yield adds investor appeal
- Strong global footprint in China, Korea, and Vietnam
AMD Weaknesses
- Unfavorable ROE, ROIC, and WACC indicate weak capital efficiency
- High PE ratio signals possible overvaluation
- Poor liquidity ratios (current and quick) raise short-term risk
- Asset turnover ratios unfavorable, suggesting inefficient asset use
QCOM Weaknesses
- PE and PB ratios unfavorable, indicating valuation concerns
- Moderate debt-to-equity ratio flagged as neutral
- Asset turnover is only neutral, not optimal
- Smaller US revenue proportion than AMD
AMD shows strength in product diversification and financial stability through low leverage but struggles with capital efficiency and liquidity. QCOM excels in profitability and global reach with better liquidity but faces valuation and moderate efficiency challenges. These factors reflect distinct strategic focuses and operational risks for each company.
The Moat Duel: Analyzing Competitive Defensibility
A structural moat is the only reliable shield protecting long-term profits from relentless competition erosion. Let’s dissect two semiconductor giants’ moats:
Advanced Micro Devices, Inc. (AMD): Innovation-Driven Product Moat
AMD’s moat stems from its cutting-edge chip design and semi-custom SoCs, driving high gross margins near 50%. However, its negative ROIC vs. WACC signals value destruction, risking moat erosion unless innovation accelerates in 2026.
QUALCOMM Incorporated (QCOM): Intellectual Property and Licensing Moat
QUALCOMM’s moat lies in its vast patent portfolio and licensing model, delivering a robust 55% gross margin and positive ROIC above WACC. Despite declining ROIC trends, its licensing revenue supports steady cash flow and potential 5G market expansion.
Innovation Velocity vs. Patent Power: Who Holds the Stronger Moat?
QUALCOMM maintains a deeper moat through licensing-derived economic profits, while AMD’s innovation moat struggles with value destruction. QCOM is better positioned to defend market share amid intensifying semiconductor competition.
Which stock offers better returns?
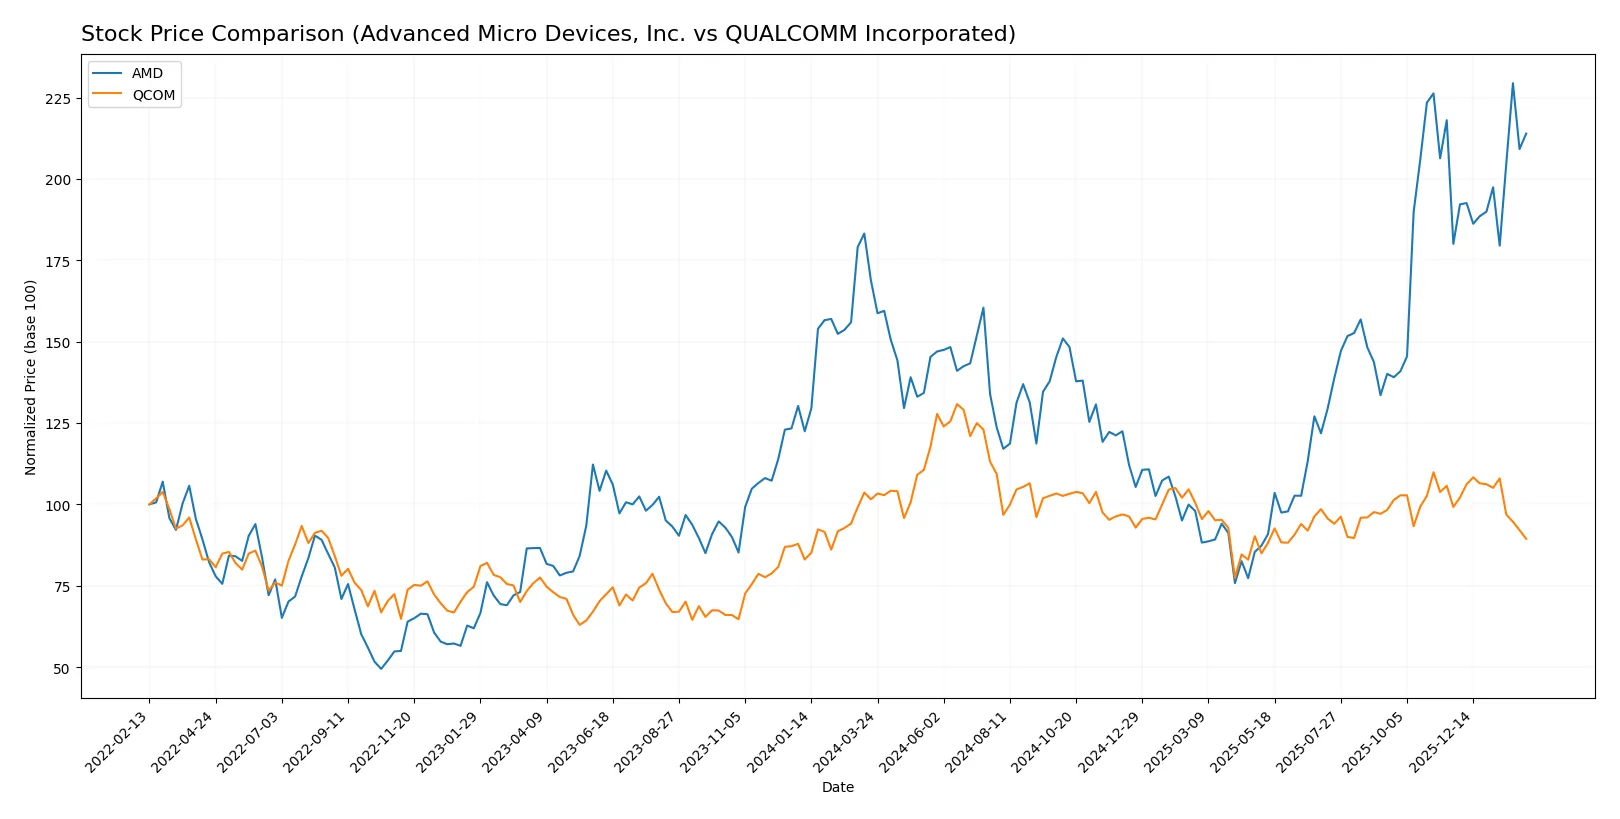
The past year shows diverging trajectories for Advanced Micro Devices, Inc. (AMD) and QUALCOMM Incorporated (QCOM), with AMD gaining significantly while QCOM declined amid shifting trading volumes and momentum.
Trend Comparison
AMD’s stock price climbed 26.72% over the past 12 months, indicating a bullish trend with accelerating momentum and a high of 259.68. Volatility remains elevated at 41.61.
QCOM’s stock declined 11.97% over the same period, confirming a bearish trend with decelerating losses and a volatility level near 16.26. The highest price was 215.33.
Comparing both, AMD outperformed QCOM clearly in market returns, showing strong upward acceleration compared to QCOM’s steady depreciation.
Target Prices
Analysts present a balanced target consensus for Advanced Micro Devices and QUALCOMM, reflecting measured optimism in semiconductor sector growth.
| Company | Target Low | Target High | Consensus |
|---|---|---|---|
| Advanced Micro Devices, Inc. | 225 | 380 | 291.56 |
| QUALCOMM Incorporated | 160 | 210 | 181.43 |
The consensus targets for AMD and QCOM exceed current prices by a healthy margin, signaling analyst confidence in their strategic positioning and growth potential.

Don’t Let Luck Decide Your Entry Point
Optimize your entry points with our advanced ProRealTime indicators. You’ll get efficient buy signals with precise price targets for maximum performance. Start outperforming now!
How do institutions grade them?
Advanced Micro Devices, Inc. Grades
The following table shows recent grades Advanced Micro Devices, Inc. received from key institutions.
| Grading Company | Action | New Grade | Date |
|---|---|---|---|
| Wells Fargo | Maintain | Overweight | 2026-01-30 |
| Piper Sandler | Maintain | Overweight | 2026-01-26 |
| UBS | Maintain | Buy | 2026-01-26 |
| Bernstein | Maintain | Market Perform | 2026-01-21 |
| Keybanc | Upgrade | Overweight | 2026-01-13 |
| Truist Securities | Maintain | Buy | 2025-12-19 |
| Cantor Fitzgerald | Maintain | Overweight | 2025-12-16 |
| Morgan Stanley | Maintain | Equal Weight | 2025-11-12 |
| Wedbush | Maintain | Outperform | 2025-11-12 |
| Rosenblatt | Maintain | Buy | 2025-11-12 |
QUALCOMM Incorporated Grades
The table below lists recent grades for QUALCOMM Incorporated by major grading companies.
| Grading Company | Action | New Grade | Date |
|---|---|---|---|
| Cantor Fitzgerald | Maintain | Neutral | 2026-02-02 |
| UBS | Maintain | Neutral | 2026-01-26 |
| Mizuho | Maintain | Neutral | 2026-01-26 |
| Mizuho | Downgrade | Neutral | 2026-01-09 |
| Piper Sandler | Maintain | Overweight | 2025-11-06 |
| Wells Fargo | Maintain | Underweight | 2025-11-06 |
| B of A Securities | Maintain | Buy | 2025-11-06 |
| Mizuho | Maintain | Outperform | 2025-11-06 |
| UBS | Maintain | Neutral | 2025-11-06 |
| Rosenblatt | Maintain | Buy | 2025-11-06 |
Which company has the best grades?
Advanced Micro Devices, Inc. consistently receives higher grades like Buy and Overweight, while QUALCOMM Incorporated mostly holds Neutral or mixed ratings. AMD’s stronger grades suggest greater institutional confidence, potentially influencing investor sentiment positively.
Risks specific to each company
The following categories identify the critical pressure points and systemic threats facing both firms in the 2026 market environment:
1. Market & Competition
Advanced Micro Devices, Inc.
- Faces intense competition in semiconductors, with high P/E signaling growth expectations and valuation risk.
QUALCOMM Incorporated
- Strong in wireless tech with diversified segments but faces pressure from global 5G rivals and patent challenges.
2. Capital Structure & Debt
Advanced Micro Devices, Inc.
- Demonstrates a favorable debt profile with strong interest coverage and low leverage, reducing financial risk.
QUALCOMM Incorporated
- Carries moderate debt with decent coverage but higher debt-to-equity ratio indicates elevated financial leverage risk.
3. Stock Volatility
Advanced Micro Devices, Inc.
- Beta of 1.95 suggests high stock volatility, increasing investment risk during market downturns.
QUALCOMM Incorporated
- Lower beta of 1.24 implies more stability, appealing for risk-averse investors in volatile markets.
4. Regulatory & Legal
Advanced Micro Devices, Inc.
- Subject to semiconductor export controls and IP litigation risks amid geopolitical tensions.
QUALCOMM Incorporated
- Faces significant patent licensing disputes and regulatory scrutiny globally, impacting licensing revenues.
5. Supply Chain & Operations
Advanced Micro Devices, Inc.
- Relies on complex global supply chains vulnerable to disruptions and component shortages.
QUALCOMM Incorporated
- Supply chain diversified but exposed to risks in semiconductor manufacturing and component sourcing.
6. ESG & Climate Transition
Advanced Micro Devices, Inc.
- Increasing pressure to reduce carbon footprint and enhance sustainability in manufacturing processes.
QUALCOMM Incorporated
- Focuses on ESG initiatives but must manage energy-intensive operations and regulatory ESG compliance.
7. Geopolitical Exposure
Advanced Micro Devices, Inc.
- High exposure to US-China tech tensions affecting market access and supply chain stability.
QUALCOMM Incorporated
- Also impacted by geopolitical risks but benefits from government contracts that may provide some insulation.
Which company shows a better risk-adjusted profile?
QUALCOMM’s most impactful risk lies in regulatory and patent licensing disputes. AMD’s biggest concern is its high stock volatility combined with valuation risk. Despite AMD’s favorable debt metrics, QUALCOMM’s stronger profitability ratios and more balanced capital structure present a better risk-adjusted profile. Notably, AMD’s beta near 2 warns of significant price swings, justifying caution for risk-sensitive investors.
Final Verdict: Which stock to choose?
Advanced Micro Devices (AMD) shines with unmatched growth momentum and a strong innovation engine fueling rapid revenue surges. Its superpower lies in aggressive R&D investment, driving market share gains in a competitive semiconductor space. The point of vigilance is its negative economic moat, indicating value destruction that could pressure returns. AMD suits aggressive growth portfolios seeking capital appreciation despite elevated risk.
QUALCOMM (QCOM) holds a strategic moat built on diversified patent royalties and recurring licensing revenues. This creates a resilient cash flow base with solid profitability and a safer financial profile compared to AMD. Despite a declining ROIC trend, QCOM offers better stability and income potential, fitting well within GARP (Growth at a Reasonable Price) portfolios prioritizing steady returns with moderate risk.
If you prioritize rapid expansion and capitalizing on semiconductor innovation, AMD is the compelling choice due to its dynamic growth trajectory. However, if you seek a more stable investment with a durable competitive advantage and consistent cash flow, QCOM offers better stability and a more favorable financial foundation. Both carry risks that require careful consideration aligned with your risk tolerance and portfolio strategy.
Disclaimer: Investment carries a risk of loss of initial capital. The past performance is not a reliable indicator of future results. Be sure to understand risks before making an investment decision.
Go Further
I encourage you to read the complete analyses of Advanced Micro Devices, Inc. and QUALCOMM Incorporated to enhance your investment decisions: