Home > Comparison > Technology > AMD vs GFS
The strategic rivalry between Advanced Micro Devices, Inc. and GLOBALFOUNDRIES Inc. defines the semiconductor sector’s competitive landscape. AMD operates as an integrated designer and producer of microprocessors and GPUs, blending innovation with product diversity. GLOBALFOUNDRIES focuses on capital-intensive wafer fabrication services, specializing in foundry manufacturing. This head-to-head pits a technology-driven integrated model against a pure-play foundry. This analysis reveals which trajectory offers superior risk-adjusted returns for a diversified portfolio.
Table of contents
Companies Overview
Advanced Micro Devices and GLOBALFOUNDRIES both play pivotal roles in the semiconductor industry, shaping modern technology’s backbone.
Advanced Micro Devices, Inc.: Leading Innovator in Computing and Graphics
Advanced Micro Devices dominates as a semiconductor company focusing on high-performance computing and graphics. It generates revenue primarily through processors and GPUs under brands like Ryzen and Radeon. In 2026, AMD emphasizes expanding its portfolio in data center and embedded systems, leveraging its competitive edge in x86 microprocessors and semi-custom SoCs.
GLOBALFOUNDRIES Inc.: Specialist in Semiconductor Manufacturing
GLOBALFOUNDRIES operates as a global semiconductor foundry, manufacturing integrated circuits for diverse electronic devices. Its revenue stems from wafer fabrication services and producing components such as microprocessors and power management units. In 2026, it focuses on scaling manufacturing capabilities and technology offerings to meet rising industry demand.
Strategic Collision: Similarities & Divergences
AMD pursues a product-driven model integrating design and performance innovation, while GLOBALFOUNDRIES centers on manufacturing scale and process technology as a pure foundry. They clash primarily in supplying chips for computing and mobile markets. Their distinct investment profiles reflect AMD’s innovation leadership versus GLOBALFOUNDRIES’ capital-intensive manufacturing specialization.
Income Statement Comparison
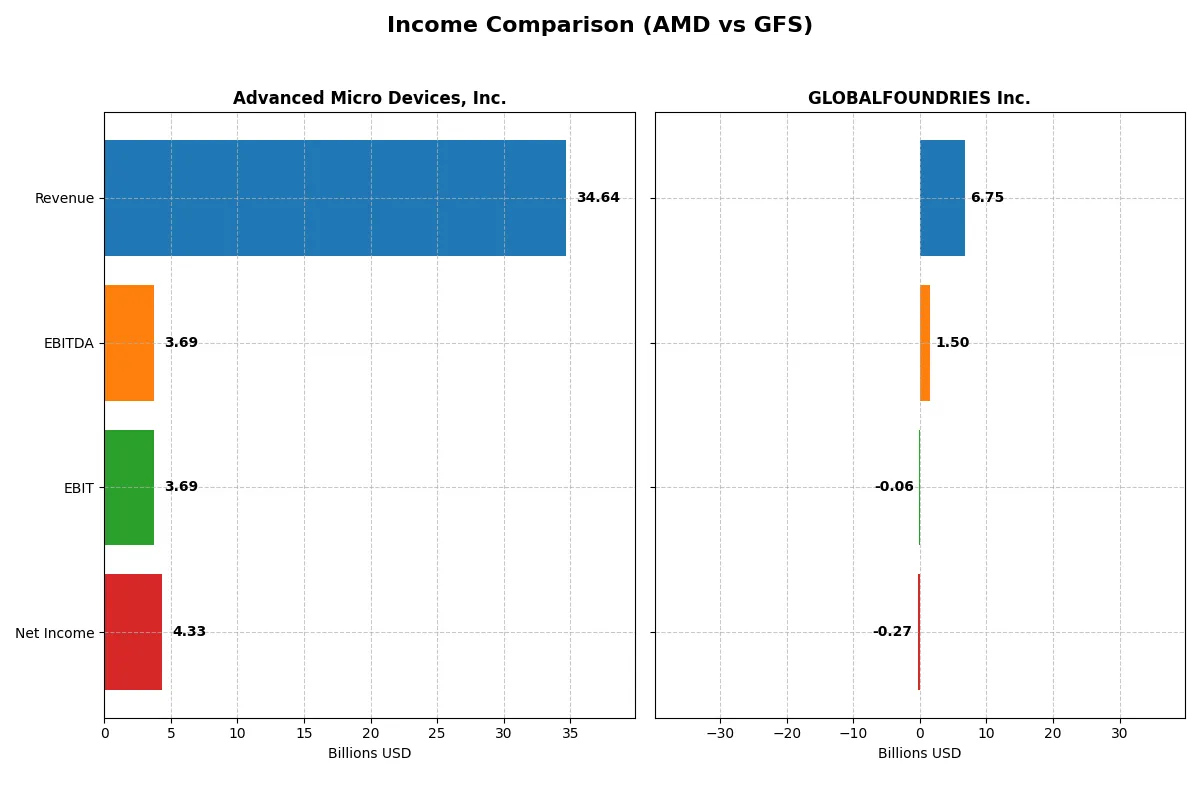
The following data dissects the core profitability and scalability of both corporate engines to reveal who dominates the bottom line:
| Metric | Advanced Micro Devices, Inc. (AMD) | GLOBALFOUNDRIES Inc. (GFS) |
|---|---|---|
| Revenue | 34.6B | 6.75B |
| Cost of Revenue | 17.5B | 5.10B |
| Operating Expenses | 13.5B | 1.87B |
| Gross Profit | 17.2B | 1.65B |
| EBITDA | 3.69B | 1.50B |
| EBIT | 3.69B | -64M |
| Interest Expense | 131M | 145M |
| Net Income | 4.34B | -265M |
| EPS | 2.67 | -0.48 |
| Fiscal Year | 2025 | 2024 |
Income Statement Analysis: The Bottom-Line Duel
This income statement comparison reveals the true operational efficiency and profitability trajectories of two semiconductor players.
Advanced Micro Devices, Inc. Analysis
AMD’s revenue surged from $16.4B in 2021 to $34.6B in 2025, reflecting strong growth momentum. Its gross margin remains healthy at 49.5%, while net margin expanded to 12.5%, signaling improving cost control. The 2025 net income of $4.3B and EPS of $2.67 illustrate robust profitability and operational efficiency gains.
GLOBALFOUNDRIES Inc. Analysis
GLOBALFOUNDRIES’ revenue peaked at $8.1B in 2022 but declined to $6.75B in 2024, showing recent top-line contraction. Its gross margin stands at a modest 24.5%, with a negative net margin of -3.9% reflecting ongoing profitability challenges. A 2024 net loss of $265M and EPS of -$0.48 highlight continuing struggles to convert revenue into profit.
Growth and Profitability: Momentum vs. Margin Discipline
AMD dominates with a 34% revenue growth in the last year, a 10.7% EBIT margin, and a positive net margin, showcasing operational leverage and scale advantages. GLOBALFOUNDRIES faces a shrinking revenue base and negative net margins, underscoring profitability headwinds. For investors, AMD’s profile offers superior growth and margin strength, while GLOBALFOUNDRIES presents higher risk with uncertain profitability recovery.
Financial Ratios Comparison
These vital ratios act as a diagnostic tool to expose the underlying fiscal health, valuation premiums, and capital efficiency of the companies compared below:
| Ratios | Advanced Micro Devices, Inc. (AMD) | GLOBALFOUNDRIES Inc. (GFS) |
|---|---|---|
| ROE | 2.85% (2024) | -2.46% (2024) |
| ROIC | 2.49% (2024) | -1.47% (2024) |
| P/E | 124.0 (2024) | -89.5 (2024) |
| P/B | 3.52 (2024) | 2.20 (2024) |
| Current Ratio | 2.62 (2024) | 2.11 (2024) |
| Quick Ratio | 1.83 (2024) | 1.57 (2024) |
| D/E | 0.04 (2024) | 0.22 (2024) |
| Debt-to-Assets | 3.2% (2024) | 13.8% (2024) |
| Interest Coverage | 20.7 (2024) | -1.48 (2024) |
| Asset Turnover | 0.37 (2024) | 0.40 (2024) |
| Fixed Asset Turnover | 10.6 (2024) | 0.82 (2024) |
| Payout ratio | 0% (2024) | 0% (2024) |
| Dividend yield | 0% (2024) | 0% (2024) |
| Fiscal Year | 2024 | 2024 |
Efficiency & Valuation Duel: The Vital Signs
Ratios serve as a company’s DNA, uncovering hidden risks and revealing operational strengths that guide investor decisions.
Advanced Micro Devices, Inc.
AMD shows a mixed picture with a low return on equity and invested capital, signaling weak profitability despite a solid 12.5% net margin. The stock trades at a stretched P/E of 80.5, suggesting high valuation risk. AMD delivers no dividends but invests heavily in R&D, fueling growth and innovation.
GLOBALFOUNDRIES Inc.
GFS suffers from negative returns on equity and invested capital, reflecting operational challenges and losses. Its P/E ratio is negative but price-to-book is reasonable at 2.2. GFS maintains a healthy current ratio above 2, indicating liquidity strength. The company pays no dividends, focusing instead on capital preservation and selective growth investments.
Premium Valuation vs. Operational Fragility
AMD’s premium valuation contrasts with GFS’s operational losses and weaker profitability metrics. AMD’s growth-driven profile suits investors seeking innovation exposure. GFS’s liquidity and lower valuation appeal to risk-tolerant investors prioritizing turnaround potential. Each firm presents distinct risk-reward trade-offs for different investment strategies.
Which one offers the Superior Shareholder Reward?
I observe that neither AMD nor GLOBALFOUNDRIES pays dividends, focusing instead on reinvestment and buybacks. AMD’s free cash flow per share stands at $3.4B with a robust capex coverage ratio of 6.7x, enabling aggressive share repurchases. GLOBALFOUNDRIES shows weaker free cash flow ($2B) and higher capex demands, limiting buyback capacity. AMD’s capital allocation favors sustainable buybacks over dividends, supporting long-term value. I conclude AMD offers a superior total shareholder reward in 2026 due to stronger free cash flow generation and a more disciplined buyback strategy.
Comparative Score Analysis: The Strategic Profile
The radar chart reveals the fundamental DNA and trade-offs of Advanced Micro Devices, Inc. and GLOBALFOUNDRIES Inc.:
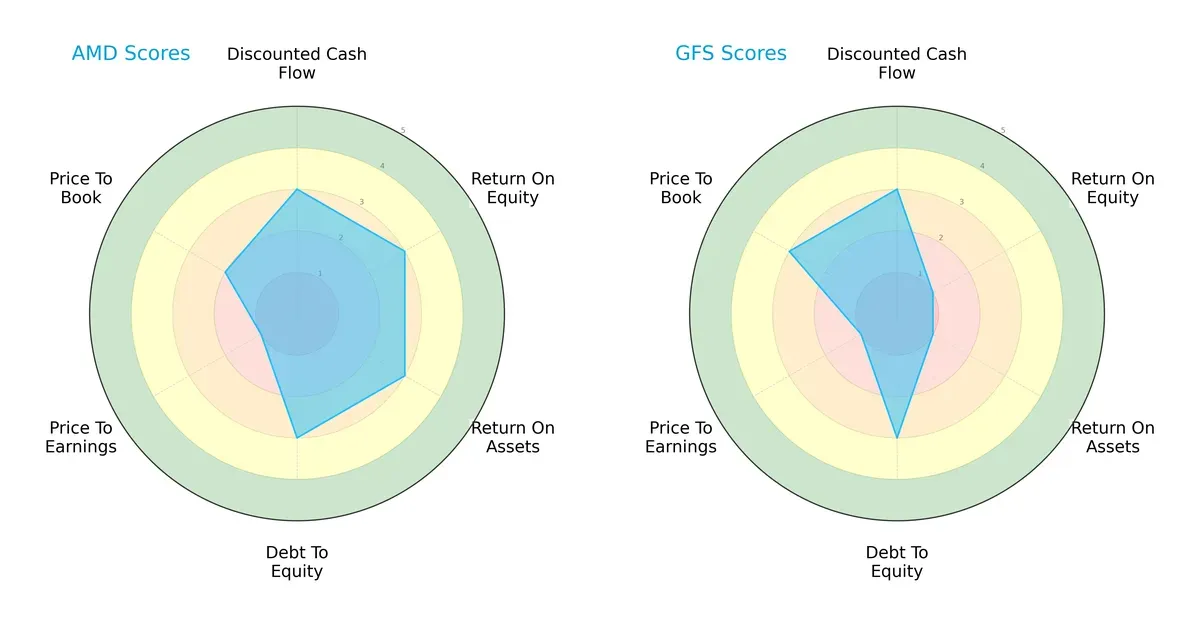
AMD shows a balanced financial profile with moderate scores in DCF, ROE, ROA, and Debt/Equity, indicating steady profitability and manageable leverage. GFS matches AMD in DCF and Debt/Equity but lags significantly in ROE and ROA, signaling weaker asset utilization and profit generation. AMD’s diversified strengths contrast with GFS’s reliance on financial stability, highlighting AMD’s more balanced competitive edge.
Bankruptcy Risk: Solvency Showdown
AMD’s Altman Z-Score of 18 places it firmly in the safe zone, while GFS’s score of 2.56 signals a grey zone risk level:
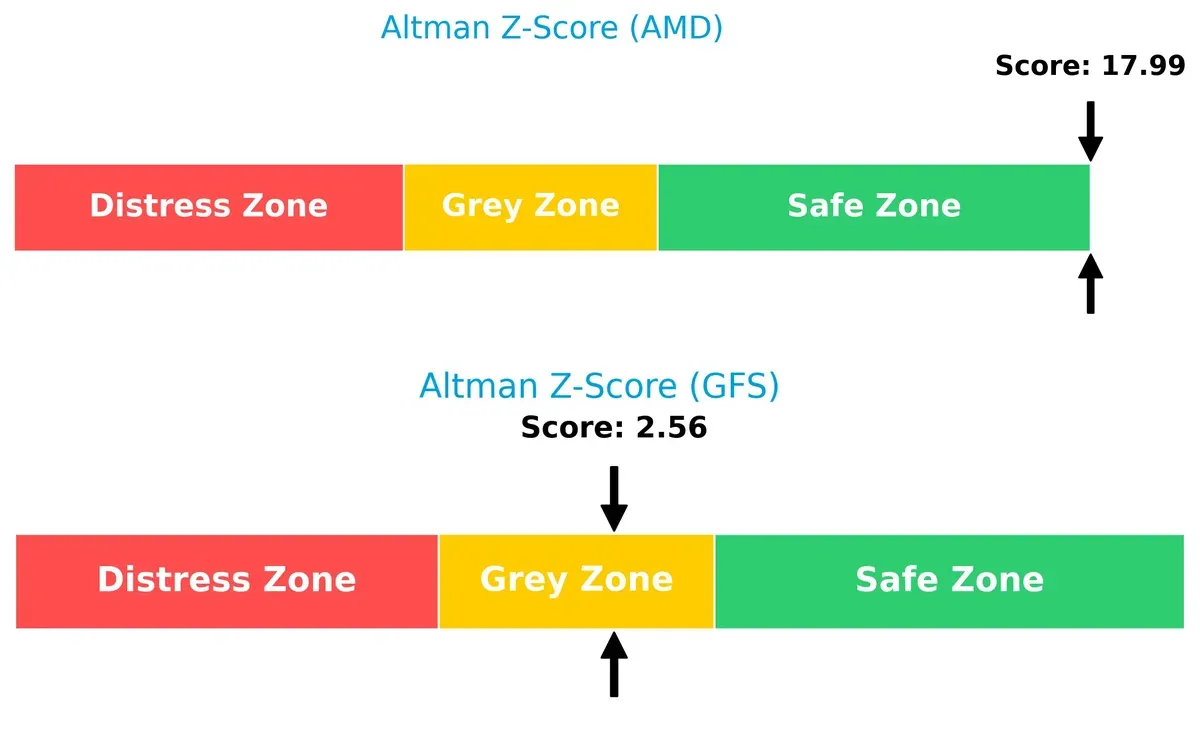
This wide gap implies AMD’s superior solvency and long-term survival odds amid market volatility. GFS faces moderate bankruptcy risk, indicating financial fragility that investors must monitor closely.
Financial Health: Quality of Operations
AMD’s Piotroski F-Score of 7 suggests strong financial health, outperforming GFS’s average score of 6:
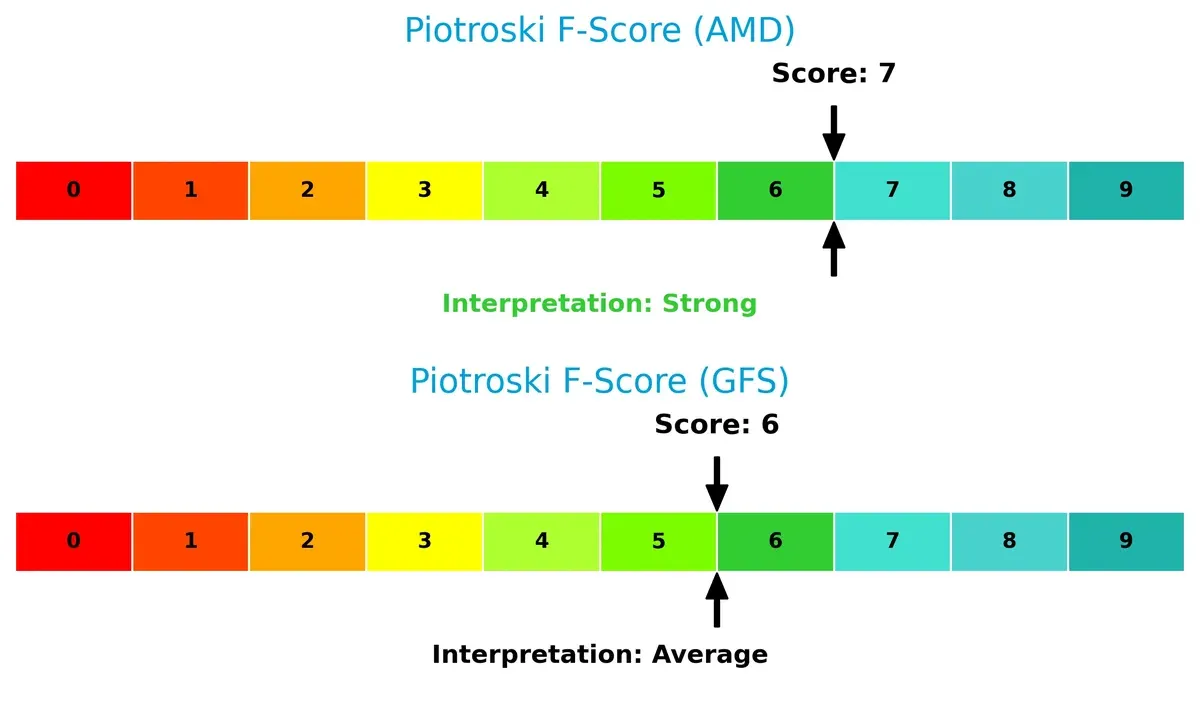
AMD demonstrates robust internal metrics with fewer red flags, while GFS’s score signals some operational weaknesses. This difference reinforces AMD’s position as the higher-quality operator between the two.
How are the two companies positioned?
This section dissects the operational DNA of AMD and GFS by comparing their revenue distribution by segment and internal dynamics. The goal is to confront their economic moats to identify which model offers the most resilient, sustainable competitive advantage today.
Revenue Segmentation: The Strategic Mix
This visual comparison dissects how Advanced Micro Devices and GLOBALFOUNDRIES diversify income streams and where their primary sector bets lie:
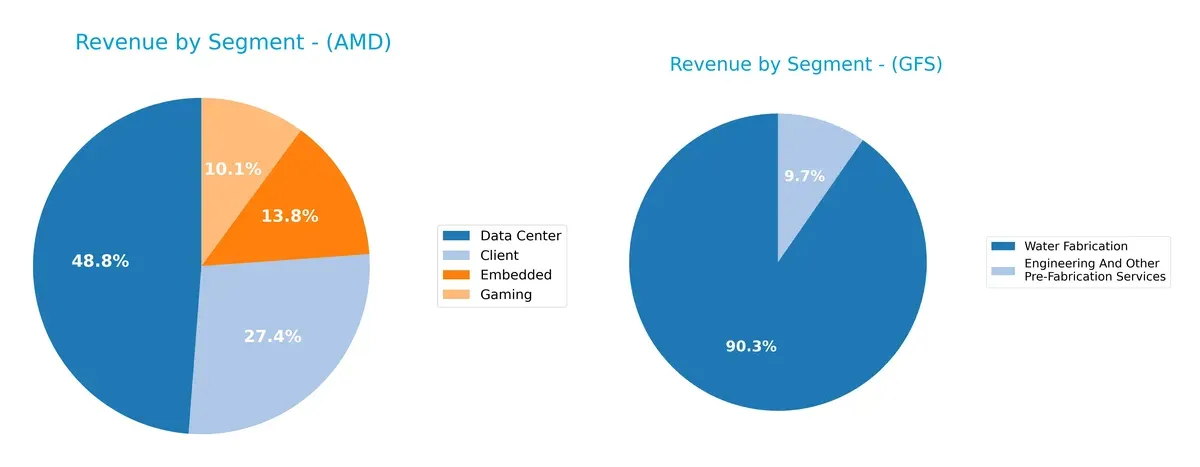
AMD’s revenue mix shows strong diversification, with Data Center leading at $12.6B, followed by Client at $7.1B, Embedded at $3.6B, and Gaming at $2.6B. GLOBALFOUNDRIES relies heavily on Water Fabrication, which dwarfs its Engineering Services at $6.1B versus $652M. AMD pivots on multiple growth engines, reducing concentration risk. GFS anchors its model on a single segment, exposing it to industry cyclicality but benefiting from infrastructure dominance.
Strengths and Weaknesses Comparison
This table compares the Strengths and Weaknesses of AMD and GFS based on diversification, profitability, financials, innovation, global presence, and market share:
AMD Strengths
- Diverse revenue streams across Client, Data Center, Embedded, and Gaming segments
- Strong presence in major global markets including US, China, Taiwan, and Singapore
- Favorable net margin of 12.51%
- Low debt-to-assets and high interest coverage ratios indicating financial stability
GFS Strengths
- Solid liquidity with current ratio 2.11 and quick ratio 1.57
- Conservative leverage with debt-to-assets at 13.81%
- Stable revenue from Water Fabrication segment
- Significant revenue concentration in US and EMEA regions
AMD Weaknesses
- Unfavorable ROE, ROIC, and WACC reflecting weak capital efficiency
- High PE ratio at 80.54 indicates expensive valuation
- Weak liquidity ratios with current and quick ratios at zero
- Negative asset turnover suggests inefficiency in asset utilization
- Zero dividend yield may deter income-focused investors
GFS Weaknesses
- Negative profitability metrics including net margin (-3.93%), ROE (-2.46%), and ROIC (-1.47%)
- Negative interest coverage at -0.44 signals risk in servicing debt
- Unfavorable asset turnover ratios below 1 indicate operational inefficiency
- Negative PE ratio shows losses
- No dividend yield
Both companies face profitability and efficiency challenges with unfavorable capital returns. AMD shows stronger global diversification and financial stability, while GFS benefits from better liquidity but suffers from losses and weak operational metrics. These contrasts highlight differing strategic priorities and risk profiles.
The Moat Duel: Analyzing Competitive Defensibility
A structural moat alone protects long-term profits from competition’s relentless erosion. Let’s examine where AMD and GLOBALFOUNDRIES stand:
Advanced Micro Devices, Inc.: Innovation-Driven Intangible Assets
AMD’s moat stems from powerful intangible assets, including proprietary chip designs and brand strength. This manifests in robust revenue growth (110% over five years) and improving margins. Yet, declining ROIC signals value destruction, raising concerns about sustainable profitability into 2026.
GLOBALFOUNDRIES Inc.: Scale-Dependent Cost Advantage
GLOBALFOUNDRIES relies on scale and manufacturing capacity as its moat, contrasting AMD’s design focus. Despite recent negative margins, its ROIC shows an upward trend, hinting at improving capital efficiency. Expansion into new wafer technologies could bolster its competitive footing.
Innovation Moat vs. Scale Moat: The Battle for Semiconductor Supremacy
AMD’s intangible asset moat is deeper but currently under pressure due to declining ROIC. GLOBALFOUNDRIES’ cost advantage is narrower yet gaining traction. AMD remains better positioned to defend market share if it reverses its profitability decline.
Which stock offers better returns?
The stock price chart highlights Advanced Micro Devices’ strong upward momentum and GLOBALFOUNDRIES’ significant decline followed by recent recovery in trading dynamics over the past year.
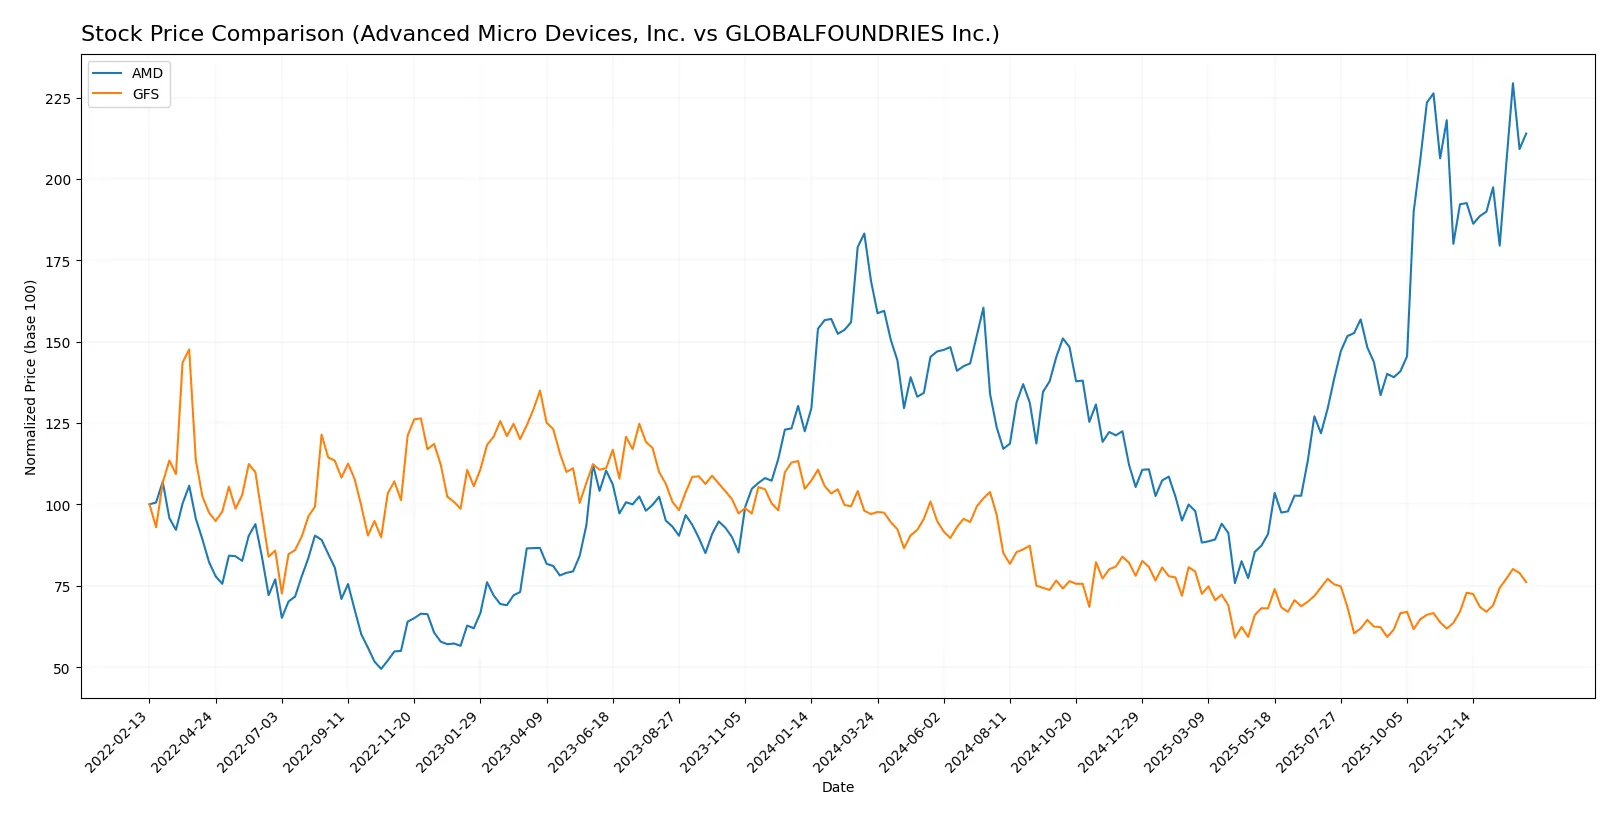
Trend Comparison
Advanced Micro Devices, Inc. shows a bullish trend with a 26.72% price increase over the past 12 months, accelerating upward from a low of 85.76 to a high near 260. The stock’s volatility is elevated, with a standard deviation of 41.61.
GLOBALFOUNDRIES Inc. exhibits a bearish trend, declining 21.57% over the same period despite acceleration. The stock’s price ranged between 31.54 and 55.5, with lower volatility at a 6.08 standard deviation.
AMD’s strong 26.72% gain clearly outperforms GFS’s 21.57% decline, delivering the highest market return over the past year.
Target Prices
Analysts present a moderately bullish consensus on Advanced Micro Devices, Inc. and GLOBALFOUNDRIES Inc.
| Company | Target Low | Target High | Consensus |
|---|---|---|---|
| Advanced Micro Devices, Inc. | 225 | 380 | 291.56 |
| GLOBALFOUNDRIES Inc. | 37 | 45 | 40.67 |
The AMD consensus target of 291.56 suggests upside from the current 242.11 price, reflecting confidence in its semiconductor leadership. GLOBALFOUNDRIES’ 40.67 target aligns closely with its 40.69 market price, indicating a near-term valuation equilibrium.

Don’t Let Luck Decide Your Entry Point
Optimize your entry points with our advanced ProRealTime indicators. You’ll get efficient buy signals with precise price targets for maximum performance. Start outperforming now!
How do institutions grade them?
The following tables summarize recent institutional grades for Advanced Micro Devices, Inc. and GLOBALFOUNDRIES Inc.:
Advanced Micro Devices, Inc. Grades
This table shows the latest grades from major institutional analysts for AMD.
| Grading Company | Action | New Grade | Date |
|---|---|---|---|
| Wells Fargo | Maintain | Overweight | 2026-01-30 |
| Piper Sandler | Maintain | Overweight | 2026-01-26 |
| UBS | Maintain | Buy | 2026-01-26 |
| Bernstein | Maintain | Market Perform | 2026-01-21 |
| Keybanc | Upgrade | Overweight | 2026-01-13 |
| Truist Securities | Maintain | Buy | 2025-12-19 |
| Cantor Fitzgerald | Maintain | Overweight | 2025-12-16 |
| Morgan Stanley | Maintain | Equal Weight | 2025-11-12 |
| Wedbush | Maintain | Outperform | 2025-11-12 |
| Rosenblatt | Maintain | Buy | 2025-11-12 |
GLOBALFOUNDRIES Inc. Grades
This table shows recent institutional grades for GFS from notable analysts.
| Grading Company | Action | New Grade | Date |
|---|---|---|---|
| Citigroup | Maintain | Neutral | 2026-01-15 |
| Wedbush | Downgrade | Neutral | 2025-12-31 |
| B of A Securities | Maintain | Underperform | 2025-12-04 |
| Citigroup | Maintain | Neutral | 2025-11-13 |
| Evercore ISI Group | Maintain | Outperform | 2025-11-13 |
| JP Morgan | Maintain | Neutral | 2025-11-13 |
| Wedbush | Maintain | Outperform | 2025-11-13 |
| B of A Securities | Downgrade | Underperform | 2025-10-13 |
| Wedbush | Maintain | Outperform | 2025-08-06 |
| Morgan Stanley | Maintain | Equal Weight | 2025-08-06 |
Which company has the best grades?
AMD consistently receives positive grades, including several Buy and Overweight ratings. GFS shows mixed grades with Neutral and Underperform ratings dominating. This contrast may influence investors seeking stronger institutional confidence.
Risks specific to each company
In 2026’s semiconductor market, these categories expose critical pressure points and systemic threats for both firms:
1. Market & Competition
Advanced Micro Devices, Inc. (AMD)
- Faces intense competition from Intel, Nvidia, and TSMC; must innovate rapidly to maintain growth.
GLOBALFOUNDRIES Inc. (GFS)
- Operates in foundry services with pressure from TSMC and Samsung; limited product differentiation risks margin erosion.
2. Capital Structure & Debt
Advanced Micro Devices, Inc. (AMD)
- Strong debt profile with favorable debt-to-equity and interest coverage ratios, minimizing financial risk.
GLOBALFOUNDRIES Inc. (GFS)
- Low debt-to-equity but poor interest coverage indicates stress servicing debt, raising solvency concerns.
3. Stock Volatility
Advanced Micro Devices, Inc. (AMD)
- High beta of 1.949 signals elevated stock volatility, reflecting sensitivity to tech sector swings.
GLOBALFOUNDRIES Inc. (GFS)
- Moderate beta at 1.493 suggests less volatility but still exposed to semiconductor cyclical risks.
4. Regulatory & Legal
Advanced Micro Devices, Inc. (AMD)
- Subject to global tech export controls and IP litigation risks; regulatory shifts impact supply chains.
GLOBALFOUNDRIES Inc. (GFS)
- Faces regulatory scrutiny in US and EU markets; foundry-specific compliance may add operational costs.
5. Supply Chain & Operations
Advanced Micro Devices, Inc. (AMD)
- Relies on third-party foundries, creating exposure to capacity constraints and geopolitical disruptions.
GLOBALFOUNDRIES Inc. (GFS)
- Controls manufacturing facilities but faces operational risks from capital intensity and technology transitions.
6. ESG & Climate Transition
Advanced Micro Devices, Inc. (AMD)
- Increasing pressure to reduce carbon footprint; ESG initiatives critical to maintaining investor appeal.
GLOBALFOUNDRIES Inc. (GFS)
- Must manage energy-intensive operations amid rising regulatory demands for sustainability and emissions cuts.
7. Geopolitical Exposure
Advanced Micro Devices, Inc. (AMD)
- Global sales and supply chains expose AMD to US-China tensions and trade policy volatility.
GLOBALFOUNDRIES Inc. (GFS)
- US-based manufacturing limits direct China exposure but vulnerabilities remain in global supply linkages.
Which company shows a better risk-adjusted profile?
AMD’s primary risk lies in market competition and high valuation pressure, while GFS struggles with operational debt stress and weaker profitability. AMD’s strong Altman Z-score (safe zone) and better interest coverage reflect superior financial stability. GFS’s grey zone Z-score and negative margins underscore elevated bankruptcy risk. Despite AMD’s high stock volatility, it shows a better risk-adjusted profile, supported by its stronger liquidity and operational resilience amid sector cyclicality.
Final Verdict: Which stock to choose?
Advanced Micro Devices, Inc. (AMD) demonstrates a superpower in rapid revenue and earnings growth, fueled by relentless innovation and market share gains. Its point of vigilance lies in shrinking profitability and a declining return on invested capital, signaling challenges in capital efficiency. AMD suits an aggressive growth portfolio willing to navigate volatility for outsized returns.
GLOBALFOUNDRIES Inc. (GFS) offers a strategic moat through its specialized foundry services and steady free cash flow generation, providing a cushion against market swings. Relative to AMD, GFS presents a more conservative risk profile despite recent operational setbacks. It fits well within a GARP (Growth at a Reasonable Price) portfolio seeking gradual value creation with moderate downside.
If you prioritize high-growth potential and can tolerate capital efficiency risks, AMD is the compelling choice due to its robust top-line momentum and industry positioning. However, if you seek better stability and cash flow resilience in a cyclical sector, GFS offers a safer analytical scenario despite earnings headwinds. Both require vigilance on evolving competitive dynamics and capital allocation effectiveness.
Disclaimer: Investment carries a risk of loss of initial capital. The past performance is not a reliable indicator of future results. Be sure to understand risks before making an investment decision.
Go Further
I encourage you to read the complete analyses of Advanced Micro Devices, Inc. and GLOBALFOUNDRIES Inc. to enhance your investment decisions: