Home > Comparison > Technology > MSFT vs ADBE
The strategic rivalry between Microsoft Corporation and Adobe Inc. shapes the future of the technology sector. Microsoft, a diversified software and cloud infrastructure giant, contrasts with Adobe’s focused leadership in creative and digital marketing software. This analysis pits Microsoft’s broad operational scale against Adobe’s high-margin specialization. I will evaluate which company offers a superior risk-adjusted return, guiding investors seeking durable growth and resilience in a fast-evolving market.

Table of contents
Companies Overview
Microsoft and Adobe are pivotal players in the software infrastructure sector, shaping enterprise and creative digital landscapes.
Microsoft Corporation: Technology Giant with Diversified Software Ecosystem
Microsoft dominates as a technology leader offering software, cloud, and device solutions globally. Its revenue stems from three segments: Productivity and Business Processes, Intelligent Cloud, and More Personal Computing. In 2026, its strategic focus sharpens on expanding cloud services via Azure and reinforcing its enterprise software suite, driving robust customer engagement across platforms.
Adobe Inc.: Creative and Digital Experience Innovator
Adobe stands as a diversified software company specializing in creative and digital media solutions. It earns primarily through subscription-based Creative Cloud and Digital Experience platforms. Its 2026 strategy emphasizes enhancing customer experience management and expanding cloud-based document services, targeting marketers, content creators, and enterprises seeking integrated digital workflows.
Strategic Collision: Similarities & Divergences
Both companies thrive in software infrastructure but diverge in approach: Microsoft builds a broad ecosystem spanning enterprise productivity and cloud, while Adobe focuses on creative content and customer experience platforms. They compete mainly in cloud services and digital transformation. Microsoft offers a massive scale and diversified portfolio; Adobe presents a niche, innovation-driven profile with strong subscription revenue growth.
Income Statement Comparison
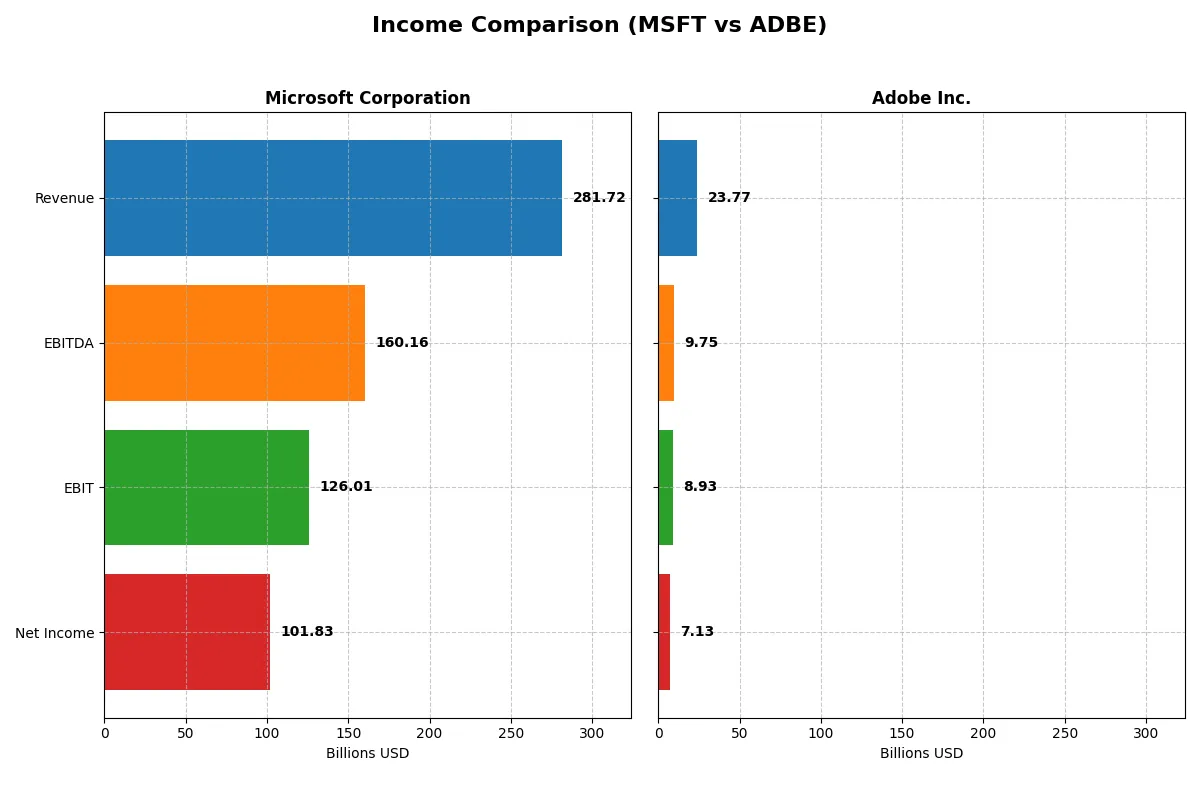
This data dissects the core profitability and scalability of both corporate engines to reveal who dominates the bottom line:
| Metric | Microsoft Corporation (MSFT) | Adobe Inc. (ADBE) |
|---|---|---|
| Revenue | 282B | 23.8B |
| Cost of Revenue | 87.8B | 2.71B |
| Operating Expenses | 65.4B | 12.4B |
| Gross Profit | 194B | 21.1B |
| EBITDA | 160B | 9.75B |
| EBIT | 126B | 8.93B |
| Interest Expense | 2.39B | 263M |
| Net Income | 102B | 7.13B |
| EPS | 13.7 | 16.73 |
| Fiscal Year | 2025 | 2025 |
Income Statement Analysis: The Bottom-Line Duel
This income statement comparison reveals which company drives efficiency and profit power most effectively in their core operations.
Microsoft Corporation Analysis
Microsoft’s revenue climbed from $168B in 2021 to $282B in 2025, with net income rising from $61B to $102B. The company sustains a strong gross margin near 69%, while its net margin remains robust above 36%. In 2025, Microsoft shows solid momentum with nearly 15% revenue growth and a steady expansion in operating profit, reflecting disciplined cost control and scalable operations.
Adobe Inc. Analysis
Adobe’s revenue grew from $15.8B in 2021 to $23.8B in 2025, and net income increased from $4.8B to $7.1B. Its gross margin impresses at 89%, outpacing Microsoft, although net margin is lower at 30%. Adobe’s 2025 performance highlights a 10.5% revenue rise and a 25.8% jump in EBIT, signaling efficient expense management and expanding profitability despite a smaller scale.
Scale Dominance vs. Margin Efficiency
Microsoft commands a commanding scale advantage with three times Adobe’s revenue and significantly higher net income. It maintains healthy margins and consistent double-digit growth, which reinforces its industry-leading position. Adobe excels in margin efficiency, showing stronger gross margins and faster EBIT growth, appealing to investors favoring operational leverage. Ultimately, Microsoft’s scale and steady profit growth offer a more compelling fundamental profile for broad portfolio inclusion.
Financial Ratios Comparison
These vital ratios act as a diagnostic tool to expose the underlying fiscal health, valuation premiums, and capital efficiency of the companies analyzed:
| Ratios | Microsoft Corporation (MSFT) | Adobe Inc. (ADBE) |
|---|---|---|
| ROE | 29.65% | 61.34% |
| ROIC | 22.02% | 36.69% |
| P/E | 36.31 | 19.13 |
| P/B | 10.76 | 11.73 |
| Current Ratio | 1.35 | 1.00 |
| Quick Ratio | 1.35 | 1.00 |
| D/E | 0.18 | 0.57 |
| Debt-to-Assets | 9.79% | 22.54% |
| Interest Coverage | 53.89 | 33.10 |
| Asset Turnover | 0.46 | 0.81 |
| Fixed Asset Turnover | 1.23 | 10.88 |
| Payout ratio | 23.65% | 0% |
| Dividend yield | 0.65% | 0% |
| Fiscal Year | 2025 | 2025 |
Efficiency & Valuation Duel: The Vital Signs
Financial ratios serve as a company’s DNA, exposing hidden risks and highlighting operational strength critical for investment analysis.
Microsoft Corporation
Microsoft exhibits strong profitability with a 29.65% ROE and a 36.15% net margin, signaling operational excellence. Its valuation appears stretched, with a high P/E of 36.31 and P/B of 10.76. Shareholders receive modest dividends (0.65% yield), while the firm emphasizes reinvestment in R&D and growth, supporting long-term value creation.
Adobe Inc.
Adobe delivers exceptional profitability, boasting a 61.34% ROE and 30.0% net margin, outperforming many peers. Its valuation is more reasonable, with a P/E of 19.13, though P/B at 11.73 is elevated. Adobe pays no dividend, focusing capital on innovation and expansion to sustain its competitive moat and future returns.
Operational Mastery vs. Valuation Discipline
Microsoft’s high margins and sound capital allocation come at a premium valuation, reflecting market confidence but limited margin for error. Adobe offers superior returns on equity with a more moderate price-to-earnings ratio but higher leverage. Investors seeking operational safety may lean toward Microsoft; those prioritizing growth efficiency might prefer Adobe’s profile.
Which one offers the Superior Shareholder Reward?
I compare Microsoft Corporation (MSFT) and Adobe Inc. (ADBE) on shareholder reward through dividends, payout ratios, and buybacks. Microsoft yields ~0.65%, with a payout ratio near 24%, balancing dividends and buybacks. Adobe pays no dividend, reinvesting 98%+ of FCF into growth. Microsoft’s steady dividend and consistent buybacks signal sustainable, shareholder-friendly capital allocation. Adobe’s surge in free cash flow fuels aggressive reinvestment, yet lacks immediate shareholder returns. In 2026, Microsoft offers a more balanced, reliable total return, while Adobe bets on long-term capital gains. I favor Microsoft for superior shareholder reward today.
Comparative Score Analysis: The Strategic Profile
The radar chart reveals the fundamental DNA and trade-offs of Microsoft Corporation and Adobe Inc., highlighting their core financial strengths and valuation nuances:
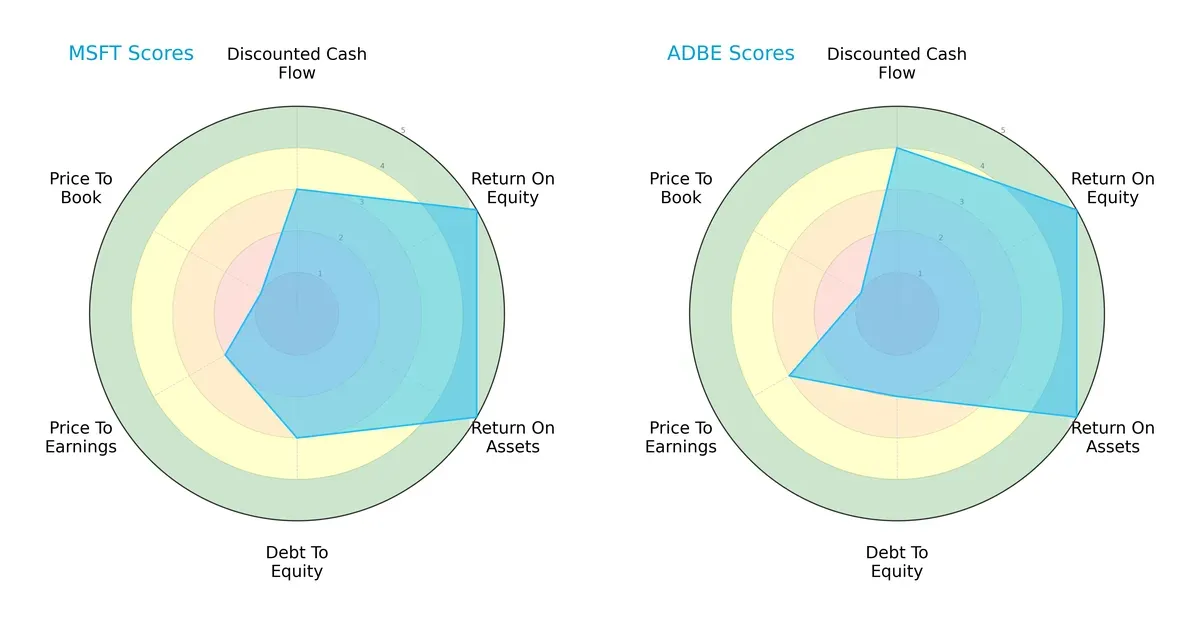
Microsoft shows a balanced profile with very strong ROE and ROA scores (5 each), moderate DCF and debt-to-equity scores (3), but weaker valuation scores, especially in price-to-book (1). Adobe leans on a stronger overall and DCF score (4 each) with equally high profitability metrics but slightly higher financial risk given its lower debt-to-equity score (2). Adobe edges Microsoft on valuation with a better price-to-earnings score (3 vs. 2), indicating more favorable market pricing.
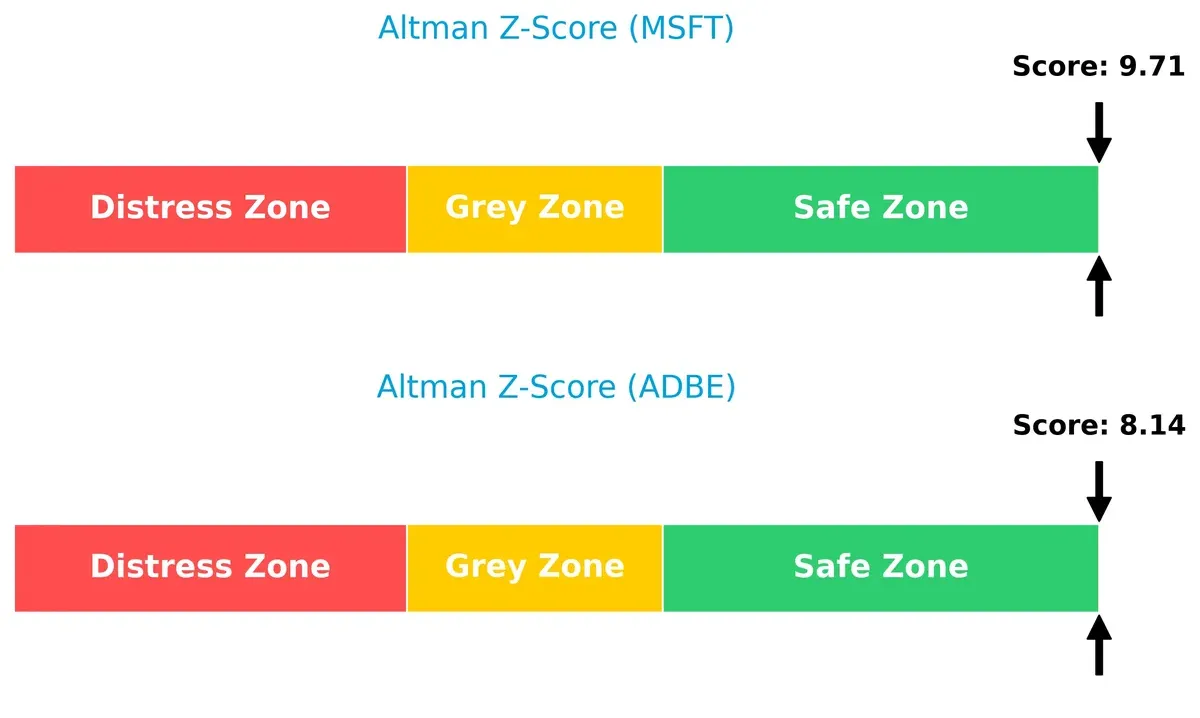
Bankruptcy Risk: Solvency Showdown
Microsoft’s Altman Z-Score of 9.7 versus Adobe’s 8.1 places both firms safely above distress thresholds, signaling robust solvency and strong long-term survival prospects in this economic cycle:
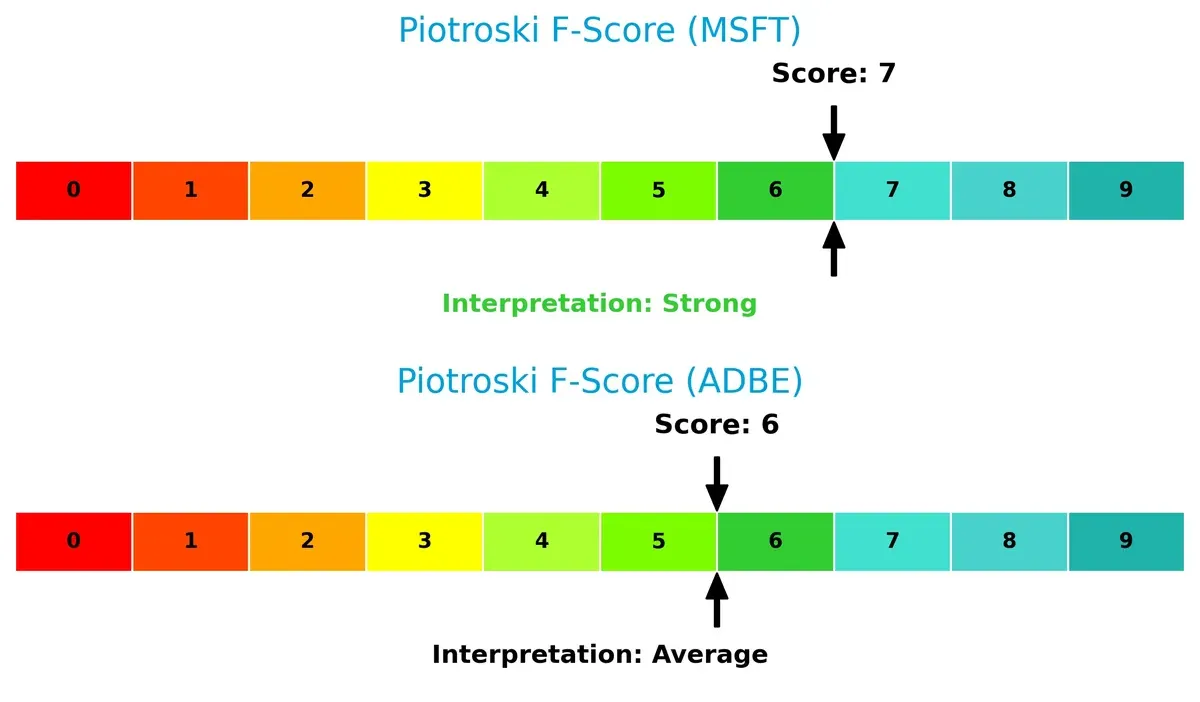
Financial Health: Quality of Operations
Microsoft’s Piotroski F-Score of 7 signals stronger financial health compared to Adobe’s 6, suggesting Microsoft maintains more consistent internal financial quality and fewer red flags:
How are the two companies positioned?
This section dissects the operational DNA of Microsoft and Adobe by comparing their revenue distribution and internal dynamics. The goal is to confront their economic moats and identify which business model delivers the most resilient competitive advantage today.
Revenue Segmentation: The Strategic Mix
This visual comparison dissects how Microsoft Corporation and Adobe Inc. diversify their income streams and highlights where their primary sector bets lie:
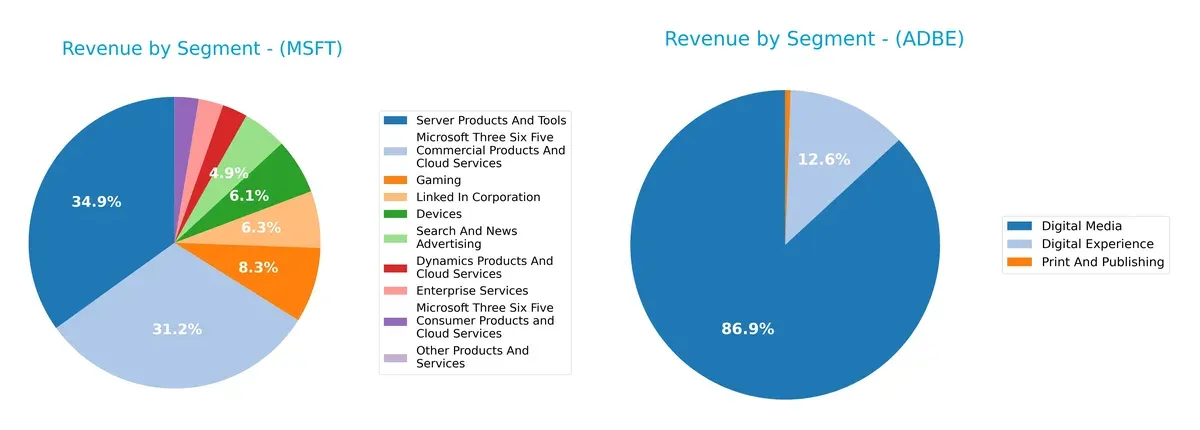
Microsoft’s revenue spans numerous segments with Server Products and Tools ($98B) and Microsoft 365 Commercial Products ($88B) anchoring its vast ecosystem. Adobe, however, pivots heavily on Digital Media ($40B), which dwarfs its Digital Experience ($5.9B). Microsoft shows a highly diversified portfolio, reducing concentration risk and leveraging infrastructure dominance. Adobe’s reliance on a dominant segment poses higher concentration risk but underscores its leadership in creative software.
Strengths and Weaknesses Comparison
This table compares the strengths and weaknesses of Microsoft Corporation and Adobe Inc. based on diversification, profitability, financials, innovation, global presence, and market share:
Microsoft Corporation Strengths
- Highly diversified revenue streams across cloud, gaming, enterprise, and devices
- Strong profitability with 36.15% net margin and 29.65% ROE
- Favorable leverage with low debt-to-assets and high interest coverage
- Robust global presence with nearly equal US and international sales
- Consistent innovation visible in cloud and enterprise services
Adobe Inc. Strengths
- Very high profitability with 61.34% ROE and 36.69% ROIC
- Strong innovation in digital media and experience segments
- Favorable debt-to-assets and interest coverage ratios
- Focused product mix with growing digital media revenue
- Global reach primarily in Americas and EMEA with Asia expansion
Microsoft Corporation Weaknesses
- Elevated valuation metrics with high P/E (36.31) and P/B (10.76) ratios
- Asset turnover below sector norms signals lower efficiency
- Modest dividend yield (0.65%) may deter income investors
- Neutral current ratio suggests average liquidity position
Adobe Inc. Weaknesses
- Higher WACC (10.6%) implies more expensive capital
- Unfavorable current ratio at 1.0 signals weaker liquidity
- No dividend yield limits income appeal
- Moderate product diversification compared to peers
Microsoft’s diversified business model underpins stable profitability and global scale but faces valuation and efficiency pressures. Adobe’s focused innovation and high returns impress, though liquidity and capital cost remain concerns. Both companies maintain slightly favorable financial profiles, guiding strategic priorities on capital management and market expansion.
The Moat Duel: Analyzing Competitive Defensibility
A structural moat is the only reliable barrier protecting long-term profits from relentless competitive erosion. Let’s examine how these two tech giants defend their turf:
Microsoft Corporation: Ecosystem Lock-in
Microsoft’s moat lies in its sprawling ecosystem and network effects, locking in users across productivity, cloud, and OS platforms. This drives a solid 13%+ ROIC above WACC despite a slight ROIC decline. Expansion in AI and cloud services promises to deepen this moat in 2026.
Adobe Inc.: Intangible Assets and Innovation
Adobe’s competitive edge stems from its intangible assets—strong brand, Creative Cloud subscriptions, and platform integration. Unlike Microsoft, Adobe’s ROIC soars with a 26%+ spread above WACC and growing profitability. Continued innovation in digital media and customer experience fuels this widening moat.
Ecosystem Lock-in vs. Intangible Asset Dominance
Adobe’s moat is deeper and more durable, driven by rising ROIC and premium intangible assets. Microsoft’s broad ecosystem remains robust but shows signs of margin compression. Adobe appears better positioned to defend and expand market share through innovation in 2026.
Which stock offers better returns?
Over the past 12 months, Microsoft’s stock gained 5.93%, showing a decelerating bullish trend, while Adobe’s stock fell sharply by 46.85%, reflecting a strong decelerating bearish trend.
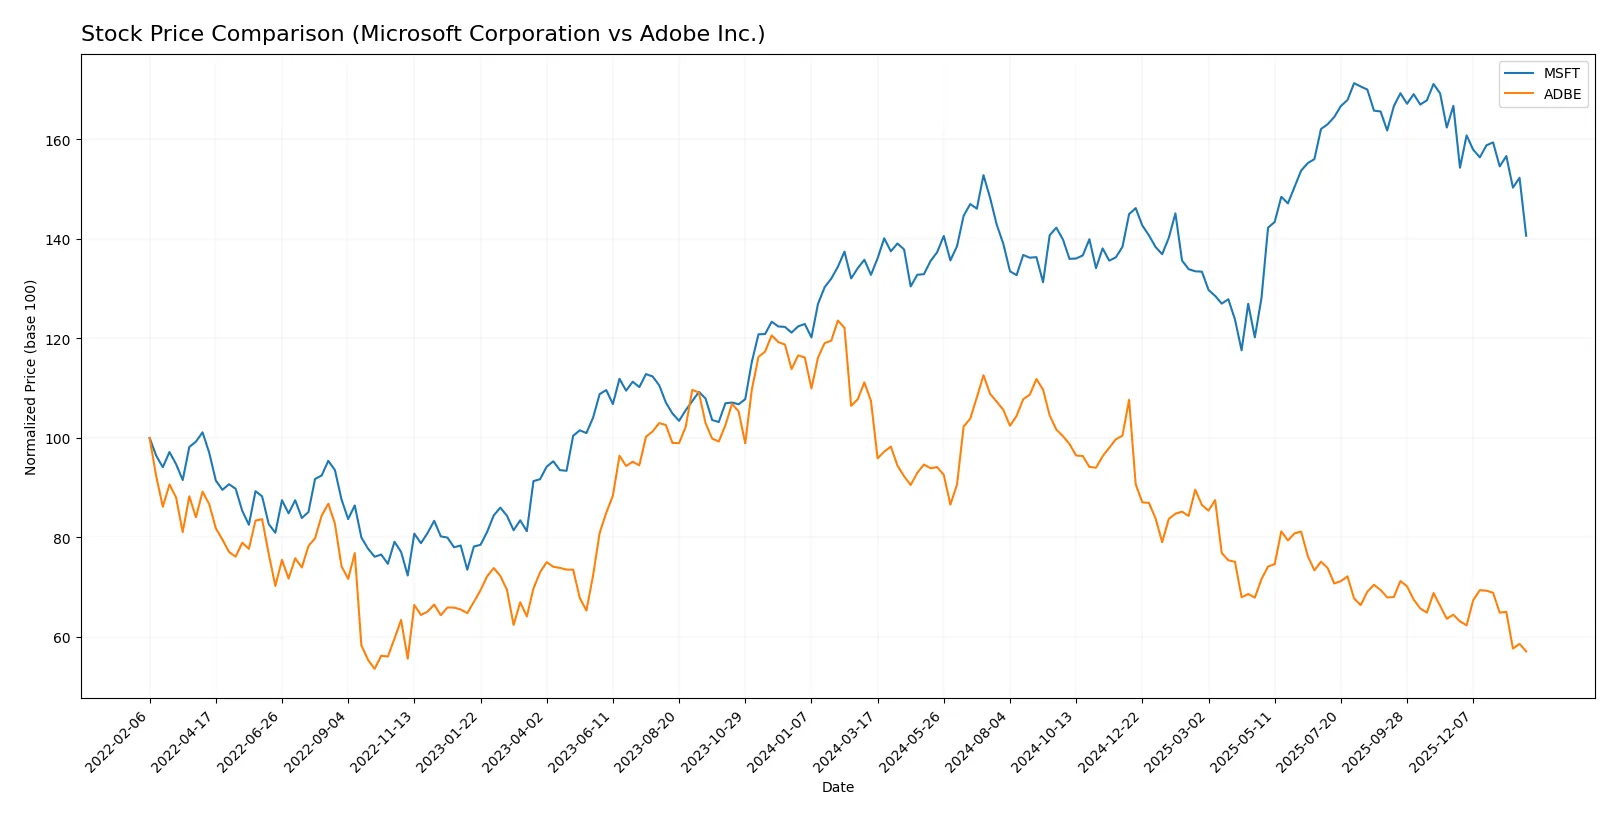
Trend Comparison
Microsoft’s stock rose 5.93% over the past year with a decelerating bullish trend, hitting a high of 524.11 and a low of 359.84. Volatility remained moderate at a 41.93 standard deviation.
Adobe’s stock dropped 46.85% over the same period, confirming a bearish trend with deceleration. Its price ranged from 578.34 to 293.25, accompanied by higher volatility at 78.57 standard deviation.
Microsoft outperformed Adobe by a significant margin in market performance over the past year, delivering positive returns while Adobe suffered steep losses.
Target Prices
Analysts project robust upside potential for Microsoft Corporation and Adobe Inc., reflecting strong confidence in their growth prospects.
| Company | Target Low | Target High | Consensus |
|---|---|---|---|
| Microsoft Corporation | 450 | 675 | 604.08 |
| Adobe Inc. | 280 | 500 | 390.31 |
Microsoft’s target consensus at 604.08 implies a 40% premium versus the current 430.29 price, signaling strong growth expectations. Adobe’s 390.31 consensus suggests roughly 33% upside from its 293.25 market price, highlighting solid analyst optimism.

Don’t Let Luck Decide Your Entry Point
Optimize your entry points with our advanced ProRealTime indicators. You’ll get efficient buy signals with precise price targets for maximum performance. Start outperforming now!
How do institutions grade them?
Microsoft Corporation Grades
The latest institutional grades for Microsoft Corporation show consistent positive sentiment:
| Grading Company | Action | New Grade | Date |
|---|---|---|---|
| Citigroup | Maintain | Buy | 2026-01-30 |
| Wells Fargo | Maintain | Overweight | 2026-01-29 |
| RBC Capital | Maintain | Outperform | 2026-01-29 |
| Stifel | Maintain | Buy | 2026-01-29 |
| Evercore ISI Group | Maintain | Outperform | 2026-01-29 |
| DA Davidson | Maintain | Buy | 2026-01-29 |
| Scotiabank | Maintain | Sector Outperform | 2026-01-29 |
| Keybanc | Maintain | Overweight | 2026-01-29 |
| Piper Sandler | Maintain | Overweight | 2026-01-29 |
| Cantor Fitzgerald | Maintain | Overweight | 2026-01-29 |
Adobe Inc. Grades
Adobe Inc.’s institutional grades reveal a mixed outlook with recent downgrades:
| Grading Company | Action | New Grade | Date |
|---|---|---|---|
| UBS | Maintain | Neutral | 2026-01-26 |
| Oppenheimer | Downgrade | Perform | 2026-01-13 |
| BMO Capital | Downgrade | Market Perform | 2026-01-09 |
| Jefferies | Downgrade | Hold | 2026-01-05 |
| Citigroup | Maintain | Neutral | 2025-12-17 |
| BMO Capital | Maintain | Outperform | 2025-12-15 |
| Keybanc | Downgrade | Underweight | 2025-12-15 |
| Wolfe Research | Maintain | Outperform | 2025-12-11 |
| TD Cowen | Maintain | Hold | 2025-12-11 |
| Oppenheimer | Maintain | Outperform | 2025-12-11 |
Which company has the best grades?
Microsoft holds consistently strong grades, mostly “Buy,” “Outperform,” and “Overweight.” Adobe shows recent downgrades to “Hold” and “Neutral.” Investors may interpret Microsoft’s grades as a stronger institutional vote of confidence.
Risks specific to each company
The following categories identify critical pressure points and systemic threats facing Microsoft Corporation and Adobe Inc. in the 2026 market environment:
1. Market & Competition
Microsoft Corporation
- Dominates cloud and productivity sectors but faces intense competition from AWS and Google Cloud.
Adobe Inc.
- Strong in creative software and digital experience but competes with emerging SaaS startups and legacy incumbents.
2. Capital Structure & Debt
Microsoft Corporation
- Low debt-to-equity (0.18), excellent interest coverage (53x), signaling robust financial stability.
Adobe Inc.
- Higher debt-to-equity (0.57) and moderate debt risk; interest coverage still solid (34x) but less conservative.
3. Stock Volatility
Microsoft Corporation
- Beta of 1.07, close to market average, indicating moderate volatility aligned with tech sector norms.
Adobe Inc.
- Higher beta at 1.53, suggesting greater sensitivity to market swings and elevated risk for investors.
4. Regulatory & Legal
Microsoft Corporation
- Faces scrutiny over antitrust and privacy regulations globally due to size and market dominance.
Adobe Inc.
- Regulatory risks exist but less exposed; focus on data privacy compliance in digital experience products.
5. Supply Chain & Operations
Microsoft Corporation
- Diversified supply chain with some hardware exposure (Surface, Xbox); resilient but vulnerable to chip shortages.
Adobe Inc.
- Primarily software-based with fewer supply chain dependencies, lowering operational risk in logistics.
6. ESG & Climate Transition
Microsoft Corporation
- Aggressive ESG initiatives and carbon neutrality commitments; reputational risk high if goals slip.
Adobe Inc.
- ESG efforts growing but less publicized; climate transition risks moderate due to software focus.
7. Geopolitical Exposure
Microsoft Corporation
- Significant global footprint including China; exposed to geopolitical tensions and trade restrictions.
Adobe Inc.
- Also global but with smaller scale; geopolitical risks present but less pronounced than Microsoft.
Which company shows a better risk-adjusted profile?
Microsoft’s strongest risk is regulatory and geopolitical pressure tied to its global dominance and diversified product base. Adobe’s key risk is its elevated stock volatility and higher leverage, which can strain financial flexibility in downturns. Microsoft’s lower beta and robust capital structure provide a more resilient risk-adjusted profile. The recent data confirms Microsoft’s superior interest coverage and safer debt levels, justifying my preference for its stability in a turbulent market.
Final Verdict: Which stock to choose?
Microsoft’s superpower lies in its unmatched scale and steady cash generation, fueling continuous innovation across cloud and software. Its slight margin compression and declining ROIC trend warrant vigilance. It fits well in portfolios seeking stable, long-term growth anchored by a tech giant’s fortress.
Adobe commands a strategic moat through its high-margin recurring revenue and rapidly growing ROIC, signaling a durable competitive advantage. Though its balance sheet shows tighter liquidity, Adobe offers a stronger growth trajectory with more pronounced profitability gains. It suits investors favoring Growth at a Reasonable Price (GARP).
If you prioritize resilient scale and consistent cash flow, Microsoft is the compelling choice due to its proven value creation despite slowing ROIC. However, if you seek accelerating profitability and a durable moat with higher growth potential, Adobe offers better upside, albeit with elevated risks. Both represent slightly favorable scenarios aligned with distinct investor profiles.
Disclaimer: Investment carries a risk of loss of initial capital. The past performance is not a reliable indicator of future results. Be sure to understand risks before making an investment decision.
Go Further
I encourage you to read the complete analyses of Microsoft Corporation and Adobe Inc. to enhance your investment decisions: