Home > Comparison > Technology > NOW vs TTAN
The strategic rivalry between ServiceNow, Inc. and ServiceTitan, Inc. shapes the trajectory of enterprise software innovation. ServiceNow operates as a large-scale cloud workflow automation leader, while ServiceTitan targets field service management with a leaner, specialized approach. This head-to-head pits a market-dominant platform against a high-growth niche player. This analysis will identify which company’s business model delivers superior risk-adjusted returns for a diversified portfolio in the evolving technology sector.
Table of contents
Companies Overview
ServiceNow and ServiceTitan stand as pivotal players in the software application market, each shaping enterprise and field service operations.
ServiceNow, Inc.: Enterprise Workflow Automation Leader
ServiceNow dominates the enterprise cloud computing space with its Now platform. It generates revenue by automating workflows across IT, HR, security, and customer service. In 2026, it strategically prioritized expanding AI-driven process automation and deepening partnerships like Celonis to enhance customer workflow insights.
ServiceTitan, Inc.: Field Service Software Innovator
ServiceTitan specializes in software for managing field service operations in residential and commercial infrastructure. Its core revenue comes from subscription-based solutions that streamline installation, maintenance, and service workflows. The company’s 2026 focus remains on scaling its footprint in essential service segments and optimizing field service productivity.
Strategic Collision: Similarities & Divergences
Both companies excel in workflow automation but serve distinct markets—ServiceNow targets broad enterprise needs while ServiceTitan zeroes in on field services. Their competition centers on capturing automation budgets, with ServiceNow’s broad platform contrasting ServiceTitan’s niche specialization. Their investment profiles differ sharply: ServiceNow boasts a mature, diversified base; ServiceTitan offers growth potential in a focused vertical.
Income Statement Comparison
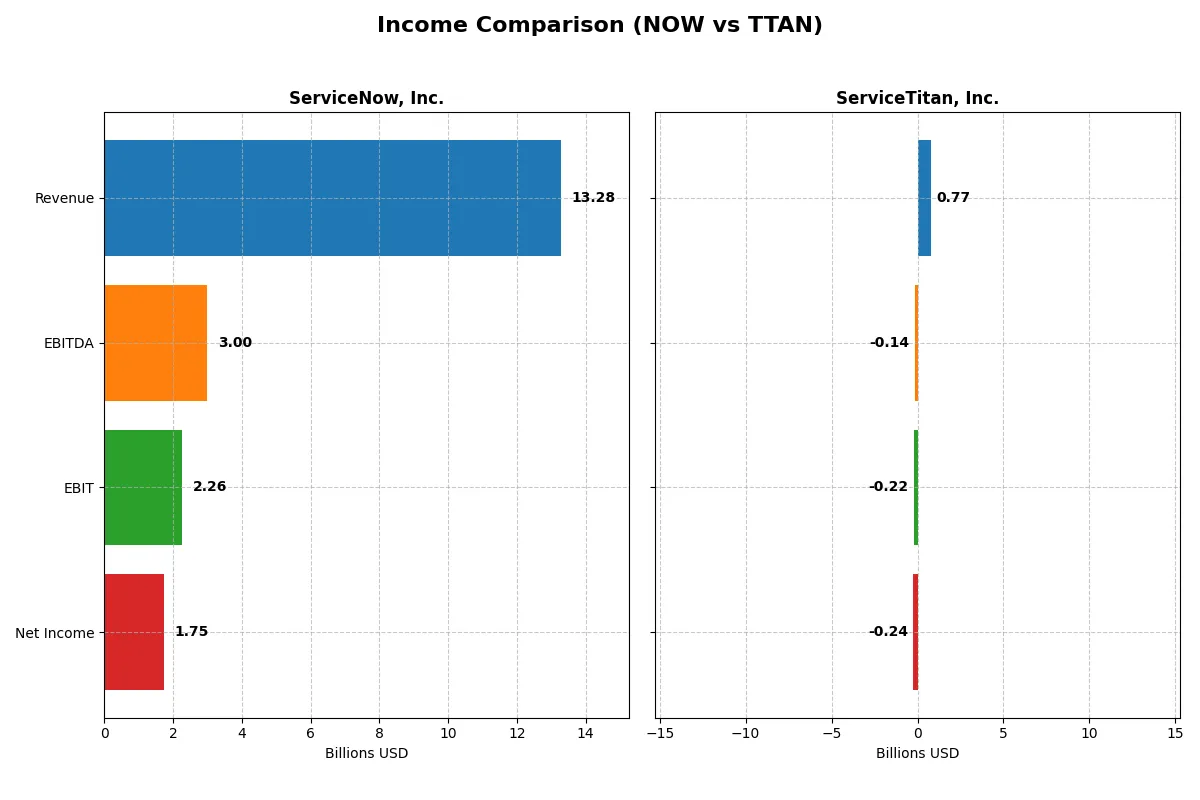
The following data dissects the core profitability and scalability of both corporate engines to reveal who dominates the bottom line:
| Metric | ServiceNow (NOW) | ServiceTitan (TTAN) |
|---|---|---|
| Revenue | 13.3B | 772M |
| Cost of Revenue | 3.0B | 271M |
| Operating Expenses | 8.5B | 731M |
| Gross Profit | 10.3B | 501M |
| EBITDA | 3.0B | -141M |
| EBIT | 2.3B | -221M |
| Interest Expense | 0 | 16M |
| Net Income | 1.7B | -239M |
| EPS | 1.69 | -8.53 |
| Fiscal Year | 2025 | 2025 |
Income Statement Analysis: The Bottom-Line Duel
This income statement comparison reveals the true operational efficiency and profitability of ServiceNow, Inc. and ServiceTitan, Inc.
ServiceNow, Inc. Analysis
ServiceNow’s revenue climbed sharply from 5.9B in 2021 to 13.3B in 2025, reflecting robust growth. Net income surged from 230M to 1.75B, signaling strong bottom-line momentum. Its gross margin remains healthy at 77.5%, and net margin steady at 13.2%. The company improved EBIT margin to 17%, showcasing operational efficiency and scaling power.
ServiceTitan, Inc. Analysis
ServiceTitan’s revenue grew from 468M in 2023 to 772M in 2025, a strong top-line increase. However, it posted widening net losses, with net margin at -31%, and EBIT margin deeply negative at -29%. Despite a favorable gross margin near 65%, operating expenses outpaced revenue gains, eroding profitability and causing consistent net losses.
Margin Strength vs. Growth Struggles
ServiceNow dominates with superior margin expansion and profitability, turning rapid revenue growth into strong net income gains. ServiceTitan shows promising revenue growth but struggles to control costs, resulting in persistent losses. For investors, ServiceNow’s efficient scale and profitability offer a clearer fundamental advantage over ServiceTitan’s high-growth yet unprofitable profile.
Financial Ratios Comparison
These vital ratios act as a diagnostic tool to expose the underlying fiscal health, valuation premiums, and capital efficiency of the companies compared below:
| Ratios | ServiceNow, Inc. (NOW) | ServiceTitan, Inc. (TTAN) |
|---|---|---|
| ROE | 13.5% | -16.4% |
| ROIC | 9.0% | -14.1% |
| P/E | 90.9 | -18.1 |
| P/B | 12.3 | 3.0 |
| Current Ratio | 0.95 | 3.74 |
| Quick Ratio | 0.95 | 3.74 |
| D/E | 0.25 | 0.11 |
| Debt-to-Assets | 12.3% | 9.4% |
| Interest Coverage | 0 | -14.8 |
| Asset Turnover | 0.51 | 0.44 |
| Fixed Asset Turnover | 4.29 | 9.57 |
| Payout Ratio | 0 | 0 |
| Dividend Yield | 0 | 0 |
| Fiscal Year | 2025 | 2025 |
Efficiency & Valuation Duel: The Vital Signs
Financial ratios serve as a company’s DNA, exposing hidden risks and operational strengths that guide investors’ understanding of performance.
ServiceNow, Inc.
ServiceNow shows solid core profitability with a 13.48% ROE and a favorable 13.16% net margin, reflecting operational efficiency. However, its valuation appears stretched, with a high P/E of 90.88 and P/B of 12.25. The company does not pay dividends, instead reinvesting heavily in R&D to fuel growth and maintain its competitive edge.
ServiceTitan, Inc.
ServiceTitan struggles with negative profitability metrics: a -16.44% ROE and -30.98% net margin indicate operational challenges. Its P/E is negative but considered favorable due to market conditions. The firm maintains a strong balance sheet with a quick ratio of 3.74 and low debt, focusing on growth investments over shareholder payouts amid ongoing losses.
Valuation Stretch vs. Profitability Struggles
ServiceNow balances operational efficiency with a premium valuation, while ServiceTitan faces profitability headwinds despite a healthier liquidity position. Investors seeking growth at a high price may prefer ServiceNow; those prioritizing balance sheet strength amid losses might consider ServiceTitan’s profile.
Which one offers the Superior Shareholder Reward?
I see ServiceNow (NOW) and ServiceTitan (TTAN) both pay no dividends, focusing instead on growth reinvestment. NOW’s steady free cash flow (4.4/share in 2025) supports a robust buyback program implied by its strong cash and capital structure. TTAN struggles with negative margins and minimal free cash flow (0.37/share), limiting buybacks. NOW’s distribution model is more sustainable, balancing reinvestment with shareholder returns through buybacks. TTAN’s losses and volatile cash flows increase risk for shareholders. I conclude NOW offers a far superior total shareholder reward in 2026.
Comparative Score Analysis: The Strategic Profile
The radar chart captures the fundamental DNA and trade-offs defining ServiceNow and ServiceTitan’s financial and valuation profiles:
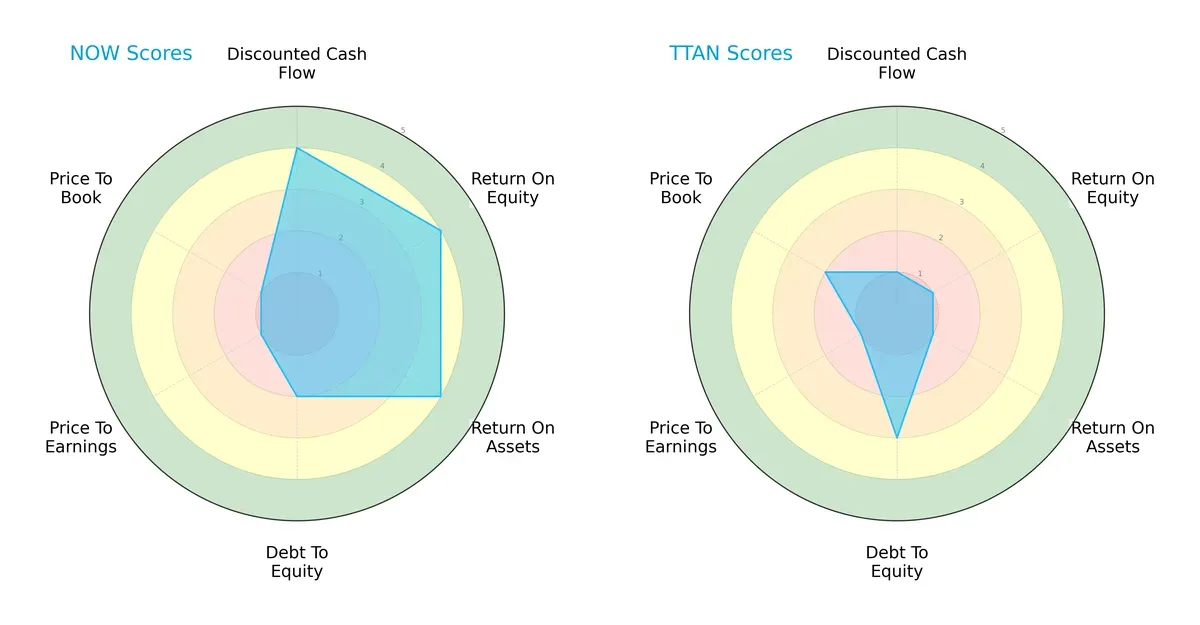
ServiceNow dominates in DCF, ROE, and ROA with scores of 4 each, signaling efficient capital use and solid profitability. However, it carries a heavier debt load (Debt/Equity score 2) and suffers from weak valuation metrics (P/E and P/B scores at 1). ServiceTitan, conversely, shows weaker operational metrics (all scores at 1) but maintains a slightly better debt position (Debt/Equity score 3) and marginally stronger book valuation (P/B score 2). ServiceNow offers a more balanced operational profile; ServiceTitan depends on modest leverage advantages but lacks profitability strength.
—
Bankruptcy Risk: Solvency Showdown
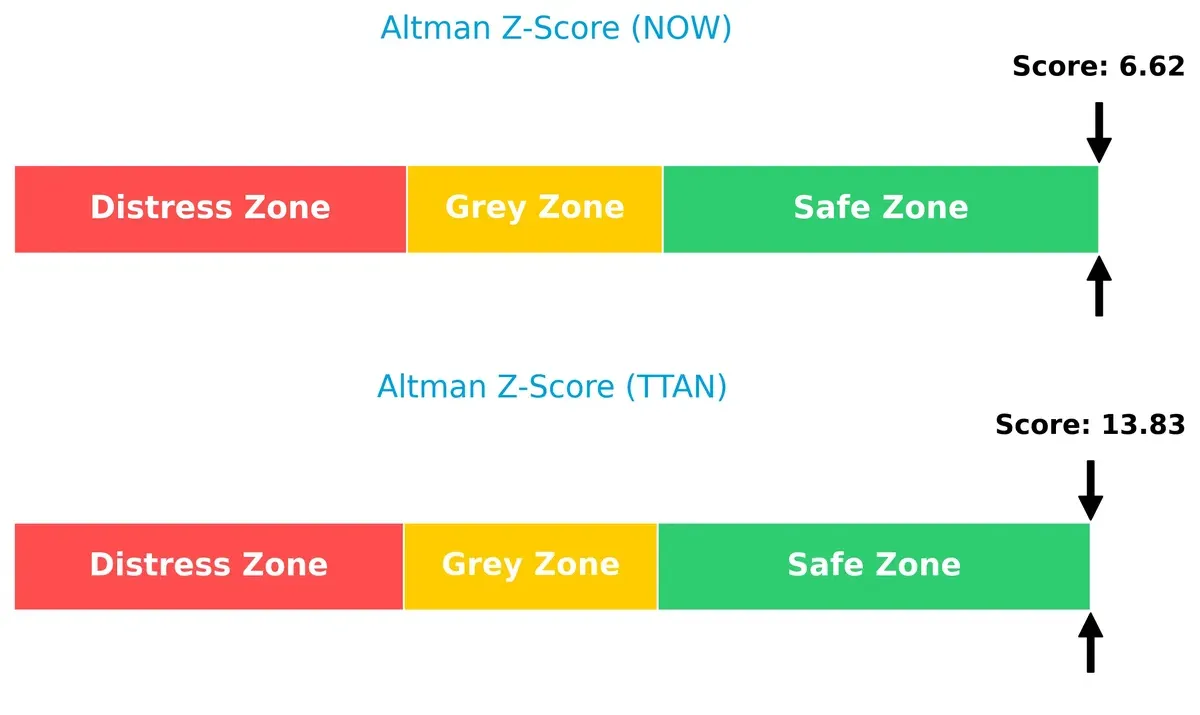
ServiceTitan’s Altman Z-Score (13.8) far exceeds ServiceNow’s (6.6), both well within the safe zone, indicating robust solvency but highlighting ServiceTitan’s superior buffer against financial distress in this cycle:
—
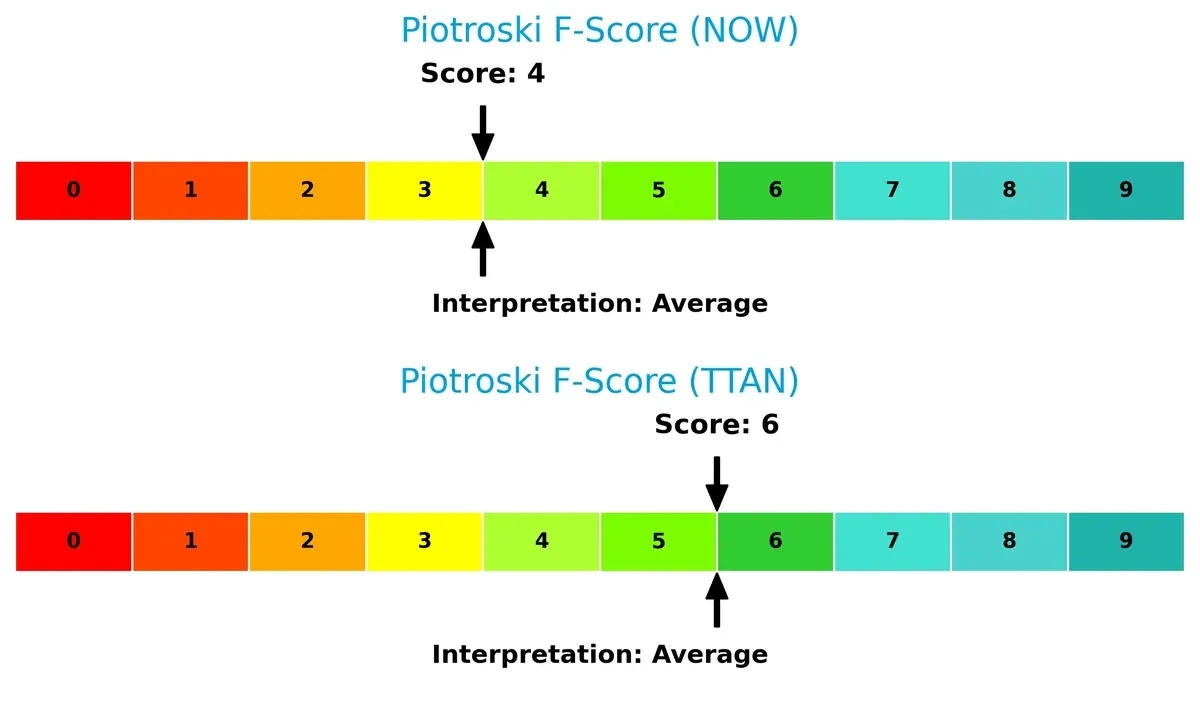
Financial Health: Quality of Operations
ServiceTitan’s Piotroski F-Score of 6 surpasses ServiceNow’s 4, suggesting stronger internal financial health. ServiceNow’s lower score flags potential red flags in profitability or efficiency metrics relative to ServiceTitan:
How are the two companies positioned?
This section dissects the operational DNA of ServiceNow and ServiceTitan by comparing their revenue distribution and internal dynamics. The goal is to confront their economic moats to reveal which model offers the most resilient and sustainable competitive advantage today.
Revenue Segmentation: The Strategic Mix
This comparison dissects how ServiceNow and ServiceTitan diversify income streams, revealing their primary sector bets and strategic focus in 2025:
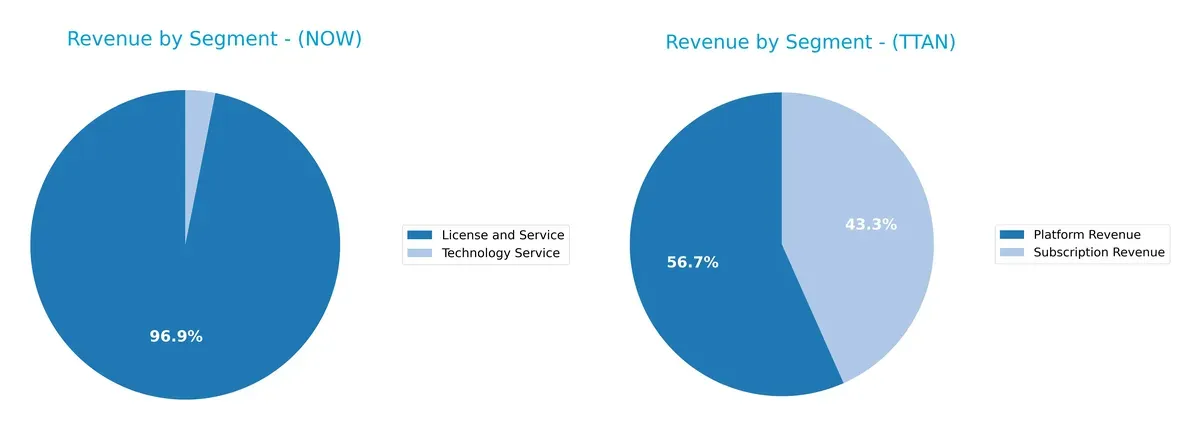
ServiceNow’s revenue dwarfs ServiceTitan’s, anchored by $12.9B in License and Service plus $414M in Technology Service. ServiceTitan shows a more balanced split between Platform ($739M) and Subscription ($566M) revenues. ServiceNow’s heavy concentration signals ecosystem lock-in and infrastructure dominance but risks overreliance on digital workflow licensing. ServiceTitan’s diversified model reduces concentration risk but limits scale compared to ServiceNow’s commanding market presence.
Strengths and Weaknesses Comparison
This table compares the strengths and weaknesses of ServiceNow, Inc. and ServiceTitan, Inc.:
ServiceNow Strengths
- Strong profitability with 13.16% net margin
- Favorable low debt ratios and infinite interest coverage
- Diversified global revenue with significant North America and EMEA presence
- High fixed asset turnover of 4.29
ServiceTitan Strengths
- Favorable low cost of capital with 5.02% WACC
- Positive valuation metrics with PE and PB favorable or neutral
- Strong quick ratio of 3.74 indicating liquidity
- Low debt and debt-to-assets ratios
- High fixed asset turnover of 9.57
ServiceNow Weaknesses
- Unfavorable valuation multiples with PE at 90.88 and PB at 12.25
- Current ratio below 1, signaling liquidity concerns
- No dividend yield
- Neutral returns on equity and invested capital
- Moderate asset turnover at 0.51
ServiceTitan Weaknesses
- Negative profitability metrics with net margin at -30.98% and ROE at -16.44%
- Negative interest coverage showing risk to debt servicing
- Unfavorable asset turnover at 0.44
- Current ratio unusually high at 3.74, which may indicate inefficient working capital use
- No dividend yield
ServiceNow exhibits solid profitability and global diversification but faces valuation and liquidity pressures. ServiceTitan shows financial strength in capital structure and liquidity but struggles with profitability and operational efficiency. Both companies must balance growth and risk carefully to sustain competitive advantage.
The Moat Duel: Analyzing Competitive Defensibility
A structural moat is the only true shield protecting long-term profits from relentless competition erosion in dynamic markets:
ServiceNow, Inc.: Workflow Automation Lock-in
I see ServiceNow’s moat built on high switching costs and deep enterprise integration. Its 77.5% gross margin and growing ROIC reflect margin stability and operational strength. Expansion in AI-driven workflow tools in 2026 should deepen this advantage.
ServiceTitan, Inc.: Niche Field Service Focus
ServiceTitan relies on specialized field service software, contrasting with ServiceNow’s broad enterprise scope. It shows rapid revenue growth but weak profitability and a negative ROIC trend, signaling a fragile moat. Scaling into new verticals could disrupt its market position.
Moat Battle: Enterprise Depth vs. Niche Agility
ServiceNow possesses a wider, more sustainable moat anchored in sticky enterprise workflows and strong capital returns. ServiceTitan’s moat is narrower and less proven, leaving it more vulnerable to competitive pressures. ServiceNow stands better poised to defend market share long term.
Which stock offers better returns?
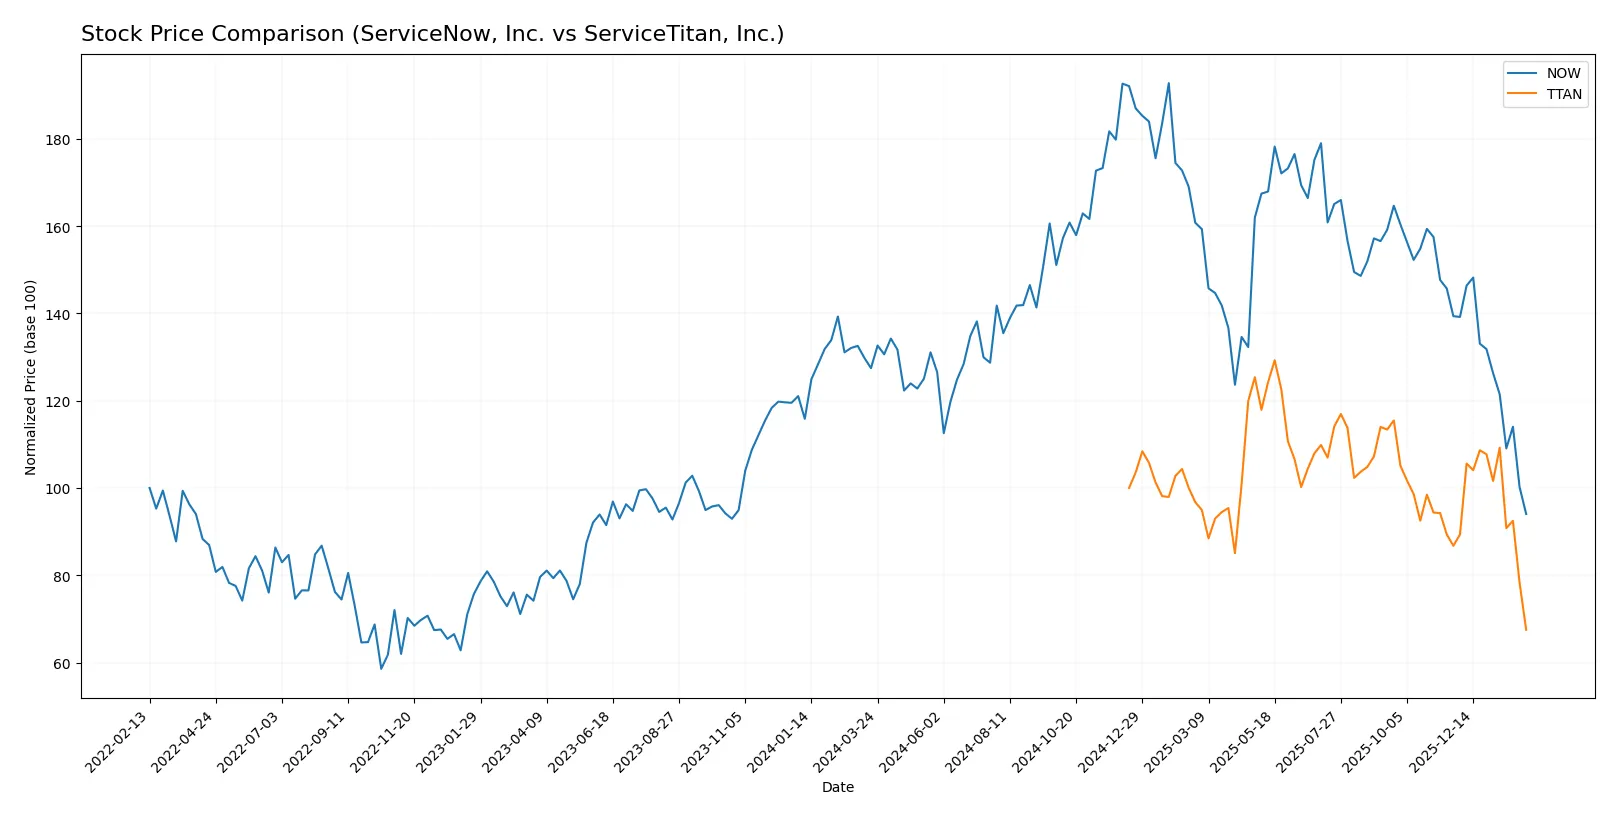
Both ServiceNow, Inc. and ServiceTitan, Inc. experienced significant price declines over the past year, with persistent bearish trends and decelerating momentum in their stock prices.
Trend Comparison
ServiceNow’s stock fell 26.22% over the past 12 months, showing a bearish trend with decelerating losses. It ranged between $109.77 and $225.00, reflecting high volatility (std. dev. 25.07).
ServiceTitan’s stock dropped 32.49% in the same period, also bearish with deceleration. It traded between $67.51 and $129.26, exhibiting lower volatility (std. dev. 11.23) than ServiceNow.
Between the two, ServiceNow outperformed ServiceTitan, delivering a smaller percentage decline and larger price range, despite both suffering bearish trends over the past year.
Target Prices
Analysts present a broad target consensus reflecting mixed expectations for ServiceNow, Inc. and ServiceTitan, Inc.
| Company | Target Low | Target High | Consensus |
|---|---|---|---|
| ServiceNow, Inc. | 115 | 1,315 | 440.64 |
| ServiceTitan, Inc. | 117 | 145 | 130.89 |
ServiceNow’s consensus target vastly exceeds its current 109.77 price, suggesting significant upside potential despite recent volatility. ServiceTitan’s target consensus near 130.89 also implies upside from its 67.51 price, signaling optimism in its growth trajectory.

Don’t Let Luck Decide Your Entry Point
Optimize your entry points with our advanced ProRealTime indicators. You’ll get efficient buy signals with precise price targets for maximum performance. Start outperforming now!
How do institutions grade them?
This section compares the latest institutional grades for ServiceNow, Inc. and ServiceTitan, Inc.:
ServiceNow, Inc. Grades
The following table summarizes recent grades from major financial institutions for ServiceNow, Inc.:
| Grading Company | Action | New Grade | Date |
|---|---|---|---|
| Citigroup | Maintain | Buy | 2026-01-30 |
| Evercore ISI Group | Maintain | Outperform | 2026-01-29 |
| Macquarie | Maintain | Neutral | 2026-01-29 |
| BTIG | Maintain | Buy | 2026-01-29 |
| RBC Capital | Maintain | Outperform | 2026-01-29 |
| Keybanc | Maintain | Underweight | 2026-01-29 |
| Stifel | Maintain | Buy | 2026-01-29 |
| DA Davidson | Maintain | Buy | 2026-01-29 |
| Cantor Fitzgerald | Maintain | Overweight | 2026-01-29 |
| Needham | Maintain | Buy | 2026-01-29 |
ServiceTitan, Inc. Grades
Below are the latest grades from reputable institutions for ServiceTitan, Inc.:
| Grading Company | Action | New Grade | Date |
|---|---|---|---|
| Piper Sandler | Maintain | Overweight | 2026-02-03 |
| Morgan Stanley | Maintain | Equal Weight | 2025-12-05 |
| Piper Sandler | Maintain | Overweight | 2025-12-05 |
| BMO Capital | Maintain | Outperform | 2025-12-05 |
| TD Cowen | Maintain | Buy | 2025-12-05 |
| BMO Capital | Maintain | Outperform | 2025-11-20 |
| Wells Fargo | Maintain | Overweight | 2025-09-19 |
| Piper Sandler | Maintain | Overweight | 2025-09-19 |
| Stifel | Maintain | Buy | 2025-09-19 |
| Canaccord Genuity | Maintain | Buy | 2025-09-19 |
Which company has the best grades?
ServiceNow, Inc. and ServiceTitan, Inc. both receive predominantly positive grades. ServiceNow displays several Buy and Outperform ratings, but also some Neutral and Underweight marks. ServiceTitan maintains mostly Overweight, Buy, and Outperform grades, indicating slightly stronger consensus support. Investors may interpret these nuances when assessing relative confidence in each stock’s prospects.
Risks specific to each company
The following categories identify the critical pressure points and systemic threats facing both firms in the 2026 market environment:
1. Market & Competition
ServiceNow, Inc. (NOW)
- Established with strong enterprise cloud platform; faces intense competition from large tech firms.
ServiceTitan, Inc. (TTAN)
- Smaller player focusing on field service software; competing against niche and emerging startups.
2. Capital Structure & Debt
ServiceNow, Inc. (NOW)
- Low debt-to-equity (0.25) and debt-to-assets (12.3%) show conservative leverage.
ServiceTitan, Inc. (TTAN)
- Even lower leverage with debt-to-equity at 0.11 and debt-to-assets at 9.35%, indicating financial prudence.
3. Stock Volatility
ServiceNow, Inc. (NOW)
- Beta near 1 (0.978) implies market-level volatility; price range wide from 108 to 211.
ServiceTitan, Inc. (TTAN)
- Negative beta (-0.86) indicates inverse correlation with the market; price range narrower but with sharp recent declines.
4. Regulatory & Legal
ServiceNow, Inc. (NOW)
- Subject to data privacy and cloud service regulations; large scale mitigates individual legal shocks.
ServiceTitan, Inc. (TTAN)
- Regulatory exposure similar but smaller scale increases vulnerability to compliance costs and litigations.
5. Supply Chain & Operations
ServiceNow, Inc. (NOW)
- Cloud-based delivery limits physical supply chain risks; operational scale supports stability.
ServiceTitan, Inc. (TTAN)
- Operations tied to field service infrastructure; potentially more sensitive to hardware and service disruptions.
6. ESG & Climate Transition
ServiceNow, Inc. (NOW)
- Larger firm with resources to invest in ESG initiatives; faces investor scrutiny on sustainability.
ServiceTitan, Inc. (TTAN)
- Smaller firm with less ESG reporting; may face challenges adapting to climate-related regulatory trends.
7. Geopolitical Exposure
ServiceNow, Inc. (NOW)
- Global footprint exposes it to geopolitical tensions, but diversification reduces single-market risk.
ServiceTitan, Inc. (TTAN)
- Primarily US-focused, limiting international geopolitical risks but increasing domestic policy exposure.
Which company shows a better risk-adjusted profile?
ServiceNow’s established market position and balanced leverage offer a more stable risk profile. ServiceTitan’s negative profitability and volatile stock signal higher execution and financial risks. ServiceNow’s safe Altman Z-Score (6.6) versus ServiceTitan’s stronger Z-Score (13.8) reflects nuanced financial resilience, but ServiceTitan’s negative margins and interest coverage amplify caution. The critical risk for ServiceNow lies in valuation extremes, with a P/E of 90.9 straining downside risk. For ServiceTitan, persistent negative profitability and poor coverage ratios dominate concerns. Overall, ServiceNow presents a better risk-adjusted profile amid 2026’s tech sector volatility.
Final Verdict: Which stock to choose?
ServiceNow, Inc. commands its niche with unmatched operational efficiency and a steadily growing profitability profile. Its rising ROIC hints at improving capital allocation and value creation. A point of vigilance remains its stretched valuation multiples and suboptimal liquidity, which could pressure returns in market downturns. It suits an Aggressive Growth portfolio seeking long-term innovation plays.
ServiceTitan, Inc. holds a strategic moat in its specialized SaaS platform tailored for trade services, benefiting from recurring revenue streams. Compared to ServiceNow, it offers a stronger liquidity buffer but suffers from persistent profitability challenges and negative returns on capital. It fits a GARP (Growth at a Reasonable Price) profile willing to accept higher risk for potential market disruption.
If you prioritize steady value creation and operational excellence, ServiceNow outshines due to its improving profitability and market leadership. However, if you seek exposure to a high-growth, niche SaaS player with a more conservative balance sheet, ServiceTitan offers better stability despite current profitability headwinds. Both choices present distinct risk-reward profiles aligned with different investor appetites.
Disclaimer: Investment carries a risk of loss of initial capital. The past performance is not a reliable indicator of future results. Be sure to understand risks before making an investment decision.
Go Further
I encourage you to read the complete analyses of ServiceNow, Inc. and ServiceTitan, Inc. to enhance your investment decisions: