Home > Comparison > Technology > NOW vs MNDY
The strategic rivalry between ServiceNow, Inc. and monday.com Ltd. shapes the evolution of enterprise software applications. ServiceNow operates as a sprawling, capital-intensive cloud platform automating complex workflows across industries. In contrast, monday.com offers a nimble, modular work operating system emphasizing user-friendly customization. This analysis pits scale against agility to identify which corporate trajectory delivers the superior risk-adjusted return for diversified portfolios amid ongoing digital transformation.
Table of contents
Companies Overview
ServiceNow and monday.com stand as influential players reshaping enterprise software workflows globally.
ServiceNow, Inc.: Enterprise Workflow Automation Leader
ServiceNow dominates the enterprise cloud computing market by automating workflows across IT, HR, security, and customer service. Its core revenue comes from subscription-based access to the Now platform, featuring AI, robotic process automation, and performance analytics. In 2026, the company emphasizes strategic partnerships like Celonis to enhance process automation capabilities and expand its service ecosystem.
monday.com Ltd.: Visual Work OS Innovator
monday.com leads in providing a modular cloud-based Work OS that enables businesses to build custom work management applications. Its revenue primarily derives from subscription fees for its flexible platform serving marketing, CRM, and project management needs. The firm focuses on broadening global reach and diversifying product solutions to capture more enterprise and institutional users in 2026.
Strategic Collision: Similarities & Divergences
Both firms operate in enterprise software but diverge sharply in philosophy: ServiceNow offers a comprehensive workflow automation ecosystem, while monday.com delivers an open, modular platform for customizable solutions. They compete primarily for workflow management market share, targeting large enterprises versus agile teams respectively. This contrast creates distinct investment profiles, with ServiceNow reflecting scale and integration and monday.com embodying flexibility and innovation.
Income Statement Comparison
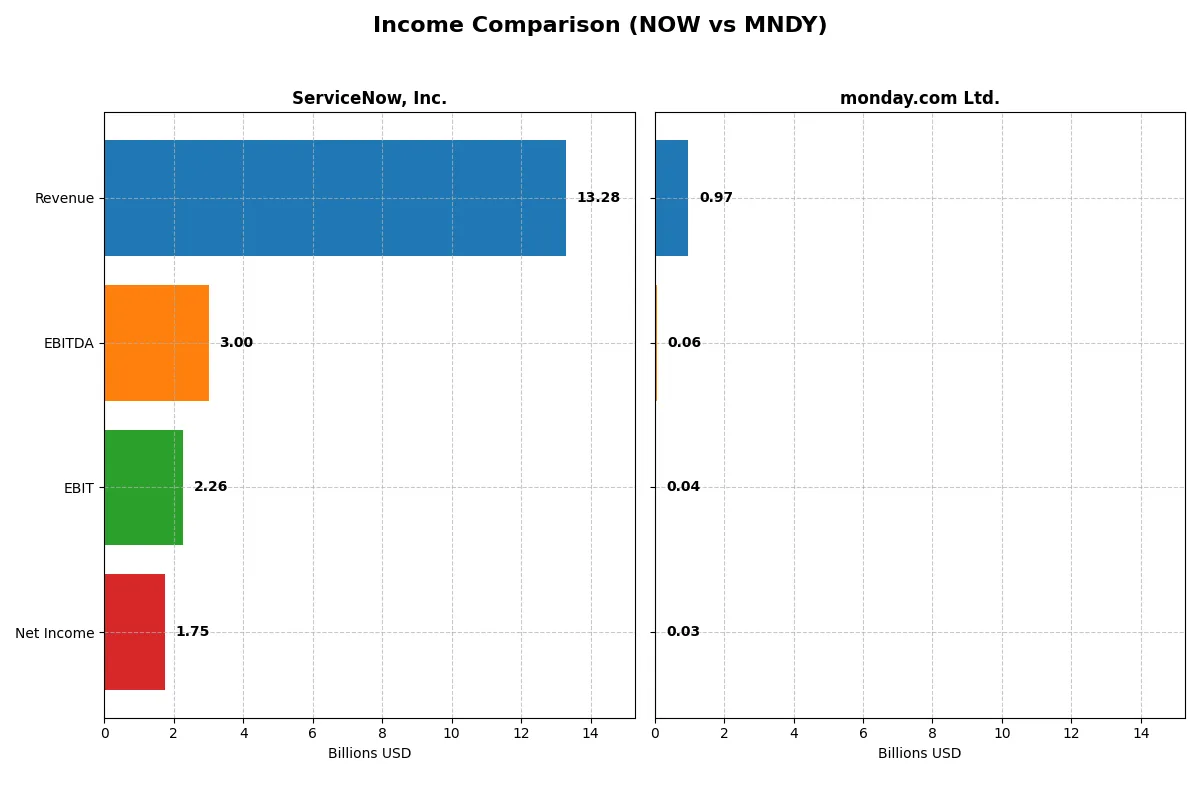
This data dissects the core profitability and scalability of both corporate engines to reveal who dominates the bottom line:
| Metric | ServiceNow, Inc. (NOW) | monday.com Ltd. (MNDY) |
|---|---|---|
| Revenue | 13.3B | 972M |
| Cost of Revenue | 3.0B | 104M |
| Operating Expenses | 8.5B | 889M |
| Gross Profit | 10.3B | 868M |
| EBITDA | 3.0B | 58M |
| EBIT | 2.3B | 40M |
| Interest Expense | 0 | 0 |
| Net Income | 1.7B | 32M |
| EPS | 1.69 | 0.65 |
| Fiscal Year | 2025 | 2024 |
Income Statement Analysis: The Bottom-Line Duel
This income statement comparison reveals which company operates with superior efficiency and sustainable profitability in their respective markets.
ServiceNow, Inc. Analysis
ServiceNow’s revenue surged from $5.9B in 2021 to $13.3B in 2025, with net income growing from $230M to $1.75B. The company maintains a robust gross margin around 77.5% and a solid net margin of 13.2%. In 2025, its EBIT margin improved to 17%, signaling efficient cost control and strong operational momentum.
monday.com Ltd. Analysis
monday.com expanded revenue from $161M in 2020 to nearly $972M in 2024, with net income swinging from a loss of $152M to a positive $32M. It boasts a higher gross margin of 89%, yet its net margin lingers at a modest 3.3%. The 2024 EBIT margin of 4.1% reflects ongoing scaling challenges despite rapid growth.
Margin Strength vs. Growth Scale
ServiceNow dominates in absolute scale and margin strength, delivering consistent profitability with expanding operational efficiency. monday.com impresses with rapid revenue growth and margin improvement but remains in early profit stages with thinner net margins. Investors seeking robust profitability may favor ServiceNow’s mature profile, while growth-oriented investors might monitor monday.com’s scaling trajectory.
Financial Ratios Comparison
These vital ratios act as a diagnostic tool to expose the underlying fiscal health, valuation premiums, and capital efficiency of the companies compared below:
| Ratios | ServiceNow, Inc. (NOW) | monday.com Ltd. (MNDY) |
|---|---|---|
| ROE | 13.5% | 3.1% |
| ROIC | 9.0% | -1.7% |
| P/E | 90.9 | 363.0 |
| P/B | 12.3 | 11.4 |
| Current Ratio | 0.95 | 2.66 |
| Quick Ratio | 0.95 | 2.66 |
| D/E | 0.25 | 0.10 |
| Debt-to-Assets | 12.3% | 6.3% |
| Interest Coverage | 0 | 0 |
| Asset Turnover | 0.51 | 0.58 |
| Fixed Asset Turnover | 4.29 | 7.13 |
| Payout ratio | 0 | 0 |
| Dividend yield | 0 | 0 |
| Fiscal Year | 2025 | 2024 |
Efficiency & Valuation Duel: The Vital Signs
Financial ratios serve as a company’s DNA, unveiling hidden risks and operational efficiency that numbers alone cannot convey.
ServiceNow, Inc.
ServiceNow delivers solid profitability with a 13.48% ROE and a favorable 13.16% net margin, signaling operational strength. However, its valuation appears stretched, with an elevated P/E of 90.88 and P/B of 12.25. The company pays no dividend, opting instead to reinvest heavily in R&D, fueling future growth.
monday.com Ltd.
monday.com shows weaker profitability, with a 3.14% ROE and a 3.33% net margin, reflecting operational challenges. Its valuation is highly stretched, posting a P/E of 362.98 and a P/B of 11.41. The firm maintains a strong liquidity position but returns no dividends, focusing capital on scaling and innovation.
Premium Valuation vs. Operational Safety
ServiceNow balances moderate profitability with a premium valuation, while monday.com faces profitability headwinds despite liquidity strengths. Investors seeking operational quality may lean toward ServiceNow; those prioritizing liquidity and growth might consider monday.com’s riskier profile.
Which one offers the Superior Shareholder Reward?
I compare ServiceNow, Inc. (NOW) and monday.com Ltd. (MNDY) on shareholder returns. Neither pays dividends, so yield is zero for both. ServiceNow’s free cash flow per share stands at $4.41, supporting steady reinvestment and moderate buybacks. Its buyback intensity is moderate but consistent, reflecting capital discipline. monday.com posts higher free cash flow per share ($5.93) and runs a more aggressive buyback program, fueled by strong cash reserves ($29.3/share). However, monday.com’s profitability margins are thinner and more volatile, risking sustainability. I find ServiceNow’s balanced reinvestment and buyback approach offers a more reliable long-term total return in 2026.
Comparative Score Analysis: The Strategic Profile
The radar chart reveals the fundamental DNA and trade-offs of ServiceNow, Inc. and monday.com Ltd., highlighting their distinct operational strengths and valuation challenges:

ServiceNow boasts stronger profitability metrics with higher ROE and ROA scores (4 vs. 3), demonstrating superior asset and equity efficiency. monday.com maintains a moderate debt profile (debt-to-equity score of 3 vs. 2) but lags in returns. Both firms share very unfavorable valuation scores (P/E and P/B at 1), signaling overpricing risks. ServiceNow presents a more balanced profile, relying on operational excellence, while monday.com leans on moderate leverage.
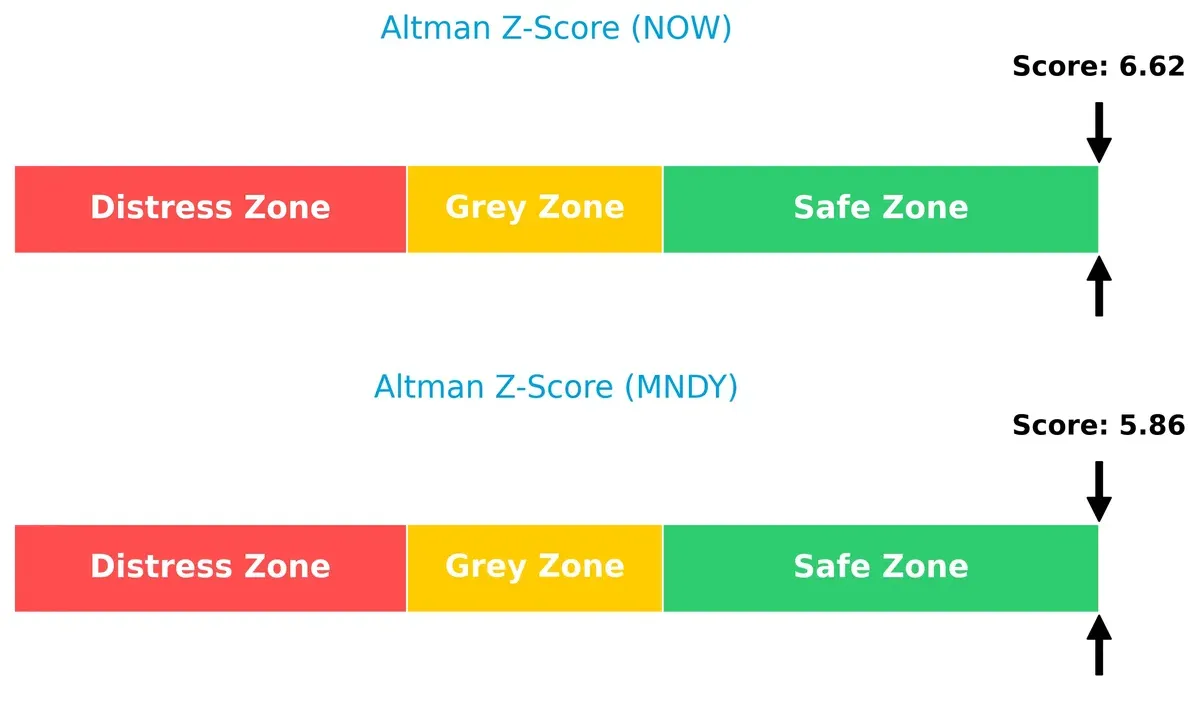
Bankruptcy Risk: Solvency Showdown
The Altman Z-Scores place both companies comfortably in the safe zone, with ServiceNow at 6.62 and monday.com at 5.86. This indicates robust financial stability for long-term survival in an uncertain market environment:
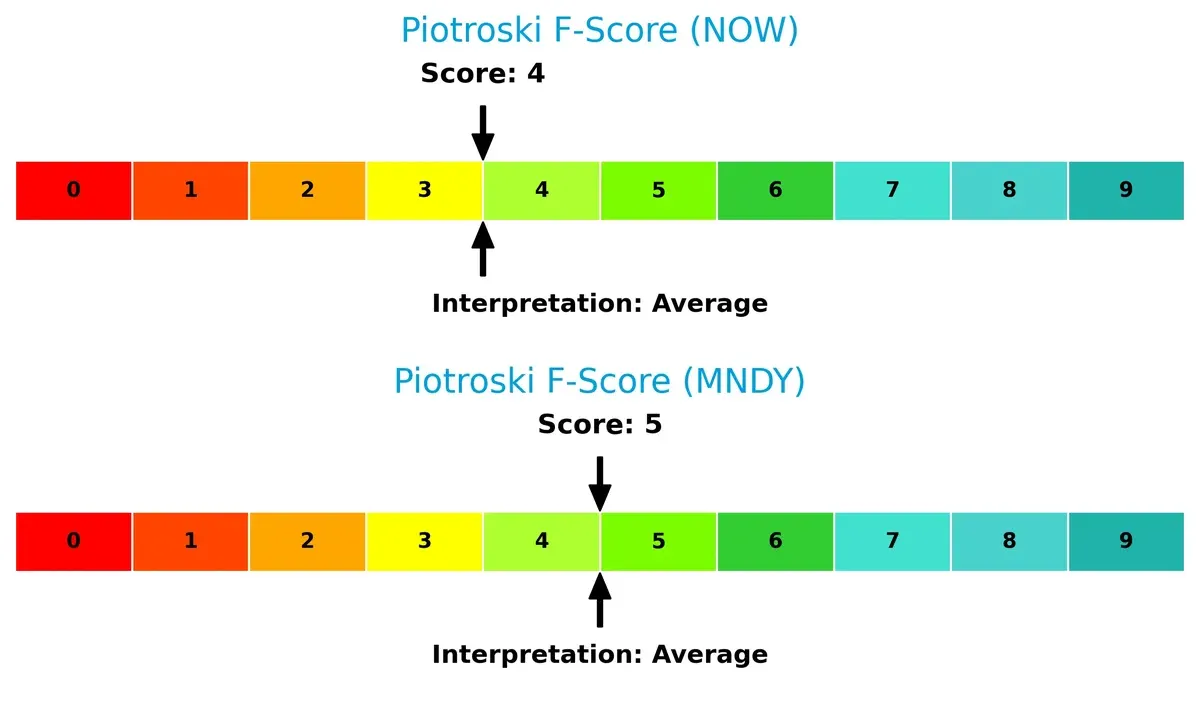
Financial Health: Quality of Operations
ServiceNow and monday.com show average Piotroski F-Scores of 4 and 5, respectively, reflecting moderate financial health. Neither company signals immediate red flags, but both must improve internal metrics to enhance operational quality:
How are the two companies positioned?
This section dissects the operational DNA of ServiceNow and monday.com by comparing their revenue distribution and internal dynamics—strengths and weaknesses. The goal is to confront their economic moats to identify the more resilient, sustainable competitive advantage in today’s market.
Revenue Segmentation: The Strategic Mix
The following visual comparison dissects how both firms diversify their income streams and where their primary sector bets lie:
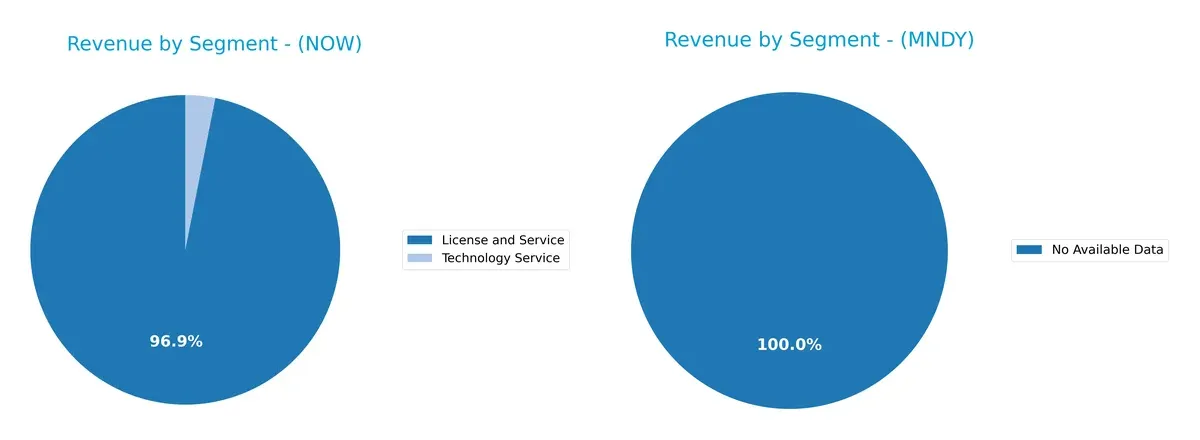
ServiceNow, Inc. anchors its revenue heavily on License and Service segments, with $12.9B in 2025 primarily from Digital Workflow and ITOM products. monday.com Ltd. lacks available data, preventing segmentation analysis. ServiceNow’s concentrated revenue mix signals strong ecosystem lock-in but also concentration risk if product demand shifts. Historically, this focus has supported robust infrastructure dominance within enterprise workflow software.
Strengths and Weaknesses Comparison
This table compares the strengths and weaknesses of ServiceNow, Inc. (NOW) and monday.com Ltd. (MNDY):
NOW Strengths
- Strong global presence with significant revenue from North America, EMEA, and Asia Pacific
- Favorable net margin at 13.16%
- Low debt to assets ratio at 12.3%
- High fixed asset turnover of 4.29
- Infinite interest coverage indicates strong ability to service debt
MNDY Strengths
- Strong liquidity with current and quick ratios of 2.66
- Low debt to assets at 6.29% and favorable debt to equity of 0.1
- High fixed asset turnover of 7.13
- Infinite interest coverage reflects solid debt servicing capacity
NOW Weaknesses
- Unfavorable valuation multiples: PE at 90.88, PB at 12.25
- Current ratio below 1 at 0.95 signals liquidity risk
- No dividend yield
- ROE and ROIC only neutral
- Moderate asset turnover at 0.51
MNDY Weaknesses
- Low profitability with net margin 3.33%, ROE 3.14%, and negative ROIC -1.73%
- Unfavorable valuation multiples: PE at 362.98, PB at 11.41
- No dividend yield
- Asset turnover only neutral at 0.58
Both companies maintain low leverage and strong interest coverage, but NOW’s profitability and global diversification stand out. MNDY’s liquidity strength contrasts with its weak profitability. These factors highlight differing strategic priorities.
The Moat Duel: Analyzing Competitive Defensibility
A structural moat protects long-term profits from relentless competitive erosion. Only a true moat sustains durable economic returns:
ServiceNow, Inc.: Workflow Automation with Intangible Assets
I identify ServiceNow’s moat in its deep intangible assets and platform integration. Its slightly favorable ROIC trend and margin stability reflect expanding value. Continued innovation in AI-driven automation deepens this moat in 2026.
monday.com Ltd.: Rapid Growth, Building Cost Advantages
monday.com’s moat arises from cost advantages via scalable cloud infrastructure, contrasting with ServiceNow’s intangible asset focus. Despite shedding value versus WACC, its rapidly improving profitability suggests emerging competitiveness and expansion potential in workflow markets.
Intangible Assets vs. Cost Scale: ServiceNow’s Deeper Moat
ServiceNow’s intangible asset moat shows growing profitability and value creation, whereas monday.com struggles with value destruction despite fast growth. ServiceNow stands better equipped to defend its market share long term.
Which stock offers better returns?
Over the past year, both ServiceNow, Inc. and monday.com Ltd. experienced significant declines, with trading volumes rising amid seller dominance and decelerating downward trends.
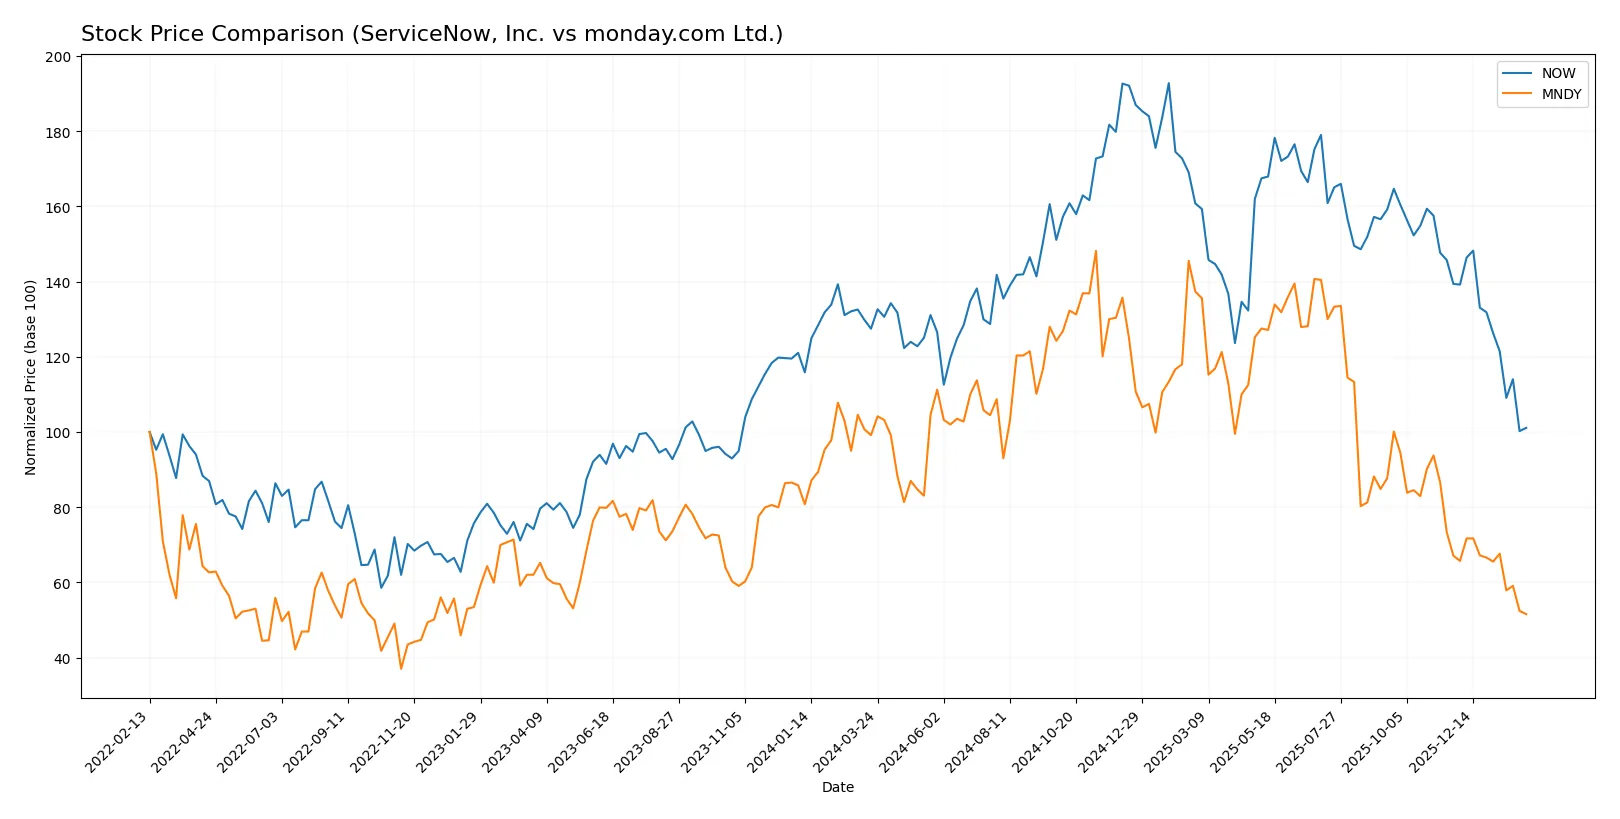
Trend Comparison
ServiceNow, Inc. shows a bearish 20.69% price decline over the past 12 months, with decelerating losses and a peak at 225.0 before dropping to a low of 117.01.
monday.com Ltd. exhibits a steeper bearish trend, down 48.01% in the same period, also decelerating, with a high of 324.31 and a low near 112.82, reflecting higher volatility.
Comparatively, ServiceNow, Inc. outperformed monday.com Ltd., delivering a smaller market loss and less pronounced volatility over the year.
Target Prices
Analysts present a broad target price range for ServiceNow, Inc. and monday.com Ltd., reflecting varied market views.
| Company | Target Low | Target High | Consensus |
|---|---|---|---|
| ServiceNow, Inc. | 115 | 1315 | 440.64 |
| monday.com Ltd. | 140 | 310 | 238.15 |
ServiceNow’s consensus target of 441 far exceeds its current price of 118, signaling strong bullish expectations. monday.com’s consensus target of 238 also suggests substantial upside from its 113 share price.

Don’t Let Luck Decide Your Entry Point
Optimize your entry points with our advanced ProRealTime indicators. You’ll get efficient buy signals with precise price targets for maximum performance. Start outperforming now!
How do institutions grade them?
ServiceNow, Inc. Grades
The following table shows recent grades assigned to ServiceNow by major financial institutions:
| Grading Company | Action | New Grade | Date |
|---|---|---|---|
| Citigroup | Maintain | Buy | 2026-01-30 |
| Macquarie | Maintain | Neutral | 2026-01-29 |
| Evercore ISI Group | Maintain | Outperform | 2026-01-29 |
| RBC Capital | Maintain | Outperform | 2026-01-29 |
| Keybanc | Maintain | Underweight | 2026-01-29 |
| Needham | Maintain | Buy | 2026-01-29 |
| Stifel | Maintain | Buy | 2026-01-29 |
| BTIG | Maintain | Buy | 2026-01-29 |
| Cantor Fitzgerald | Maintain | Overweight | 2026-01-29 |
| DA Davidson | Maintain | Buy | 2026-01-29 |
monday.com Ltd. Grades
Below is a summary of monday.com’s recent institutional grades from reputable sources:
| Grading Company | Action | New Grade | Date |
|---|---|---|---|
| Morgan Stanley | Maintain | Overweight | 2026-01-27 |
| Keybanc | Maintain | Overweight | 2026-01-22 |
| BTIG | Maintain | Buy | 2026-01-15 |
| Barclays | Maintain | Overweight | 2026-01-12 |
| Jefferies | Maintain | Buy | 2026-01-05 |
| Citigroup | Maintain | Buy | 2025-12-23 |
| Tigress Financial | Maintain | Buy | 2025-12-11 |
| DA Davidson | Maintain | Buy | 2025-11-11 |
| JP Morgan | Maintain | Overweight | 2025-11-11 |
| Jefferies | Maintain | Buy | 2025-11-11 |
Which company has the best grades?
ServiceNow and monday.com both attract strong buy and overweight grades from top firms. ServiceNow receives more “Buy” and “Outperform” ratings but also an “Underweight” from Keybanc. monday.com’s grades lean consistently toward “Buy” and “Overweight” with no negative assessments. Investors may view monday.com’s steadier consensus as less conflicted, while ServiceNow’s mixed views suggest more varied analyst sentiment.
Risks specific to each company
The following categories identify the critical pressure points and systemic threats facing both firms in the 2026 market environment:
1. Market & Competition
ServiceNow, Inc.
- Dominates enterprise cloud workflows with broad industry reach; faces intense competition from large tech incumbents.
monday.com Ltd.
- Operates a niche cloud-based Work OS; competes with diverse SaaS providers and must scale globally to sustain growth.
2. Capital Structure & Debt
ServiceNow, Inc.
- Maintains conservative leverage with 0.25 debt/equity, interest coverage infinite, signaling financial stability.
monday.com Ltd.
- Exhibits even lower leverage at 0.1 debt/equity and solid interest coverage, enhancing balance sheet resilience.
3. Stock Volatility
ServiceNow, Inc.
- Beta near market average at 0.978; price range tighter, indicating moderate volatility.
monday.com Ltd.
- Higher beta at 1.247 and wider price range suggest greater stock price fluctuation risk.
4. Regulatory & Legal
ServiceNow, Inc.
- Subject to US regulations and data privacy laws; geopolitical stability favors compliance predictability.
monday.com Ltd.
- Faces complex international regulatory landscapes, including EU and Israeli frameworks, increasing compliance risk.
5. Supply Chain & Operations
ServiceNow, Inc.
- Robust global infrastructure with diversified partnerships; operational scale mitigates supply risks.
monday.com Ltd.
- Smaller scale and geographic concentration could expose it to operational disruptions and supplier dependencies.
6. ESG & Climate Transition
ServiceNow, Inc.
- Increasing focus on sustainable IT operations; well-positioned to meet growing ESG demands.
monday.com Ltd.
- Early-stage ESG initiatives; must accelerate efforts to align with investor expectations and regulatory trends.
7. Geopolitical Exposure
ServiceNow, Inc.
- Primarily US-based; relatively insulated from geopolitical shocks but vulnerable to global economic shifts.
monday.com Ltd.
- Headquartered in Israel with international operations, exposed to Middle East tensions and global market volatility.
Which company shows a better risk-adjusted profile?
ServiceNow faces its largest risk in market competition due to a high premium valuation paired with moderate liquidity risks. monday.com’s principal threat lies in stock volatility and regulatory complexity given its international footprint and elevated beta. Despite these concerns, ServiceNow’s stronger financial metrics and conservative capital structure grant it a more favorable risk-adjusted profile. monday.com must address operational scale and regulatory challenges to reduce volatility risks. Recent data confirms ServiceNow’s stable Altman Z-Score in the safe zone at 6.6, compared to monday.com’s lower but still safe 5.9, reinforcing ServiceNow’s superior financial stability.
Final Verdict: Which stock to choose?
ServiceNow, Inc. (NOW) excels as a cash-generating powerhouse with a steadily growing profitability profile. Its main point of vigilance lies in a current ratio below 1, signaling potential short-term liquidity constraints. NOW suits investors targeting aggressive growth with a tolerance for near-term operational risks.
monday.com Ltd. (MNDY) offers a strategic moat through robust balance sheet strength and superior liquidity, appealing to those prioritizing financial safety. However, its negative returns on invested capital and high valuation multiples temper enthusiasm. MNDY fits best in a GARP portfolio seeking growth tempered by capital preservation.
If you prioritize scalable profitability and strong cash flow, ServiceNow outshines with clearer value creation despite liquidity concerns. However, if better liquidity and balance sheet safety are your focus, monday.com offers more stability but commands a premium with less certain economic moat. Each stock aligns with distinct investor risk profiles and strategic goals.
Disclaimer: Investment carries a risk of loss of initial capital. The past performance is not a reliable indicator of future results. Be sure to understand risks before making an investment decision.
Go Further
I encourage you to read the complete analyses of ServiceNow, Inc. and monday.com Ltd. to enhance your investment decisions: