In the competitive world of semiconductors, Texas Instruments Incorporated (TXN) and CEVA, Inc. (CEVA) stand out as two influential players. While both companies operate within the same industry, they adopt distinct strategies regarding innovation and market focus. Texas Instruments specializes in analog and embedded processing solutions, while CEVA is known for its advanced wireless connectivity and smart sensing technologies. In this article, I will analyze these companies to determine which one presents the most compelling investment opportunity.

Table of contents
Company Overview
Texas Instruments Incorporated Overview
Texas Instruments Incorporated (TXN), founded in 1930 and headquartered in Dallas, Texas, is a leading designer and manufacturer of semiconductors. The company’s mission centers on enabling electronics designers and manufacturers with innovative semiconductor solutions. TXN operates primarily in two segments: Analog and Embedded Processing. The Analog segment focuses on power management and signal chain products, serving industries like automotive and personal electronics. Meanwhile, the Embedded Processing segment delivers microcontrollers and digital signal processors, which are critical for various computing applications. With a robust market capitalization of approximately $147B, Texas Instruments has established itself as a pivotal player in the semiconductor industry.
CEVA, Inc. Overview
CEVA, Inc. (CEVA), established in 1999 and based in Rockville, Maryland, specializes in licensing wireless connectivity and smart sensing technologies. The company’s mission is to empower semiconductor companies and OEMs by providing advanced digital signal processors and AI processors. CEVA’s technology portfolio includes platforms for 5G processing, sensor fusion, and computer vision, catering to diverse markets such as IoT, automotive, and industrial sectors. With a market capitalization of around $486M, CEVA is noteworthy for its focus on licensing IP solutions, allowing clients to integrate cutting-edge technology into their products.
Key Similarities and Differences
Both Texas Instruments and CEVA operate within the semiconductor industry, yet their business models differ significantly. Texas Instruments emphasizes direct manufacturing and sales of semiconductor products, while CEVA primarily focuses on licensing its technologies to other companies. This distinction highlights Texas Instruments’ vertical integration compared to CEVA’s more collaborative approach within the industry.
Income Statement Comparison
The following table provides a detailed comparison of the income statements for Texas Instruments (TXN) and CEVA (CEVA) for the most recent fiscal year, allowing investors to assess their financial health.
| Metric | Texas Instruments (TXN) | CEVA, Inc. (CEVA) |
|---|---|---|
| Revenue | 15.64B | 106.94M |
| EBITDA | 7.54B | -3.41M |
| EBIT | 5.96B | -7.55M |
| Net Income | 4.80B | -8.79M |
| EPS | 5.24 | -0.37 |
Interpretation of Income Statement
In the most recent year, Texas Instruments demonstrated solid revenue generation of 15.64B, albeit a decline from 17.52B in the prior year. The company maintained a healthy net income of 4.80B, though this is also a decrease from 6.51B. CEVA, on the other hand, faced significant challenges with a revenue of only 106.94M and a net loss of 8.79M, reflecting ongoing operational difficulties. The stark contrast in performance and margins between these companies highlights the importance of careful selection when considering investments, especially in the semiconductor industry.
Financial Ratios Comparison
Below is a comparative analysis of key financial ratios for Texas Instruments (TXN) and CEVA, Inc. (CEVA) based on the most recent data available.
| Metric | Texas Instruments (TXN) | CEVA, Inc. (CEVA) |
|---|---|---|
| ROE | 28.39% | -3.30% |
| ROIC | 14.75% | -8.56% |
| P/E | 35.63 | -44.90 |
| P/B | 10.12 | 2.79 |
| Current Ratio | 4.12 | 7.09 |
| Quick Ratio | 2.88 | 7.09 |
| D/E | 0.80 | 0.02 |
| Debt-to-Assets | 38.29% | 2.18% |
| Interest Coverage | 10.76 | 0.00 |
| Asset Turnover | 0.44 | 0.32 |
| Fixed Asset Turnover | 1.38 | 8.43 |
| Payout ratio | 99.92% | 0.00% |
| Dividend yield | 2.80% | 0.00% |
Interpretation of Financial Ratios
Texas Instruments demonstrates strong profitability with a solid return on equity (ROE) and return on invested capital (ROIC), alongside manageable debt levels. In contrast, CEVA shows negative returns and high leverage ratios, indicating significant financial distress and operational inefficiencies. Investors should remain cautious regarding CEVA’s viability, as its financial health poses considerable risks.
Dividend and Shareholder Returns
Texas Instruments (TXN) actively rewards shareholders through dividends, with a current annual yield of 2.8% and a payout ratio of approximately 99.9%. While this indicates a strong commitment to shareholder returns, the high payout ratio raises concerns about sustainability, especially in fluctuating market conditions. Conversely, CEVA, Inc. does not issue dividends, prioritizing reinvestment for growth during its development phase. However, it engages in share buybacks, which could enhance long-term shareholder value if managed prudently. Overall, TXN’s dividends reflect a robust strategy, while CEVA’s approach may align with future growth potential but comes with risk.
Strategic Positioning
Texas Instruments (TXN) holds a significant market share in the semiconductor industry, particularly in analog and embedded processing, with a robust portfolio that caters to various sectors including automotive and industrial. In contrast, CEVA, Inc. (CEVA) focuses on wireless connectivity and smart sensing technologies, carving out a niche in the IoT and mobile markets. The competitive pressure is high, with both companies facing technological disruption from rapid advancements in AI and 5G technologies, necessitating continuous innovation and adaptation.
Stock Comparison
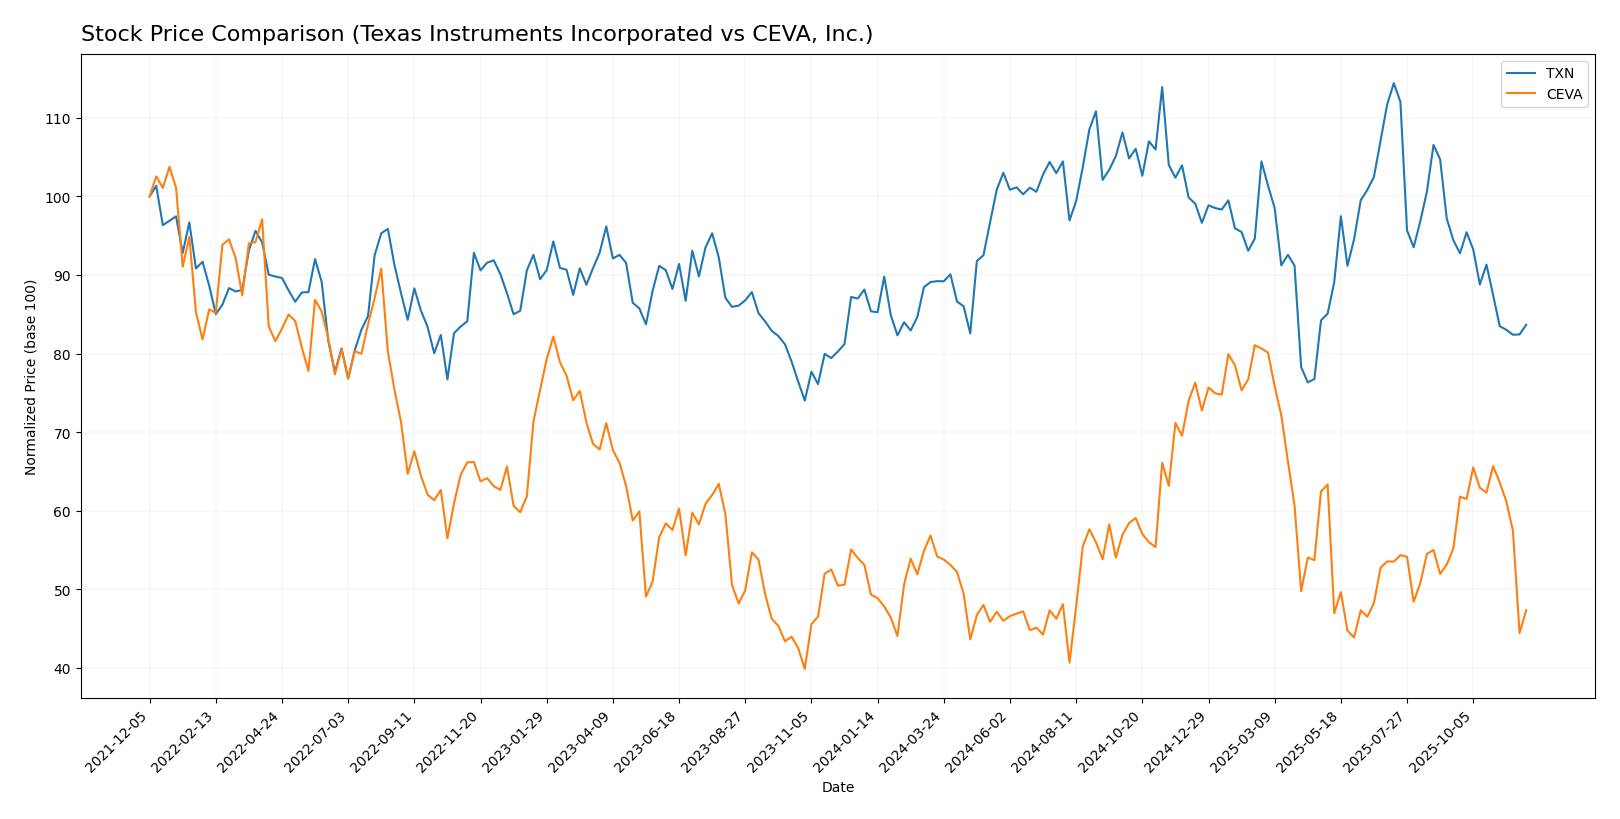
Over the past year, the stock prices of Texas Instruments Incorporated (TXN) and CEVA, Inc. have demonstrated significant volatility, reflecting key market dynamics and investor sentiment.

Trend Analysis
For Texas Instruments (TXN), the overall percentage change over the past year is -2.02%, indicating a bearish trend. The stock has shown notable deceleration, with a high of 221.25 and a low of 147.6. The standard deviation of 16.96 suggests a relatively high level of volatility. In the recent period from September 14, 2025, to November 30, 2025, the stock experienced a further decline of -11.41%, with a standard deviation of 9.42, reinforcing the bearish sentiment.
In the case of CEVA, Inc., the overall percentage change for the past year stands at -4.03%, also reflecting a bearish trend. The stock has shown deceleration as well, with a high of 34.67 and a low of 17.39. The standard deviation of 4.48 indicates less volatility compared to TXN. Recently, from September 14, 2025, to November 30, 2025, CEVA’s stock declined by -14.27%, accompanied by a standard deviation of 2.81, further affirming the bearish outlook.
In summary, both companies are currently experiencing bearish trends, characterized by notable declines and deceleration in price movements.
Analyst Opinions
Recent analyst recommendations indicate a mixed outlook for Texas Instruments (TXN) and CEVA, Inc. (CEVA). For TXN, analysts have rated the stock as a “Buy” due to strong performance metrics, particularly in return on equity (5) and assets (5), suggesting robust profitability. Conversely, CEVA has received a “Hold” rating, with concerns over its low scores in return on equity (1) and assets (1). The consensus for TXN is a “Buy,” while CEVA leans towards a cautious “Hold” for the current year.
Stock Grades
In reviewing the latest stock grades from reliable grading companies, I found some noteworthy insights for Texas Instruments Incorporated (TXN) and CEVA, Inc. (CEVA).
Texas Instruments Incorporated Grades
| Grading Company | Action | New Grade | Date |
|---|---|---|---|
| Susquehanna | maintain | Positive | 2025-10-22 |
| Rosenblatt | maintain | Buy | 2025-10-22 |
| Truist Securities | maintain | Hold | 2025-10-22 |
| Wells Fargo | maintain | Equal Weight | 2025-10-22 |
| Goldman Sachs | maintain | Buy | 2025-10-22 |
| JP Morgan | maintain | Overweight | 2025-10-22 |
| Cantor Fitzgerald | maintain | Neutral | 2025-10-22 |
| Stifel | maintain | Hold | 2025-10-22 |
| TD Cowen | maintain | Buy | 2025-10-22 |
| Mizuho | downgrade | Underperform | 2025-10-20 |
CEVA, Inc. Grades
| Grading Company | Action | New Grade | Date |
|---|---|---|---|
| Barclays | maintain | Overweight | 2025-11-12 |
| Rosenblatt | maintain | Buy | 2025-11-11 |
| Rosenblatt | maintain | Buy | 2025-08-14 |
| Oppenheimer | maintain | Outperform | 2025-05-09 |
| Barclays | maintain | Overweight | 2025-05-08 |
| Rosenblatt | maintain | Buy | 2025-05-08 |
| Rosenblatt | maintain | Buy | 2025-04-23 |
| Rosenblatt | maintain | Buy | 2025-02-14 |
| Barclays | maintain | Overweight | 2025-02-14 |
| Rosenblatt | maintain | Buy | 2025-02-11 |
Overall, both companies show a trend of maintaining positive grades, with many analysts recommending a “Buy” or “Overweight” action. However, it’s important to note that Texas Instruments received a downgrade from Mizuho to “Underperform,” which may indicate some caution for potential investors.
Target Prices
For Texas Instruments Incorporated (TXN), reliable target price data indicates a strong consensus among analysts.
| Company | Target High | Target Low | Consensus |
|---|---|---|---|
| Texas Instruments Incorporated | 245 | 145 | 190.45 |
Analysts expect TXN’s stock to reach a consensus target of 190.45, compared to its current price of 161.77. This suggests a potential upside, but investors should remain cautious given the inherent risks.
Unfortunately, no verified target price data is available for CEVA, Inc. (CEVA), reflecting a more uncertain market sentiment for this stock.
Strengths and Weaknesses
The following table summarizes the strengths and weaknesses of Texas Instruments (TXN) and CEVA, Inc. (CEVA) based on the most recent data.
| Criterion | Texas Instruments (TXN) | CEVA, Inc. (CEVA) |
|---|---|---|
| Diversification | High | Low |
| Profitability | Strong (30.68% net margin) | Negative (-8.22% net margin) |
| Innovation | Robust R&D investment | Moderate R&D focus |
| Global presence | Extensive | Limited |
| Market Share | Leading in semiconductors | Niche market |
| Debt level | Moderate (38.29% debt to assets) | Very Low (1.79% debt to assets) |
Key takeaways indicate that Texas Instruments has a strong competitive position with high profitability and extensive global reach, while CEVA struggles with profitability and market presence but maintains very low debt levels.
Risk Analysis
The following table outlines the key risks associated with Texas Instruments (TXN) and CEVA, Inc. (CEVA) based on the most recent data available.
| Metric | Texas Instruments (TXN) | CEVA, Inc. (CEVA) |
|---|---|---|
| Market Risk | Moderate | High |
| Regulatory Risk | Low | Moderate |
| Operational Risk | Moderate | High |
| Environmental Risk | Low | Moderate |
| Geopolitical Risk | Moderate | High |
Both companies face significant market and operational risks, particularly CEVA, which operates in a highly competitive sector with a high beta of 1.448. Recent developments in international trade agreements could also introduce volatility in both firms, particularly affecting CEVA’s market access.
Which one to choose?
When comparing Texas Instruments (TXN) and CEVA, Inc. (CEVA), the fundamentals indicate that TXN holds a stronger position. TXN boasts a robust net profit margin of 30.68% and a solid return on equity of 28.39%. In contrast, CEVA continues to face challenges with negative margins and a lower overall rating (C+) compared to TXN’s B. Analysts are cautious with both stocks, as both show bearish trends recently, with TXN down 11.41% and CEVA down 14.27%.
For investors focused on growth, TXN appears favorable due to its consistent profitability and higher analyst ratings. Conversely, those prioritizing speculative investments might consider CEVA, given its potential for recovery despite current losses.
However, both companies face industry risks such as market dependence and competition that warrant careful consideration.
Disclaimer: This article is not financial advice. Each investor is responsible for their own investment decisions.
Go further
I encourage you to read the complete analyses of Texas Instruments Incorporated and CEVA, Inc. to enhance your investment decisions:


