Home > Analyses > Technology > MKS Inc.
MKS Inc. powers the invisible forces behind modern manufacturing, shaping how industries control and optimize critical processes. The company commands a leadership role in hardware and equipment, delivering cutting-edge vacuum, laser, and photonics technologies that drive semiconductor, life sciences, and defense innovations. Renowned for precision and reliability, MKS fuels complex production ecosystems worldwide. As we assess its robust market position, the key question remains: do MKS’s fundamentals justify its premium valuation and growth outlook in a competitive tech landscape?
Table of contents
Business Model & Company Overview
MKS Inc., founded in 1961 and headquartered in Andover, Massachusetts, stands as a dominant player in the hardware, equipment, and parts industry. It delivers a cohesive ecosystem of instruments and process control solutions that precisely measure, monitor, and manage critical manufacturing parameters globally. The company’s integrated approach spans vacuum control, laser technologies, and photonics, serving semiconductor, industrial, and life sciences markets with unmatched technical depth.
MKS generates revenue through a balanced mix of hardware sales and specialized subsystems, complemented by software-driven process control solutions. It leverages a global footprint across the Americas, Europe, and Asia, selling via direct channels and distributors. Its economic moat lies in its complex, precision-engineered products that embed MKS deeply within advanced manufacturing supply chains, shaping the future of high-tech industrial processes.
Financial Performance & Fundamental Metrics
I analyze MKS Inc.’s income statement, key financial ratios, and dividend payout policy to reveal its profitability, efficiency, and shareholder value approach.
Income Statement
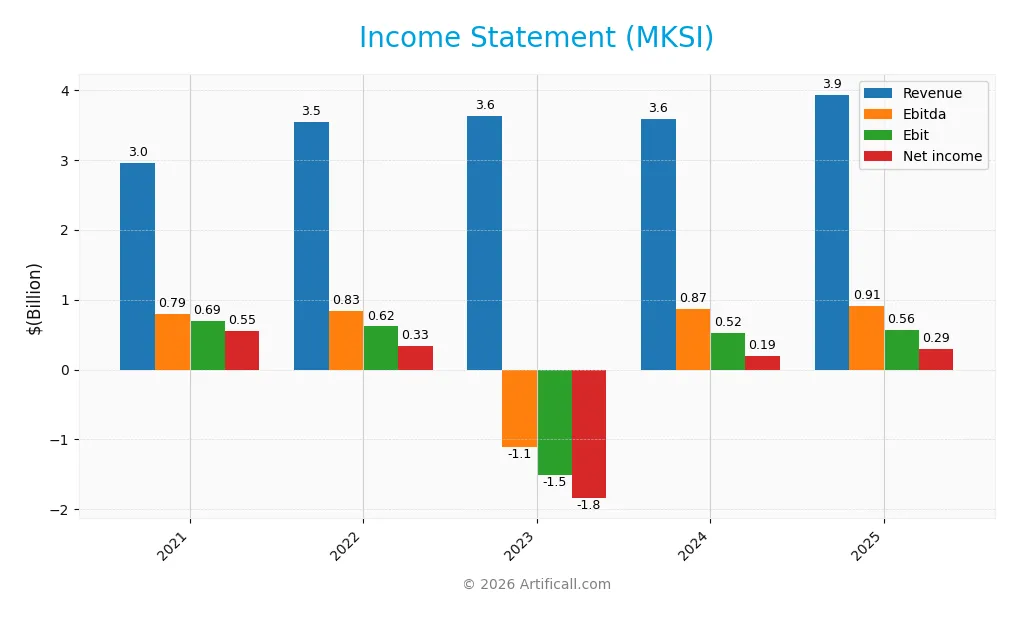
The table below summarizes MKS Inc.’s key income statement metrics for fiscal years 2021 through 2025, highlighting revenue, profitability, and earnings per share trends.
| 2021 | 2022 | 2023 | 2024 | 2025 | |
|---|---|---|---|---|---|
| Revenue | 2.95B | 3.55B | 3.62B | 3.59B | 3.93B |
| Cost of Revenue | 1.57B | 2.00B | 1.98B | 1.88B | 2.34B |
| Operating Expenses | 681M | 930M | 3.20B | 1.21B | 1.02B |
| Gross Profit | 1.38B | 1.55B | 1.64B | 1.71B | 1.59B |
| EBITDA | 794M | 832M | -1.11B | 870M | 909M |
| EBIT | 690M | 616M | -1.51B | 522M | 565M |
| Interest Expense | 25M | 177M | 422M | 345M | 212M |
| Net Income | 551M | 333M | -1.84B | 190M | 295M |
| EPS | 9.95 | 5.58 | -27.56 | 2.82 | 4.39 |
| Filing Date | 2022-02-28 | 2023-03-14 | 2024-02-27 | 2025-02-25 | 2026-02-24 |
Income Statement Evolution
MKS Inc. posted a 9.6% revenue increase in 2025, continuing a five-year growth trend of 33.3%. Gross profit declined 6.9% last year, compressing margins despite rising sales. Operating expenses grew in line with revenue, supporting an 8.2% EBIT expansion. Net margin improved sharply by 41.6%, reflecting better bottom-line efficiency amid mixed margin trends.
Is the Income Statement Favorable?
The 2025 income statement shows solid fundamentals with a 40.5% gross margin and a 14.4% EBIT margin, both favorable by industry standards. Interest expense remains neutral at 5.4% of revenue, while the net margin of 7.5% improved significantly. EPS jumped 55.5%, signaling strong earnings recovery. Overall, the income statement displays strength despite some margin pressure on gross profit.
Financial Ratios
The table below presents key financial ratios for MKS Inc. (MKSI) from 2021 to 2025, reflecting profitability, valuation, liquidity, leverage, and efficiency metrics:
| Ratios | 2021 | 2022 | 2023 | 2024 | 2025 |
|---|---|---|---|---|---|
| Net Margin | 18.7% | 9.39% | -50.8% | 5.30% | 7.50% |
| ROE | 19.1% | 7.43% | -74.5% | 8.18% | 10.8% |
| ROIC | 14.1% | 4.45% | -17.7% | 6.31% | 6.92% |
| P/E | 17.5 | 15.2 | -3.73 | 37.0 | 36.5 |
| P/B | 3.34 | 1.13 | 2.78 | 3.03 | 3.96 |
| Current Ratio | 4.67 | 2.93 | 3.18 | 3.19 | 2.71 |
| Quick Ratio | 3.41 | 1.91 | 2.01 | 2.04 | 1.71 |
| D/E | 0.36 | 1.15 | 2.03 | 2.06 | 1.73 |
| Debt-to-Assets | 22.6% | 44.9% | 55.1% | 55.6% | 53.4% |
| Interest Coverage | 27.96 | 3.49 | -3.68 | 1.44 | 2.67 |
| Asset Turnover | 0.65 | 0.31 | 0.40 | 0.42 | 0.45 |
| Fixed Asset Turnover | 5.78 | 3.43 | 3.59 | 3.55 | 3.64 |
| Dividend Yield | 0.49% | 1.03% | 0.86% | 0.84% | 0.55% |
Evolution of Financial Ratios
Return on Equity (ROE) showed moderate recovery from negative in 2023 to 10.85% in 2025, reflecting improved profitability. The Current Ratio declined from 4.67 in 2021 to 2.71 in 2025 but remains above 1, indicating liquidity strength. Debt-to-Equity rose sharply from 0.36 in 2021 to 1.73 in 2025, signaling increased leverage and risk exposure.
Are the Financial Ratios Fovorable?
Profitability ratios, including ROE and net margin, are neutral, while the weighted average cost of capital (WACC) exceeds ROIC, an unfavorable sign. Liquidity ratios like Current and Quick Ratios are favorable, supporting short-term obligations. However, leverage metrics, including Debt-to-Equity at 1.73 and Debt-to-Assets at 53.35%, are unfavorable. Market valuation ratios, notably P/E at 36.46 and P/B at 3.96, also rate unfavorably, indicating potential overvaluation. Overall, the financial ratios lean slightly unfavorable.
Shareholder Return Policy
MKS Inc. maintains a conservative dividend payout ratio around 20-31%, with dividends per share stable near $0.88. The annual yield remains below 1%, supported by free cash flow coverage exceeding 2x, indicating prudent capital allocation.
The company also engages in share buybacks, balancing returns with reinvestment. This measured distribution strategy aligns with sustainable long-term value creation, reflecting disciplined cash flow management amid moderate profitability and leverage levels.
Score analysis
The radar chart below displays key valuation and financial performance scores for MKS Inc.:
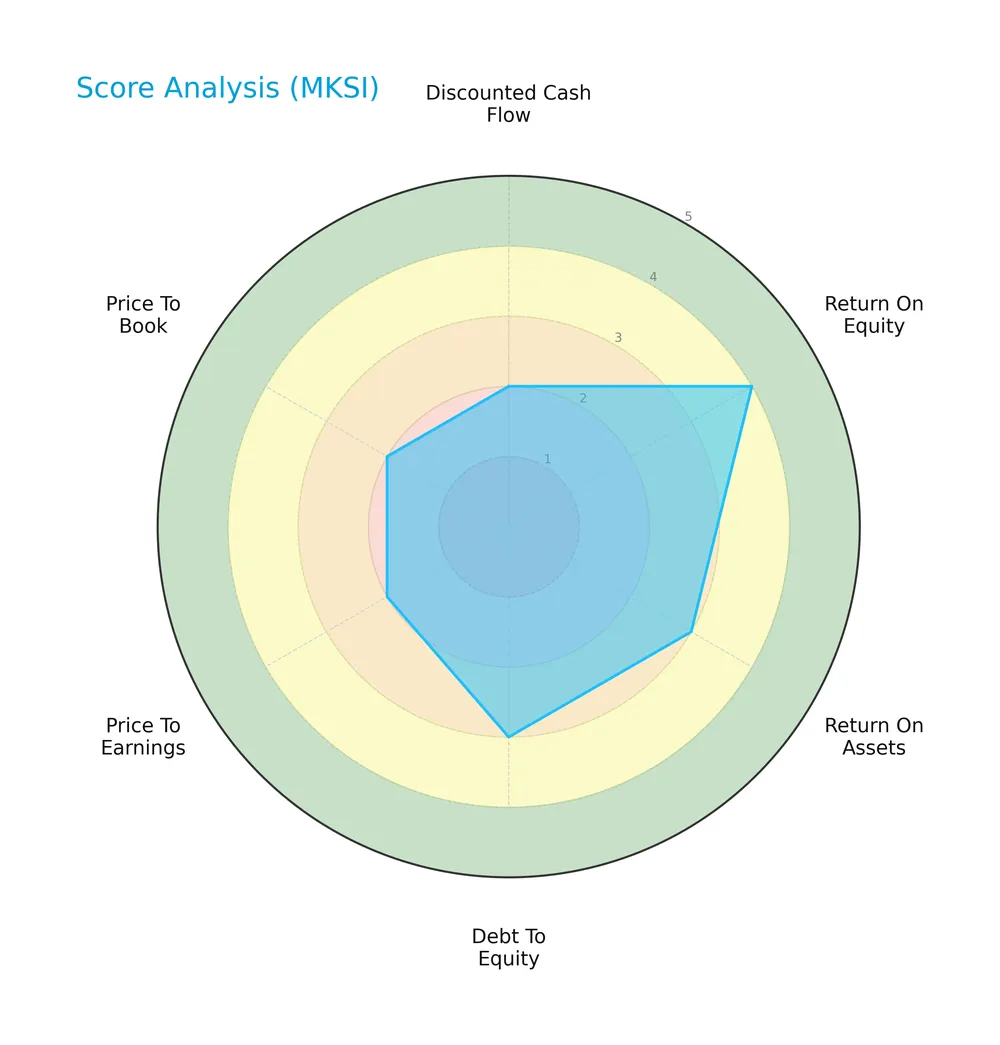
MKS Inc. shows a moderate overall score of 3. Return on equity is favorable at 4, indicating strong profitability. Debt-to-equity and return on assets are moderate at 3. Discounted cash flow, price-to-earnings, and price-to-book scores are unfavorable at 2, reflecting valuation concerns.
Analysis of the company’s bankruptcy risk
The Altman Z-Score places MKS Inc. in the grey zone, indicating a moderate risk of bankruptcy and financial uncertainty:

Is the company in good financial health?
The Piotroski Score diagram illustrates MKS Inc.’s financial strength based on nine criteria:

With a strong Piotroski Score of 7, MKS Inc. demonstrates solid financial health, suggesting effective profitability, liquidity, and operational efficiency.
Competitive Landscape & Sector Positioning
This sector analysis will explore MKS Inc.’s strategic positioning, revenue segments, and key products. I will assess its main competitors and competitive advantages. The goal is to determine whether MKS holds a sustainable edge over its peers.
Strategic Positioning
MKS Inc. diversifies across hardware, photonics, and equipment segments, serving semiconductor, industrial, life sciences, and defense markets. Its geographic exposure spans the US, China, Korea, Japan, and other countries, balancing mature and high-growth regions with a $16.9B market cap.
Revenue by Segment
This pie chart displays MKS Inc.’s revenue breakdown by product and service segments for the fiscal year 2025, highlighting the company’s core business drivers and segment contributions.

In 2025, MKS Inc. generated $3.4B from its Product segment, significantly outpacing the $495M from Services. Products remain the dominant revenue driver, showing steady growth from $3.1B in 2024. The Service segment also expanded modestly. This concentration in Products signals reliance on core manufacturing solutions, with Services providing complementary but smaller revenue streams. The recent acceleration in product sales underscores MKS’s strong market positioning amid an evolving tech cycle.
Key Products & Brands
The following table presents MKS Inc.’s main products and brands with concise descriptions:
| Product | Description |
|---|---|
| Vacuum & Analysis Solutions | Pressure and vacuum control, flow and valve technologies, integrated pressure measurement and control subsystems for precise manufacturing control. |
| Power Solutions | Microwave, power delivery systems, RF matching networks, and metrology products powering etching, stripping, and deposition processes. |
| Plasma and Reactive Gas Products | Components supporting plasma processing and reactive gas delivery in semiconductor manufacturing. |
| Laser Products | Continuous wave, pulsed nanosecond, diode and diode-pumped solid-state, and fiber laser technologies. |
| Photonics Products | Motion control, optical tables, vibration isolation, photonic instruments, optics, optical assemblies, opto-mechanical components, and temperature sensors. |
| Laser and LED Measurement Products | Devices measuring laser power, energy, beam profiles, and optical/photonic subsystems. |
| Equipment & Solutions | Laser-based systems for PCB manufacturing, flexible interconnect PCB processing, high-density interconnect solutions, and multi-layer ceramic capacitor test systems. |
MKS Inc. delivers a broad range of precision instruments and systems crucial for semiconductor, industrial, life sciences, and defense markets. Its diversified product portfolio emphasizes advanced vacuum, laser, photonics, and manufacturing equipment technologies.
Main Competitors
MKS Inc. faces competition from 20 companies in its sector, with the table showing the top 10 leaders by market capitalization:
| Competitor | Market Cap. |
|---|---|
| Amphenol Corporation | 171B |
| Corning Incorporated | 77.7B |
| TE Connectivity Ltd. | 68.6B |
| Sandisk Corporation | 40.0B |
| Garmin Ltd. | 38.9B |
| Keysight Technologies, Inc. | 35.5B |
| Celestica Inc. | 34.0B |
| Coherent, Inc. | 28.7B |
| Jabil Inc. | 25.7B |
| Teledyne Technologies Incorporated | 24.4B |
MKS Inc. ranks 14th among 20 competitors, with a market cap just 9.87% of the leader, Amphenol Corporation. It sits below both the average market cap of the top 10 (54.4B) and the sector median (21.6B). The company is separated from its closest competitor above by approximately 3.41%, indicating a narrow gap just outside the top 10.
Comparisons with competitors
Check out how we compare the company to its competitors:
Does MKSI have a competitive advantage?
MKS Inc. lacks a competitive advantage as its ROIC is below WACC, indicating value destruction and declining profitability over 2021-2025. This signals inefficient capital use and weak economic moat.
The company’s diverse product lines across vacuum control, lasers, and PCB manufacturing offer growth potential. Expanding in semiconductor and industrial markets could create future opportunities despite current challenges.
SWOT Analysis
This analysis highlights MKS Inc.’s core strengths, weaknesses, opportunities, and threats to inform strategic decisions.
Strengths
- strong gross margin at 40%
- diversified product segments
- global customer base with growing Asia presence
Weaknesses
- declining overall net income growth
- ROIC below WACC indicates value destruction
- elevated debt-to-equity ratio at 1.73
Opportunities
- expanding semiconductor and industrial tech markets
- innovation in photonics and laser systems
- geographic revenue growth in China and Korea
Threats
- intense competition in hardware and equipment
- exposure to cyclical semiconductor demand
- high valuation multiples may pressure stock
MKS Inc. shows robust operational strengths but faces challenges with profitability erosion and capital structure risks. Strategic focus should emphasize improving capital efficiency and leveraging growth in emerging tech markets to sustain competitive advantage.
Stock Price Action Analysis
The following weekly chart displays MKS Inc.’s stock price movements over the past 12 months, highlighting key highs and lows:

Trend Analysis
Over the past 12 months, MKSI’s stock price rose 95.56%, indicating a strong bullish trend with accelerating momentum. The price moved from a low of 60.29 to a high of 260.74. Volatility remains elevated, with a standard deviation near 39.54, reflecting significant price swings.
Volume Analysis
In the last three months, trading volume has increased, driven by a strong buyer dominance at 77%. Buyer volume significantly exceeds seller volume, suggesting robust investor interest and confidence in MKSI’s upward trajectory.
Target Prices
Analysts set a confident target consensus for MKS Inc., reflecting optimistic growth expectations.
| Target Low | Target High | Consensus |
|---|---|---|
| 175 | 320 | 273 |
The target range spans from 175 to 320, with a consensus near 273, indicating solid upside potential backed by multiple analysts.

Don’t Let Luck Decide Your Entry Point
Optimize your entry points with our advanced ProRealTime indicators. You’ll get efficient buy signals with precise price targets for maximum performance. Start outperforming now!
Analyst & Consumer Opinions
This section examines analyst grades and consumer feedback to provide a balanced view of MKS Inc.’s market perception.
Stock Grades
The latest analyst ratings for MKS Inc. reveal a consistent pattern of maintained recommendations across major firms:
| Grading Company | Action | New Grade | Date |
|---|---|---|---|
| Goldman Sachs | Maintain | Sell | 2026-02-19 |
| Citigroup | Maintain | Buy | 2026-02-19 |
| Needham | Maintain | Buy | 2026-02-19 |
| Deutsche Bank | Maintain | Buy | 2026-02-19 |
| JP Morgan | Maintain | Overweight | 2026-02-19 |
| Wells Fargo | Maintain | Equal Weight | 2026-02-19 |
| TD Cowen | Maintain | Buy | 2026-01-22 |
| Needham | Maintain | Buy | 2026-01-22 |
| B of A Securities | Maintain | Buy | 2026-01-22 |
| Morgan Stanley | Maintain | Overweight | 2026-01-22 |
Most analysts maintain a bullish stance, with a majority rating MKS Inc. as Buy or Overweight. A minority hold a Sell or Equal Weight view, indicating some divergence in outlook.
Consumer Opinions
MKS Inc. sparks strong reactions, reflecting its impact on niche industrial markets.
| Positive Reviews | Negative Reviews |
|---|---|
| “Reliable products with consistent performance.” | “Customer support response times often lag.” |
| “Innovative technology that boosts operational efficiency.” | “Pricing is higher than some competitors.” |
| “Strong product customization options.” | “Occasional delays in order fulfillment.” |
Consumers praise MKS Inc. for innovation and product reliability. However, recurring concerns include customer service delays and premium pricing, which may affect broader market appeal.
Risk Analysis
Below is a summary table detailing key risks facing MKS Inc., including their likelihood and potential impact:
| Category | Description | Probability | Impact |
|---|---|---|---|
| Financial Leverage | High debt-to-equity ratio (1.73) raises solvency concerns amid rising rates | High | High |
| Valuation | Elevated P/E (36.46) and P/B (3.96) ratios suggest overvaluation risk | Medium | Medium |
| Market Volatility | Beta near 1.94 indicates above-average stock price swings | High | Medium |
| Profitability | ROIC (6.92%) below WACC (10.9%) signals potential value destruction | Medium | High |
| Liquidity | Strong current ratio (2.71) supports short-term financial flexibility | Low | Low |
I consider financial leverage the most critical risk due to MKS’s debt load exceeding half its assets, which could strain cash flows if interest rates rise further. The valuation also poses a cautionary signal, as multiples exceed industry norms, limiting upside. Profitability metrics reveal a worrisome gap between returns and cost of capital, implying inefficient capital allocation. However, liquidity remains a bright spot, mitigating short-term funding stress.
Should You Buy MKS Inc.?
MKS Inc. appears to be grappling with diminishing operational efficiency and a very unfavorable moat, indicated by its declining ROIC versus WACC. While its leverage profile remains moderate, the company suggests robust profitability and a strong Piotroski score, supporting a cautious B rating overall.
Strength & Efficiency Pillars
MKS Inc. posts a solid operational profile with a gross margin of 40.45% and an EBIT margin of 14.37%, signaling effective cost management. The net margin at 7.5% and ROE of 10.85% reflect moderate profitability. However, the ROIC of 6.92% falls short of the WACC at 10.9%, indicating the company is currently destroying value rather than creating it. While margins remain stable, the declining ROIC trend warns of weakening capital efficiency over time.
Weaknesses and Drawbacks
The Altman Z-Score of 2.65 places MKS in the grey zone, implying moderate bankruptcy risk and warranting caution. Valuation metrics appear stretched with a P/E of 36.46 and P/B of 3.96, suggesting the stock trades at a premium relative to earnings and book value. Leverage is elevated, with a debt-to-equity ratio of 1.73 and debt-to-assets at 53.35%, increasing financial risk. Additionally, asset turnover is low at 0.45, reflecting suboptimal use of assets to generate revenue.
Our Final Verdict about MKS Inc.
MKS Inc. presents a fundamentally mixed profile with operational strengths offset by value destruction and moderate solvency risks. The bullish long-term trend and strong buyer dominance (77%) indicate positive market sentiment. However, the grey zone Altman Z-Score and stretched valuation suggest prudence. Despite the company’s operational gains, the profile might appear too risky for conservative capital and calls for a cautious, wait-and-see approach.
Disclaimer: This content is for informational purposes only and does not constitute financial, investment, or other professional advice. Investing in financial markets involves a significant risk of loss, and past performance is not indicative of future results.
Additional Resources
- Decoding MKS Inc (MKSI): A Strategic SWOT Insight – GuruFocus (Feb 25, 2026)
- MKS INC SEC 10-K Report – TradingView (Feb 24, 2026)
- MKS Inc. CEO John T.C. Lee to Participate in Morgan Stanley Technology, Media & Telecom Conference 2026 – Quiver Quantitative (Feb 23, 2026)
- MKS Inc. to Participate in Morgan Stanley’s Technology, Media & Telecom Conference – Sahm (Feb 23, 2026)
- Gerald Colella Sells 10,000 Shares of MKS (NASDAQ:MKSI) Stock – MarketBeat (Feb 24, 2026)
For more information about MKS Inc., please visit the official website: mksinst.com