Teledyne Technologies is not just a player in the hardware and equipment sector; it’s a catalyst for innovation that impacts critical industries around the globe. With a diverse portfolio that includes advanced imaging systems and aerospace electronics, Teledyne is redefining standards for quality and performance. As the demand for sophisticated technology continues to surge, I am compelled to analyze whether Teledyne’s robust fundamentals can sustain its current market valuation and growth trajectory in this dynamic environment.

Table of contents
Company Description
Teledyne Technologies Incorporated (NYSE: TDY), founded in 1960 and headquartered in Thousand Oaks, California, operates at the forefront of the hardware, equipment, and parts industry. With a market capitalization of approximately $23.3B, Teledyne excels in providing enabling technologies across diverse sectors, including aerospace, defense, and industrial applications. The company offers a wide array of products and services, from advanced monitoring instruments and digital imaging systems to electronic components for military and commercial use. Operating primarily in the U.S., Canada, the U.K., Belgium, and the Netherlands, Teledyne’s strategic positioning as an innovator strengthens its role in shaping industry standards and driving technological advancement.
Fundamental Analysis
In this section, I will analyze Teledyne Technologies Incorporated’s income statement, financial ratios, and dividend payout policy to assess its financial health and investment potential.
Income Statement
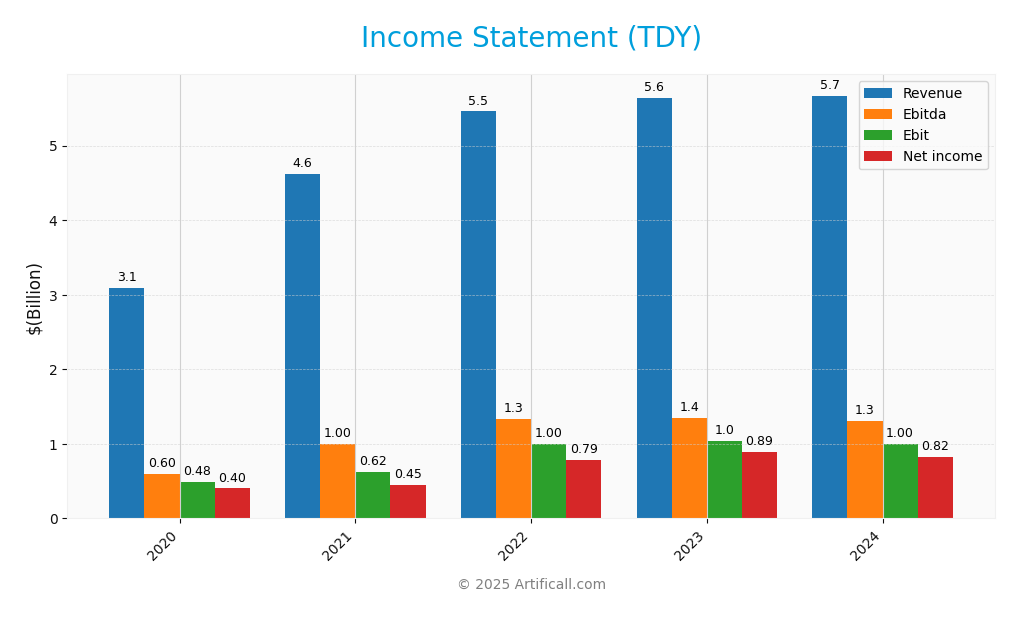
The following table presents Teledyne Technologies Incorporated’s income statement, highlighting key financial metrics over the last five fiscal years.

| Financial Metric | 2020 | 2021 | 2022 | 2023 | 2024 |
|---|---|---|---|---|---|
| Revenue | 3.09B | 4.61B | 5.46B | 5.64B | 5.67B |
| Cost of Revenue | 1.91B | 2.77B | 3.13B | 3.20B | 3.24B |
| Operating Expenses | 0.70B | 1.22B | 1.36B | 1.41B | 1.45B |
| Gross Profit | 1.18B | 1.84B | 2.33B | 2.44B | 2.43B |
| EBITDA | 0.60B | 0.99B | 1.33B | 1.35B | 1.31B |
| EBIT | 0.49B | 0.62B | 0.99B | 1.04B | 1.00B |
| Interest Expense | 0.02B | 0.09B | 0.09B | 0.08B | 0.06B |
| Net Income | 0.40B | 0.45B | 0.79B | 0.89B | 0.82B |
| EPS | 10.95 | 10.31 | 16.85 | 18.71 | 17.43 |
| Filing Date | N/A | 2022-02-25 | 2023-02-24 | 2023-12-31 | 2025-02-21 |
Interpretation of Income Statement
Over the last five years, Teledyne Technologies has shown a steady increase in revenue, rising from $3.09B in 2020 to $5.67B in 2024. However, net income has fluctuated, peaking at $0.89B in 2023 before dropping slightly to $0.82B in 2024, indicating a potential slowdown in profit growth. While gross profit margins have remained relatively stable, the slight decrease in net income suggests rising costs or increased competition. The most recent year reflects a robust revenue growth, yet a decline in earnings per share (EPS) underscores the need for careful monitoring of operating expenses and market conditions.
Financial Ratios
Here are the financial ratios for Teledyne Technologies Incorporated (Ticker: TDY) over the available fiscal years.
| Ratio | 2020 | 2021 | 2022 | 2023 | 2024 |
|---|---|---|---|---|---|
| Net Margin | 13.02% | 9.65% | 14.45% | 15.72% | 14.45% |
| ROE | 12.45% | 5.84% | 9.65% | 9.61% | 8.58% |
| ROIC | 9.29% | 4.03% | 6.43% | 7.16% | 6.67% |
| P/E | 35.79 | 42.38 | 23.73 | 23.85 | 26.53 |
| P/B | 4.46 | 2.48 | 2.29 | 2.29 | 2.28 |
| Current Ratio | 2.26 | 1.62 | 1.85 | 1.69 | 2.33 |
| Quick Ratio | 1.81 | 1.12 | 1.27 | 1.17 | 1.61 |
| D/E | 0.24 | 0.54 | 0.48 | 0.35 | 0.29 |
| Debt-to-Assets | 15.31% | 28.38% | 27.31% | 22.34% | 19.64% |
| Interest Coverage | 31.38 | 6.88 | 10.88 | 13.38 | 17.08 |
| Asset Turnover | 0.61 | 0.32 | 0.38 | 0.39 | – |
| Fixed Asset Turnover | 6.31 | 5.58 | 7.09 | 7.25 | 7.61 |
| Dividend Yield | 0% | 0% | 0% | 0% | 0% |
Interpretation of Financial Ratios
Teledyne Technologies (TDY) exhibits a solid financial health profile based on its latest ratios. The liquidity ratios are strong, with a current ratio of 2.33 and a quick ratio of 1.61, indicating effective short-term asset management. The solvency ratio stands at 0.24, suggesting manageable debt levels, while the debt-to-equity ratio of 0.29 reflects a conservative leverage approach. Profitability metrics show a net profit margin of 14.45% and an operating profit margin of 17.44%, which are respectable and indicate efficient cost management. However, the price-to-earnings ratio of 26.53 may suggest the stock is overvalued relative to its earnings, which could be a concern for potential investors.
Evolution of Financial Ratios
Over the past five years, Teledyne’s financial ratios have demonstrated a positive trend, particularly in profitability and liquidity. The current ratio improved from 1.62 in 2021 to 2.33 in 2024, indicating enhanced short-term financial stability. Additionally, the net profit margin has increased from 9.65% in 2021 to 14.45% in 2024, reflecting improved operational efficiency.
Distribution Policy
Teledyne Technologies Incorporated (TDY) does not pay dividends, which is indicative of its strategy to reinvest earnings into growth initiatives and research and development. This decision aligns with the company’s high-growth phase, aiming to enhance long-term shareholder value. Additionally, TDY engages in share buybacks, which can provide value to shareholders by reducing the number of outstanding shares. Overall, this approach supports sustainable long-term value creation, provided the reinvestments yield favorable returns.
Sector Analysis
Teledyne Technologies (TDY) operates in the Hardware, Equipment & Parts industry, offering advanced technological solutions across various sectors including aerospace, defense, and industrial applications, facing competition from established players while leveraging its innovation strengths.
Strategic Positioning
Teledyne Technologies Incorporated (TDY) commands a robust market presence within the Hardware, Equipment & Parts industry, boasting a market cap of approximately 23.3B. The company excels in sectors like industrial growth markets, instrumentation, and aerospace and defense electronics, where it faces competitive pressure from both established players and emerging technologies. With a beta of 1.026, TDY reflects market stability while navigating potential technological disruptions. As it continuously innovates in digital imaging and sensing technologies, I remain cautious about market fluctuations, which can impact its competitive positioning.
Revenue by Segment
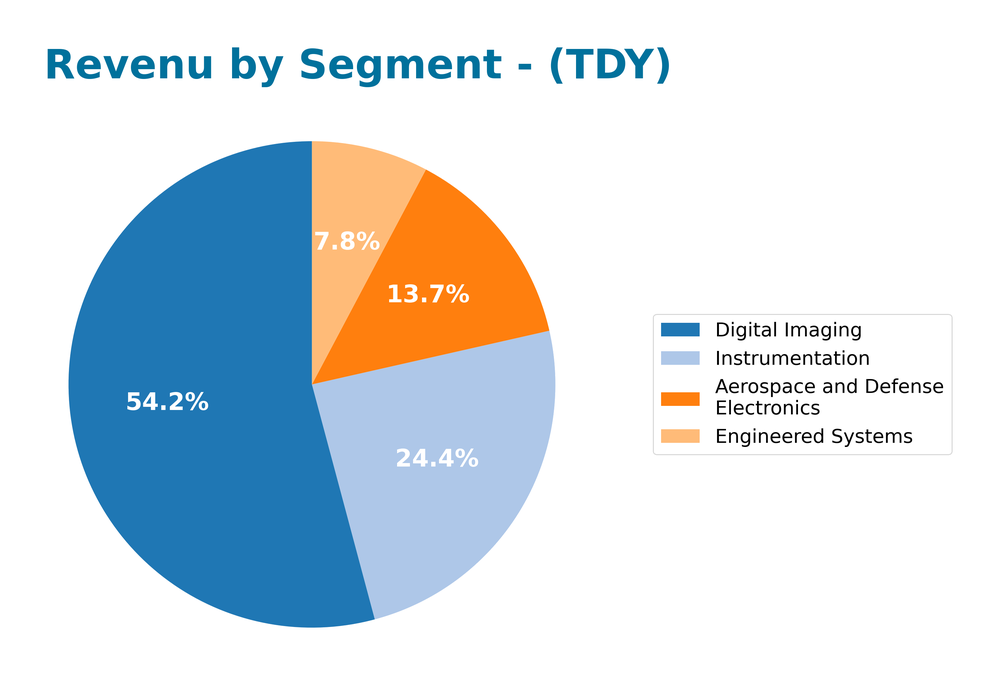
The following chart illustrates Teledyne Technologies’ revenue distribution across its key segments for the fiscal year 2024.

In FY 2024, Teledyne’s revenue segments showed a solid performance, with Digital Imaging leading at 3.07B, followed by Instrumentation at 1.38B, Aerospace and Defense Electronics at 776M, and Engineered Systems at 440M. Notably, Digital Imaging remained a strong driver, although its revenue slightly decreased compared to the previous year. Instrumentation also showed resilience, highlighting its importance in the product mix. However, the Aerospace and Defense segment experienced slower growth, which may present some concentration risks if market conditions change. Overall, while growth across segments remains positive, investors should monitor these trends closely for any signs of volatility.
Key Products
Teledyne Technologies Incorporated offers a diverse range of products tailored to various industrial growth markets. Below is a table summarizing some of their key products:
| Product | Description |
|---|---|
| Monitoring Instruments | Devices used for environmental, industrial, and marine monitoring, providing real-time data. |
| Digital Cameras | High-performance cameras for industrial machine vision and quality control applications. |
| Thermal Imaging Systems | Advanced imaging solutions for industrial and medical applications, including threat detection. |
| Electronic Test Equipment | Tools designed for testing and measuring electronic systems, ensuring quality and compliance. |
| Aerospace Components | Subsystems and components for aircraft communication and data acquisition in defense applications. |
| Electrochemical Energy Systems | Systems designed for military applications, focusing on energy efficiency and performance. |
| Infrared Sensors | Sensors used in various applications, including government and industrial sectors. |
These products showcase Teledyne’s commitment to providing innovative solutions across multiple sectors, including technology, defense, and industrial markets.
Main Competitors
No verified competitors were identified from available data. Teledyne Technologies Incorporated holds an estimated market share in the technology sector, focusing on hardware, equipment, and parts. The company maintains a competitive position due to its diverse product offerings in instrumentation, digital imaging, aerospace, and defense electronics, operating primarily in the United States and internationally.
Competitive Advantages
Teledyne Technologies Incorporated (TDY) boasts a diverse portfolio that positions it strongly across various industrial growth markets. Its advanced instrumentation and digital imaging capabilities provide critical support for sectors such as aerospace, defense, and environmental monitoring. Looking ahead, Teledyne’s commitment to innovation in areas like thermal imaging and sensor networks opens up new opportunities in emerging markets. Additionally, the company’s strong focus on systems engineering and integration allows it to cater to complex projects, enhancing its competitive edge and resilience in the face of market fluctuations.
SWOT Analysis
The following SWOT analysis provides a succinct overview of Teledyne Technologies Incorporated’s current strategic position.
Strengths
- Strong market position
- Diverse product offerings
- Robust revenue growth
Weaknesses
- High dependency on defense contracts
- Limited dividend history
- Fluctuating market demand
Opportunities
- Expanding industrial markets
- Advancements in technology
- Potential for strategic acquisitions
Threats
- Intense competition
- Regulatory changes
- Economic downturns
Overall, the SWOT assessment indicates that Teledyne Technologies holds a strong competitive position with significant growth opportunities. However, it must navigate potential threats and weaknesses strategically to sustain its market leadership and ensure long-term profitability.
Stock Analysis
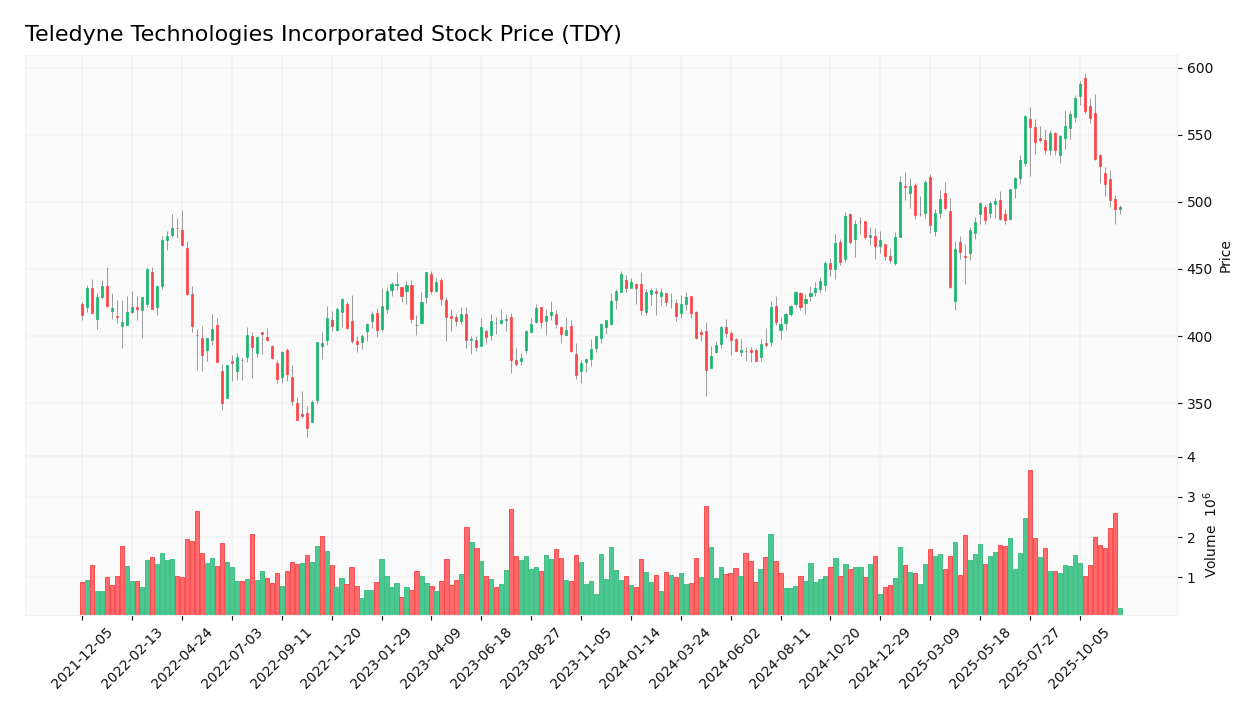
Teledyne Technologies Incorporated (Ticker: TDY) has demonstrated notable price movements over the past year, with a bullish overall trend despite recent fluctuations. The stock’s dynamics indicate a complex trading environment influenced by various market factors.

Trend Analysis
Over the past year, Teledyne’s stock has experienced a percentage change of +13.95%, indicating a bullish trend. However, a recent analysis from September 14, 2025, to November 30, 2025, indicates a decline of -10.8%, suggesting a bearish short-term trend. The highest price recorded during this period was 587.62, while the lowest was 374.64. Notably, the overall trend shows signs of deceleration, with a standard deviation of 53.46 reflecting increased volatility in the stock price.
Volume Analysis
In the last three months, the total trading volume for Teledyne was 158.59M, with buyer-driven activity accounting for approximately 52.13% of the transactions. Volume has been increasing, suggesting a growing interest from investors. However, during the recent period from September 14, 2025, to November 30, 2025, the buyer volume decreased to 5.72M, while seller volume rose to 12.68M, indicating a seller-dominant market sentiment in this timeframe. This shift may reflect caution among investors, as they respond to the recent price adjustments.
Analyst Opinions
Recent analyst recommendations for Teledyne Technologies Incorporated (TDY) indicate a generally positive outlook. The company received a B+ rating, with a strong discounted cash flow score of 4, reflecting solid growth potential. Analysts highlight TDY’s robust return on equity (3) and return on assets (4) as key strengths, although its debt-to-equity (2) and price-to-earnings (2) scores suggest caution. Overall, the consensus leans towards a “buy” for 2025, emphasizing the company’s potential for value creation despite some financial risks.
Stock Grades
Teledyne Technologies Incorporated (TDY) has received consistent ratings from several reputable grading companies, indicating a stable outlook.
| Grading Company | Action | New Grade | Date |
|---|---|---|---|
| Needham | Maintain | Buy | 2025-10-23 |
| Barclays | Maintain | Equal Weight | 2025-10-23 |
| Stifel | Maintain | Buy | 2025-10-23 |
| Morgan Stanley | Maintain | Equal Weight | 2025-10-15 |
| UBS | Maintain | Buy | 2025-07-24 |
| Needham | Maintain | Buy | 2025-07-23 |
| Morgan Stanley | Maintain | Equal Weight | 2025-07-17 |
| Needham | Maintain | Buy | 2025-04-24 |
| TD Securities | Maintain | Buy | 2025-04-24 |
| B of A Securities | Maintain | Buy | 2025-03-17 |
Overall, the trend in grades for TDY shows a strong preference for “Buy,” with multiple firms maintaining this rating, while a couple of firms have opted for “Equal Weight.” This suggests that analysts believe in the stock’s potential while advising caution on aggressive positioning.
Target Prices
The current consensus target prices for Teledyne Technologies Incorporated (TDY) reflect a positive outlook among analysts.
| Target High | Target Low | Consensus |
|---|---|---|
| 645 | 584 | 616 |
Analysts expect Teledyne Technologies to reach a consensus target price of 616, indicating a solid potential for growth within the projected range.
Consumer Opinions
Consumer sentiment around Teledyne Technologies Incorporated suggests a mixed perception, with both commendations and criticisms highlighting key aspects of their products and services.
| Positive Reviews | Negative Reviews |
|---|---|
| “Excellent product range and innovative solutions.” | “Customer service response times are slow.” |
| “High-quality technology that meets our needs.” | “Pricing is on the higher side for some.” |
| “Reliable performance and great durability.” | “Limited options for customization.” |
| “Strong reputation in the industry.” | “Occasional technical issues with products.” |
Overall, consumer feedback indicates that Teledyne excels in product quality and innovation but faces challenges with customer service and pricing.
Risk Analysis
In this section, I will outline the key risks associated with investing in Teledyne Technologies Incorporated (TDY) to help you make informed decisions.
| Category | Description | Probability | Impact |
|---|---|---|---|
| Market Risk | Fluctuations in market demand affecting revenue. | High | High |
| Regulatory Risk | Changes in regulations impacting operations and costs. | Medium | High |
| Supply Chain Risk | Disruptions in supply chains affecting production. | Medium | Medium |
| Technological Risk | Rapid technological changes requiring constant adaptation. | High | Medium |
| Competitive Risk | Intense competition leading to price pressures. | High | Medium |
Investors should be particularly cautious of market and regulatory risks, especially given the increasing scrutiny on technology companies in recent years.
Should You Buy Teledyne Technologies Incorporated?
Teledyne Technologies reported a positive net income of 819.2M for the fiscal year 2024, indicating strong profitability. The company’s total debt stands at 2.79B, which requires careful monitoring given the overall capital structure. The rating for Teledyne is B+, suggesting a solid performance relative to its peers.
Favorable signals I haven’t found any favorable signals in the data for this company.
Unfavorable signals The company has a total debt of 2.79B, which represents a significant financial commitment. The recent trend analysis shows a seller-dominant market with recent seller volume exceeding recent buyer volume, indicating a potential lack of demand for the stock. Additionally, the trend in the recent period has been negative, with a price change of -10.8%. The net margin stands at 14.45%, while the return on invested capital (ROIC) is at 6.67%, which is less than the weighted average cost of capital (WACC) of 7.9%, suggesting value destruction.
Conclusion Considering the lack of favorable signals and the presence of several unfavorable indicators, it might be more prudent to wait for improvements in the company’s financial outlook and market conditions before considering an investment in Teledyne Technologies.
Disclaimer: This article is not financial advice. Each investor is responsible for their own investment decisions.
Additional Resources
- Entropy Technologies LP Grows Position in Teledyne Technologies Incorporated $TDY – MarketBeat (Nov 24, 2025)
- Why Is Teledyne (TDY) Down 9.7% Since Last Earnings Report? – Yahoo Finance (Nov 21, 2025)
- DNB Asset Management AS Increases Position in Teledyne Technologies Incorporated $TDY – MarketBeat (Nov 24, 2025)
- Is Wall Street Bullish or Bearish on Teledyne Technologies Stock? – inkl (Nov 24, 2025)
- Teledyne Technologies Inc. Stock Underperforms Wednesday When Compared To Competitors – 富途牛牛 (Nov 19, 2025)
For more information about Teledyne Technologies Incorporated, please visit the official website: teledyne.com


