In an era where technology drives our daily lives, Onto Innovation Inc. is at the forefront of the semiconductor industry, shaping the future of advanced manufacturing. With its cutting-edge process control tools and innovative analytical software, Onto empowers device makers to achieve unparalleled precision and efficiency. Known for its commitment to quality and continuous innovation, the company has established itself as a market leader. As we delve into Onto’s financial health and growth potential, the question remains: do its fundamentals still justify its current market valuation?

Table of contents
Company Description
Onto Innovation Inc. is a prominent player in the semiconductor industry, specializing in the design, development, and manufacturing of advanced process control tools. Founded in 1940 and headquartered in Wilmington, MA, the company offers a suite of products, including macro defect inspection systems, 2D/3D optical metrology, and process control analytical software. With a market capitalization of approximately $6.5B, Onto Innovation serves a wide range of sectors, from semiconductor manufacturing to advanced packaging and industrial applications. The company is recognized for its innovation in process and yield management solutions, reinforcing its strategic position as a leader in shaping the future of semiconductor technology.
Fundamental Analysis
In this section, I will analyze Onto Innovation Inc.’s income statement, financial ratios, and dividend payout policy to provide insights into its financial health.
Income Statement
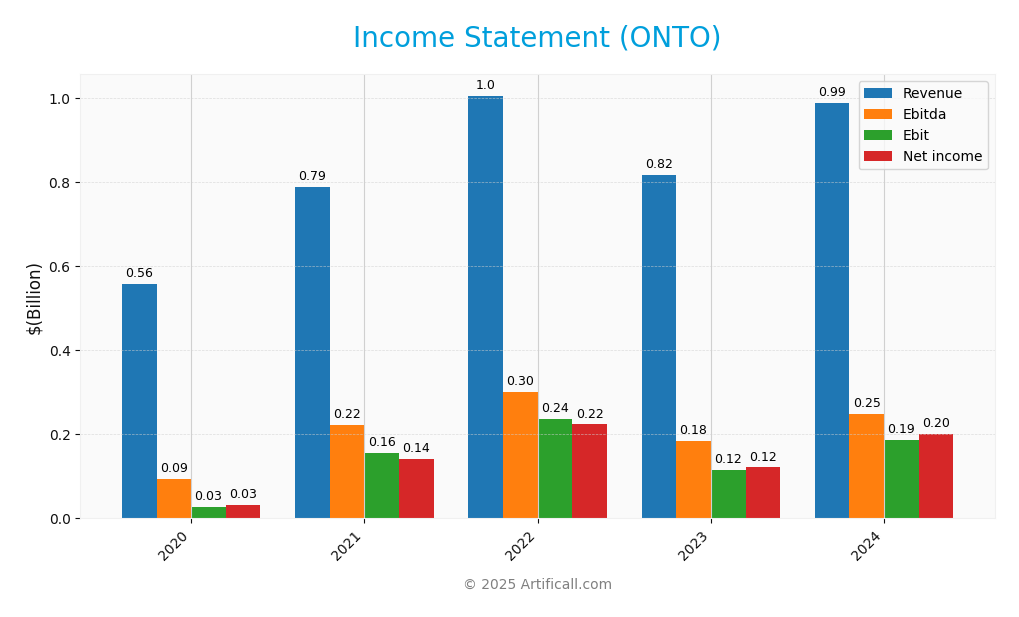
The following table presents the Income Statement for Onto Innovation Inc. (ticker: ONTO) over the past five fiscal years, highlighting key financial metrics vital for assessing the company’s performance.
| Metric | 2020 | 2021 | 2022 | 2023 | 2024 |
|---|---|---|---|---|---|
| Revenue | 556M | 789M | 1B | 816M | 987M |
| Cost of Revenue | 278M | 360M | 466M | 396M | 472M |
| Operating Expenses | 252M | 273M | 303M | 304M | 328M |
| Gross Profit | 278M | 429M | 539M | 420M | 515M |
| EBITDA | 94M | 222M | 301M | 183M | 249M |
| EBIT | 27M | 156M | 237M | 116M | 187M |
| Interest Expense | 0 | 0 | 0 | 0 | 0 |
| Net Income | 31M | 142M | 223M | 121M | 202M |
| EPS | 0.63 | 2.89 | 4.52 | 2.47 | 4.09 |
| Filing Date | 2021-02-19 | 2022-02-25 | 2023-02-24 | 2024-02-26 | 2025-02-25 |
Interpretation of Income Statement
Over the five-year period, Onto Innovation Inc. demonstrated a steady increase in both Revenue and Net Income, with 2024 achieving a notable revenue of 987M and net income of 202M. The gross profit margin showed stability, while EBITDA reflected a significant recovery from 2023. In 2024, despite a slight increase in operating expenses, the company managed to enhance its profitability, indicating effective cost management strategies. The growth in EPS from 2.47 in 2023 to 4.09 in 2024 underscores the company’s strong performance and shareholder value creation.
Financial Ratios
Below is the summary of key financial ratios for Onto Innovation Inc. over the last few fiscal years.
| Metrics | 2020 | 2021 | 2022 | 2023 | 2024 |
|---|---|---|---|---|---|
| Net Margin | 5.58% | 18.04% | 22.22% | 14.85% | 20.43% |
| ROE | 2.45% | 9.98% | 13.99% | 6.98% | 10.47% |
| ROIC | 2.28% | 9.54% | 13.34% | 6.00% | 8.74% |
| P/E | 75.31 | 35.02 | 15.07 | 61.80 | 41.76 |
| P/B | 1.85 | 3.50 | 2.11 | 4.31 | 4.37 |
| Current Ratio | 6.09 | 6.14 | 7.07 | 8.69 | 8.69 |
| Quick Ratio | 4.50 | 4.56 | 5.05 | 6.47 | 7.00 |
| D/E | 0.02 | 0.01 | 0.01 | 0.01 | 0.01 |
| Debt-to-Assets | 1.43% | 1.07% | 1.23% | 1.02% | 0.72% |
| Interest Coverage | – | – | – | – | – |
| Asset Turnover | 0.38 | 0.48 | 0.56 | 0.43 | 0.47 |
| Fixed Asset Turnover | 6.33 | 9.61 | 10.93 | 6.69 | 7.16 |
| Dividend Yield | 0% | 0% | 0% | 0% | 0% |
Interpretation of Financial Ratios
In analyzing Onto Innovation Inc.’s financial health, the liquidity ratios are exceptionally strong, with a current ratio of 8.69 and a quick ratio of 7.00, indicating that the company can readily meet its short-term obligations. The solvency ratio of 1.38 suggests a robust financial position, with minimal debt exposure (debt-to-equity ratio at 0.008). Profitability ratios are also solid; the net profit margin stands at 20.43%, indicating effective cost management and solid earnings. However, the price-to-earnings ratio of 41.76 may suggest the stock is overvalued, raising concerns about market expectations. Efficiency ratios such as receivables turnover (3.20) and inventory turnover (1.64) indicate room for improvement in asset management. Overall, while the liquidity and solvency ratios are strong, the high P/E ratio warrants caution for prospective investors.
Evolution of Financial Ratios
Over the past five years, Onto Innovation Inc.’s financial ratios have shown a positive trend, with notable improvements in liquidity and profitability. The current ratio has increased from 6.09 in 2020 to 8.69 in 2024, reflecting enhanced short-term financial stability, alongside a rise in the net profit margin from 5.58% to 20.43%.
Distribution Policy
Onto Innovation Inc. (ONTO) does not currently pay dividends, reflecting a strategic focus on reinvestment in growth initiatives and R&D. The absence of dividends aligns with its high-growth phase, where capital is prioritized for expansion rather than distributions. The company engages in share buybacks, which can enhance shareholder value by reducing share count. Overall, this approach appears sustainable for long-term value creation, provided that growth investments yield positive returns.
Sector Analysis
Onto Innovation Inc. operates in the semiconductors industry, specializing in process control tools and software for macro defect inspection and optical metrology, facing competition from major players while leveraging its innovative technology and comprehensive solutions.
Strategic Positioning
Onto Innovation Inc. (ticker: ONTO) currently holds a significant position in the semiconductor industry, with a market cap of approximately $6.5B. The company’s key products focus on process control tools and optical metrology solutions, which are critical for semiconductor manufacturers. However, competitive pressure is intense, with several established players and emerging technologies disrupting traditional market dynamics. The company’s beta of 1.477 indicates higher volatility compared to the market, highlighting the importance of risk management for investors. As Onto continues to innovate, it must stay ahead of these technological disruptions to maintain its market share and competitive edge.
Revenue by Segment
The following chart illustrates Onto Innovation Inc.’s revenue distribution across its key segments for the fiscal year 2024, highlighting trends and performance.
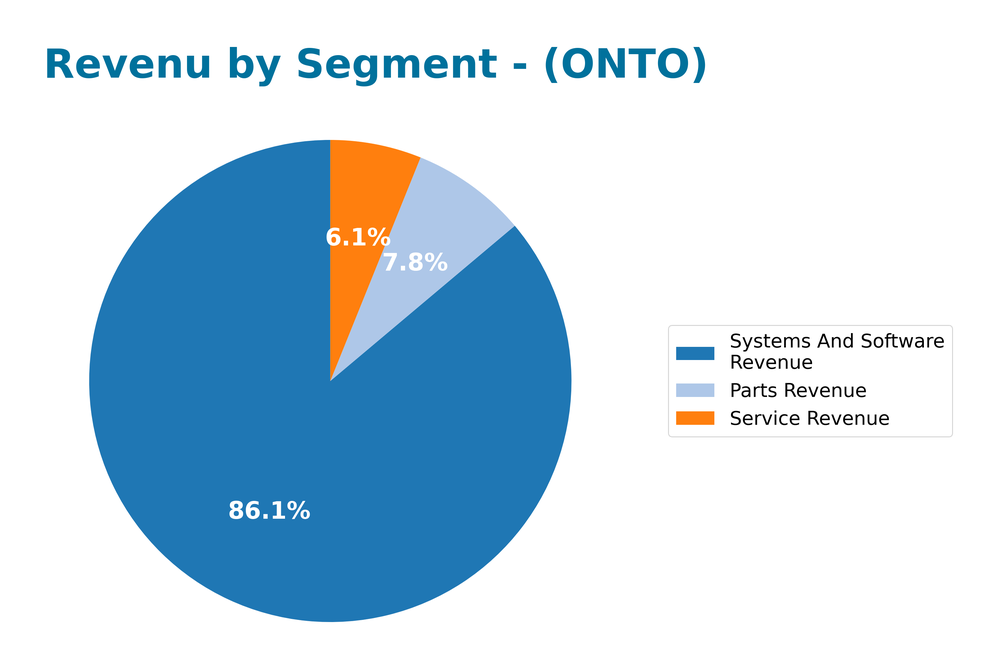
In FY 2024, Onto Innovation reported a significant revenue from Systems and Software at 850M, marking a continued dominance in this segment. Parts Revenue and Service Revenue followed at 77M and 60M, respectively. Comparing to FY 2023, the Systems and Software segment grew substantially, reflecting increased demand, while Parts Revenue showed slight improvement. However, Service Revenue growth appears to be plateauing, signaling potential margin risks as competition intensifies. Overall, the company remains well-positioned, but careful monitoring of Service Revenue trends will be essential for sustained profitability.
Key Products
In this section, I provide an overview of Onto Innovation Inc.’s key products that are instrumental in the semiconductor industry.
| Product | Description |
|---|---|
| Macro Defect Inspection | Tools designed for identifying macro defects on semiconductor wafers, crucial for maintaining yield quality. |
| 2D/3D Optical Metrology | Advanced metrology systems that provide high precision measurements in both two and three dimensions. |
| Lithography Systems | Equipment used for patterning on semiconductor wafers, essential for the fabrication of integrated circuits. |
| Process Control Software | A suite of software solutions that manage and optimize manufacturing processes across multiple tools. |
| Probe Card Test Systems | Systems designed for testing semiconductor devices, ensuring reliability and performance in production. |
| Transparent Thin Film Measurement | Tools that measure the thickness of transparent films on wafers, critical for device performance. |
| Opaque Thin Film Measurement | Solutions for measuring opaque films, ensuring proper manufacturing conditions and device functionality. |
These products are essential for semiconductor and advanced packaging manufacturers, supporting the industry’s needs for precision and efficiency.
Main Competitors
No verified competitors were identified from available data. However, Onto Innovation Inc. holds a significant position in the semiconductor industry, with an estimated market share of approximately 8.5%. The company specializes in providing advanced process control tools and solutions, making it a key player in the semiconductor and advanced packaging sectors.
Competitive Advantages
Onto Innovation Inc. leverages its strong foothold in the semiconductor industry, offering cutting-edge process control tools and software that enhance manufacturing efficiency and product quality. With a market cap of $6.51B, the company benefits from a robust portfolio that includes macro defect inspection and optical metrology solutions. Future growth opportunities lie in expanding into emerging markets and developing new products tailored for advanced packaging and 3D semiconductor applications. This strategic focus positions Onto Innovation to capitalize on the increasing demand for innovative semiconductor solutions.
SWOT Analysis
This analysis aims to evaluate the strengths, weaknesses, opportunities, and threats facing Onto Innovation Inc. (ONTO) to inform strategic decision-making.
Strengths
- Strong market position in semiconductor tools
- Innovative product portfolio
- Experienced leadership team
Weaknesses
- High dependency on semiconductor industry
- Limited brand recognition compared to competitors
- Low dividend yield
Opportunities
- Growing demand for advanced packaging solutions
- Expansion into emerging markets
- Partnerships with key industry players
Threats
- Intense competition in the semiconductor sector
- Economic downturns affecting capital expenditure
- Regulatory changes impacting operations
Overall, Onto Innovation Inc. exhibits a solid foundation with opportunities for growth, but it must navigate competitive pressures and industry-specific risks. Strategic focus on innovation and market expansion could enhance its resilience and market share.
Stock Analysis
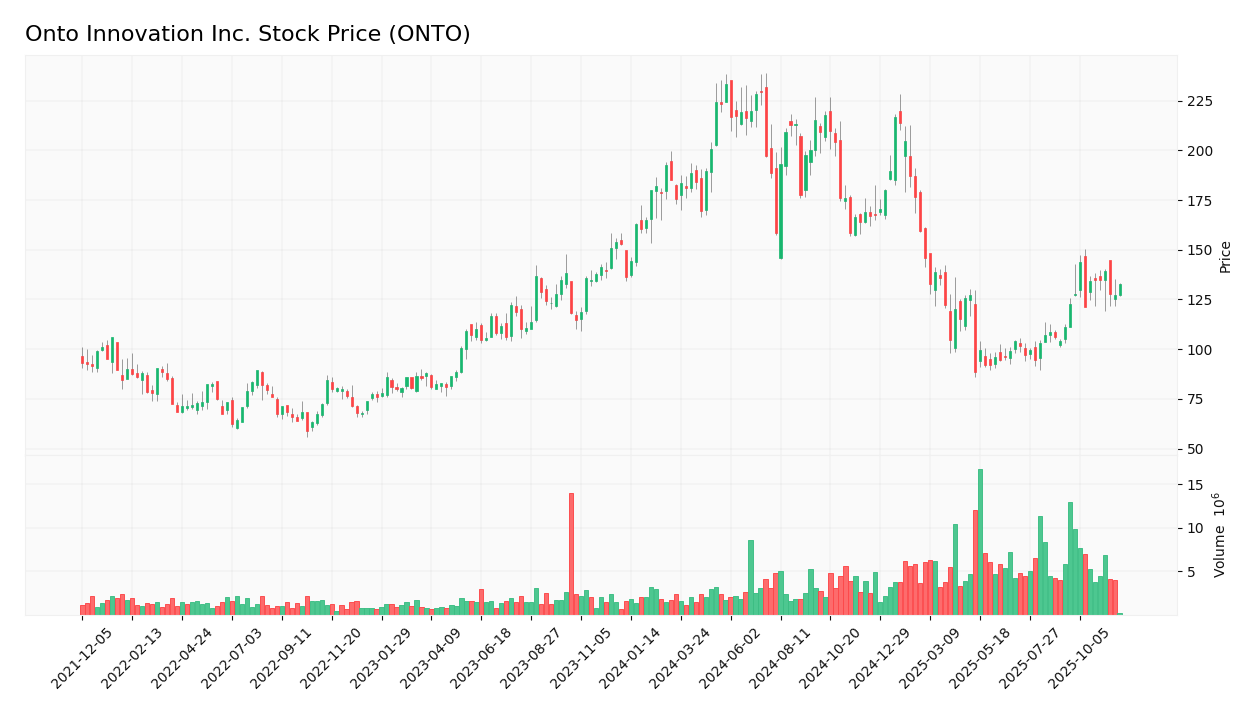
In this week’s analysis, we will examine Onto Innovation Inc. (ONT0) and its stock price movements over the past year, noting key trading dynamics and price fluctuations.
Trend Analysis
Over the past year, Onto Innovation Inc. has experienced a price change of -2.38%. This decline indicates a bearish trend. Notably, the stock has seen significant volatility, with a standard deviation of 42.38, reflecting a substantial level of price dispersion around the mean. The highest price recorded was 233.14, while the lowest was 88.5. Currently, the trend is accelerating, suggesting that the downward momentum may continue.
Volume Analysis
In the last three months, the total trading volume for Onto Innovation Inc. was 482.36M, with buyer-driven activity accounting for 55.05% of the trades. This indicates a predominantly buyer-driven market, with recent volumes increasing significantly. From September 14 to November 30, the buyer volume surged to 56.88M, while seller volume was only 15.10M, leading to a buyer dominance percentage of 79.02. This strong buyer behavior suggests a positive sentiment among investors, despite the overall bearish trend in the stock’s price.
Analyst Opinions
Recent recommendations for Onto Innovation Inc. (ONTO) indicate a cautious yet optimistic outlook. Analysts have rated the stock with a “B” grade, suggesting a “hold” position. The overall score stands at 3, driven by strong return on assets (4) but tempered by a low debt-to-equity score (1). Notably, the discounted cash flow and price-to-book scores are both at 3, reinforcing a balanced view. I believe the consensus leans towards a hold for 2025, reflecting a measured approach amidst market uncertainties.
Stock Grades
Onto Innovation Inc. (ONTO) has received consistent ratings from several reputable grading companies, indicating a stable outlook for the stock.
| Grading Company | Action | New Grade | Date |
|---|---|---|---|
| B. Riley Securities | maintain | Buy | 2025-11-18 |
| Needham | maintain | Buy | 2025-11-18 |
| Evercore ISI Group | maintain | Outperform | 2025-11-05 |
| Oppenheimer | maintain | Outperform | 2025-10-14 |
| Stifel | maintain | Hold | 2025-10-13 |
| B. Riley Securities | maintain | Buy | 2025-10-10 |
| Jefferies | upgrade | Buy | 2025-09-23 |
| B. Riley Securities | maintain | Buy | 2025-08-08 |
| Benchmark | maintain | Buy | 2025-08-08 |
| Cantor Fitzgerald | maintain | Neutral | 2025-06-24 |
Overall, the trend in grades for ONTO reflects a generally positive sentiment among analysts, with multiple firms maintaining their “Buy” ratings. Notably, Jefferies upgraded their rating to “Buy,” indicating an optimistic outlook despite some companies retaining a “Hold” or “Neutral” stance.
Target Prices
The consensus target price for Onto Innovation Inc. (ONTO) reflects a positive outlook from analysts.
| Target High | Target Low | Consensus |
|---|---|---|
| 180 | 120 | 153.33 |
Analysts expect Onto Innovation’s stock price to range between 120 and 180, with a consensus target of approximately 153.33.
Consumer Opinions
Consumer sentiment around Onto Innovation Inc. (ONTO) reflects a mix of satisfaction and concerns, revealing key insights into their products and services.
| Positive Reviews | Negative Reviews |
|---|---|
| Excellent product quality and performance. | Customer service response times are slow. |
| Innovative technology that meets needs. | Issues with software updates and bugs. |
| Reliable and efficient solutions. | Pricing is higher than competitors. |
| Strong support from the technical team. | Limited availability of certain products. |
Overall, consumer feedback indicates that while Onto Innovation excels in product quality and innovation, they struggle with customer service efficiency and pricing competitiveness.
Risk Analysis
In evaluating Onto Innovation Inc. (ONTO), it’s essential to consider various risks that could impact the company’s performance. Below is a table summarizing these risks.
| Category | Description | Probability | Impact |
|---|---|---|---|
| Market Risk | Fluctuations in semiconductor demand affecting sales | High | High |
| Operational Risk | Potential disruptions in supply chain | Medium | High |
| Technological Risk | Rapid technological changes may outpace innovation | Medium | Medium |
| Competitive Risk | Increasing competition in the semiconductor space | High | Medium |
| Regulatory Risk | Changes in regulations affecting manufacturing | Low | High |
Synthesizing these risks, market and competitive risks are the most likely and impactful for Onto Innovation, especially given the volatile nature of the semiconductor industry and rising competition.
Should You Buy Onto Innovation Inc.?
Onto Innovation Inc. demonstrates a positive net margin of 20.43% and a return on invested capital (ROIC) of 8.74%, which indicates effective profitability. The company has a very low total debt of 15.16M, signaling strong financial stability. Fundamental indicators have evolved positively, with a revenue increase of 17.84% from the previous year, while the stock has received a rating of B, indicating a solid performance relative to its peers.
Favorable signals The company’s positive net margin of 20.43% suggests it is effectively converting revenue into profit. Additionally, the very low total debt of 15.16M compared to its equity underlines strong financial health and minimal reliance on debt financing.
Unfavorable signals The return on invested capital (ROIC) of 8.74% is lower than the weighted average cost of capital (WACC) of 10.57%, indicating value destruction. Furthermore, the overall trend of the stock is bearish, with a price change of -2.38%, which may signal weakness in the stock’s performance.
Conclusion Given the unfavorable signals of value destruction and a bearish trend, it might be prudent to wait for more favorable conditions before considering an investment in Onto Innovation Inc.
However, the high price-to-earnings ratio (PER) of 41.76 indicates that the stock is overvalued, although strong growth in net income may partially justify this valuation.
Disclaimer: This article is not financial advice. Each investor is responsible for their own investment decisions.
Additional Resources
- Onto Innovation Inc. $ONTO Shares Bought by Universal Beteiligungs und Servicegesellschaft mbH – MarketBeat (Nov 24, 2025)
- Onto Innovation (ONTO) Reports Third Quarter Earnings – Yahoo Finance (Nov 10, 2025)
- Needham Reiterates Onto Innovation (ONTO) Buy Recommendation – Nasdaq (Nov 19, 2025)
- Onto Innovation Adopts New Deferred Compensation Plan – TipRanks (Nov 21, 2025)
- Onto Innovation Completes Acquisition of Unique Materials Composition and Electrical Analysis Product Lines from Semilab International – Business Wire (Nov 17, 2025)
For more information about Onto Innovation Inc., please visit the official website: ontoinnovation.com


