Home > Analyses > Technology > Nova Ltd.
Nova Ltd. drives precision in semiconductor manufacturing, shaping the chips powering our digital world. Its advanced metrology platforms ensure flawless process control across critical steps like lithography and etch. As a technology innovator from Israel, Nova commands respect for its specialized solutions that serve top logic, memory, and foundry clients globally. The key question now: does Nova’s robust market position still justify its premium valuation and future growth prospects?

Table of contents
Business Model & Company Overview
Nova Ltd., founded in 1993 and headquartered in Rehovot, Israel, stands as a leader in semiconductor process control systems. Its integrated ecosystem of metrology platforms covers dimensional, film, material, and chemical measurements. Serving logic, foundries, memory manufacturers, and equipment makers, Nova drives critical manufacturing steps like lithography and etch, anchoring its dominant position in a complex, high-tech industry.
The company’s revenue engine balances advanced hardware with specialized software for process control, creating recurring value in a capital-intensive sector. Nova operates globally, with a footprint spanning Israel, Taiwan, the US, China, and Korea. This geographic diversity supports resilience and growth. Its competitive advantage lies in technological depth and customer integration, building a durable moat against rivals and helping shape semiconductor manufacturing’s future.
Financial Performance & Fundamental Metrics
I analyze Nova Ltd.’s income statement, key financial ratios, and dividend payout policy to evaluate its profitability, efficiency, and shareholder return strategy.
Income Statement
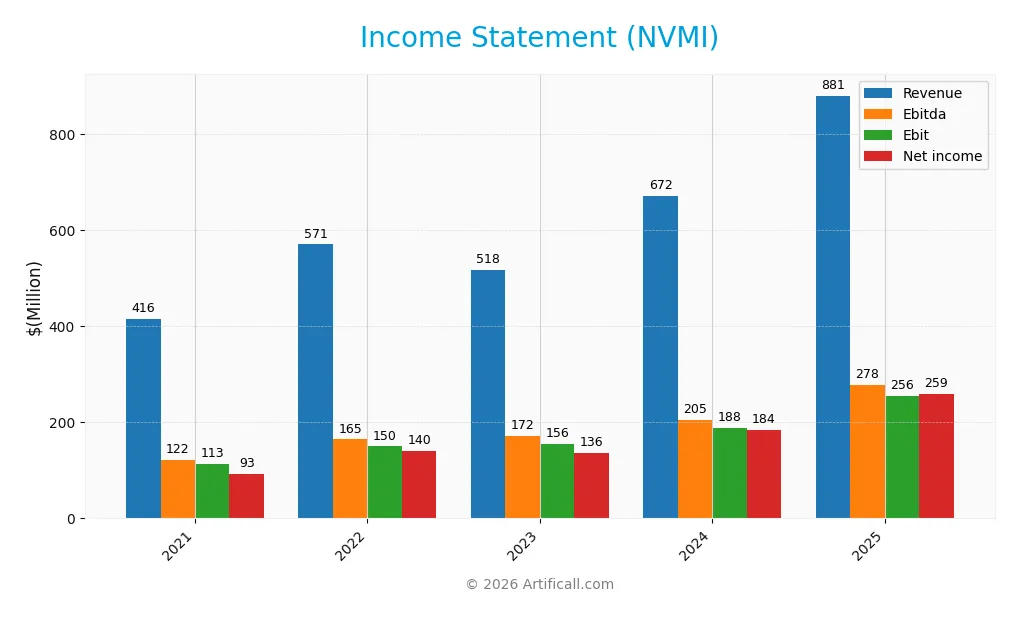
This table summarizes Nova Ltd.’s key income statement figures for fiscal years 2021 through 2025, reflecting revenue growth and profitability trends.
| 2021 | 2022 | 2023 | 2024 | 2025 | |
|---|---|---|---|---|---|
| Revenue | 416.1M | 570.7M | 517.9M | 672.4M | 880.6M |
| Cost of Revenue | 178.8M | 248.3M | 224.7M | 285.3M | 373.1M |
| Operating Expenses | 125.0M | 172.5M | 160.9M | 199.5M | 254.0M |
| Gross Profit | 237.4M | 322.4M | 293.2M | 387.1M | 507.5M |
| EBITDA | 122.4M | 164.6M | 172.4M | 204.9M | 278.1M |
| EBIT | 113.5M | 149.9M | 156.0M | 187.5M | 255.7M |
| Interest Expense | 4.4M | 1.5M | 1.5M | 1.6M | 0.0M |
| Net Income | 93.1M | 140.2M | 136.3M | 184.9M | 259.2M |
| EPS | 3.28 | 4.89 | 4.77 | 6.31 | 8.61 |
| Filing Date | 2022-03-01 | 2023-02-28 | 2024-02-20 | 2025-02-20 | 2026-02-17 |
Income Statement Evolution
Nova Ltd. shows strong revenue growth from $416M in 2021 to $880M in 2025, more than doubling over five years. Net income rose sharply by 178%, reaching $259M in 2025. Margins improved steadily, with gross margin hitting 57.6% and net margin expanding to 29.4%, reflecting efficient cost control and profitable scaling.
Is the Income Statement Favorable?
The 2025 income statement displays robust fundamentals. Revenue grew nearly 31% year-over-year, supported by a 36% rise in EBIT and a 7.7% increase in net margin. Interest expense is negligible, enhancing profitability. R&D and SG&A expenses rose proportionally with revenue, maintaining operational discipline. Overall, the income statement’s metrics align with a favorable financial profile.
Financial Ratios
The following table presents key financial ratios for Nova Ltd. (NVMI) over the last five fiscal years, illustrating profitability, liquidity, leverage, and market valuation metrics:
| Ratios | 2021 | 2022 | 2023 | 2024 | 2025 |
|---|---|---|---|---|---|
| Net Margin | 22% | 25% | 26% | 27% | 29% |
| ROE | 20% | 24% | 18% | 20% | 20% |
| ROIC | 14% | 16% | 11% | 13% | 10% |
| P/E | 45 | 17 | 29 | 31 | 41 |
| P/B | 8.8 | 4.0 | 5.3 | 6.2 | 8.1 |
| Current Ratio | 2.0 | 4.6 | 2.2 | 2.3 | 6.3 |
| Quick Ratio | 1.7 | 3.7 | 1.8 | 1.9 | 5.5 |
| D/E | 0.47 | 0.42 | 0.33 | 0.25 | 0.61 |
| Debt-to-Assets | 27% | 25% | 22% | 17% | 34% |
| Interest Coverage | 26 | 102 | 88 | 116 | 0 |
| Asset Turnover | 0.52 | 0.58 | 0.46 | 0.48 | 0.37 |
| Fixed Asset Turnover | 6.4 | 5.7 | 4.8 | 5.1 | 5.5 |
| Dividend Yield | 0% | 0% | 0% | 0% | 0% |
All figures are rounded for clarity. The interest coverage ratio for 2025 is reported as zero, warranting caution.
Evolution of Financial Ratios
Over the period, Nova Ltd.’s Return on Equity (ROE) showed moderate fluctuations, ending near 19.7% in 2025, indicating stable profitability. The Current Ratio surged notably to 6.28 in 2025, reflecting increased liquidity. Debt-to-Equity Ratio remained relatively steady around 0.6, signaling consistent leverage management despite rising debt levels.
Are the Financial Ratios Fovorable?
In 2025, Nova Ltd. displayed favorable profitability with a net margin of 29.4% and ROE at 19.7%. Liquidity is mixed; the quick ratio is favorable at 5.47, but the high current ratio of 6.28 is unfavorable, suggesting excess current assets. Leverage metrics are neutral, with a debt-to-equity ratio of 0.61. Market valuation ratios, including P/E of 41.3 and P/B of 8.1, are unfavorable, contributing to a slightly unfavorable overall assessment.
Shareholder Return Policy
Nova Ltd. (NVMI) does not pay dividends, reflecting a focus on reinvestment and growth rather than immediate shareholder payouts. The company maintains free cash flow coverage of capital expenditures at over 8x, indicating strong capacity to fund operations and potential buybacks, though no buyback programs are reported.
This approach aligns with long-term value creation by prioritizing operational strength and capital allocation flexibility. Absence of dividends and share repurchases suggests Nova reinvests earnings to support growth, which may benefit shareholders if the company sustains its solid profitability and cash flow generation.
Score analysis
The following radar chart illustrates Nova Ltd.’s key financial metric scores for a comprehensive overview:
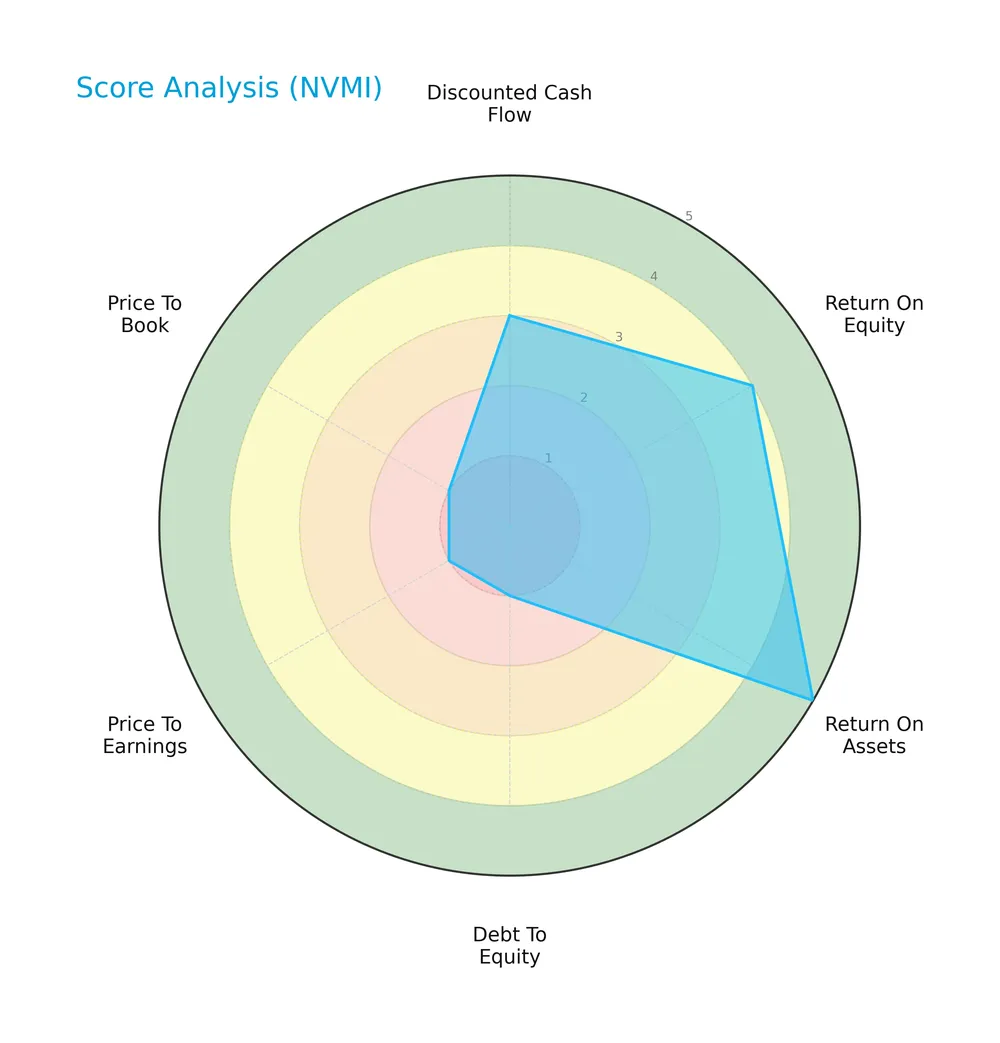
Nova Ltd. scores well on profitability with a 4 in ROE and a strong 5 in ROA. However, its leverage and valuation metrics lag, showing very unfavorable scores of 1 in debt-to-equity, PE, and PB ratios, reflecting valuation and financial structure challenges.
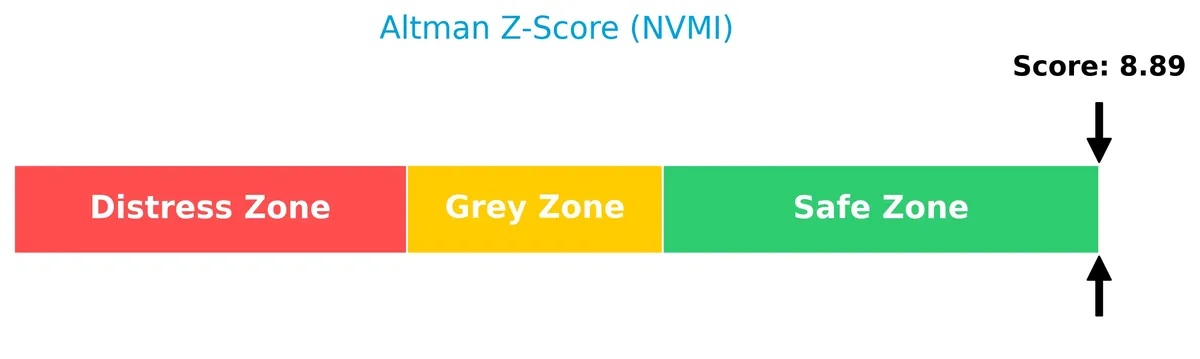
Analysis of the company’s bankruptcy risk
The Altman Z-Score places Nova Ltd. firmly in the safe zone, indicating very low bankruptcy risk based on its financial ratios:
Is the company in good financial health?
The Piotroski Score chart offers insight into Nova Ltd.’s overall financial condition based on nine key criteria:

With a Piotroski Score of 5, Nova Ltd. sits in the average range, suggesting moderate financial health but room for improvement in operational efficiency and balance sheet strength.
Competitive Landscape & Sector Positioning
This sector analysis examines Nova Ltd.’s strategic positioning, revenue segments, key products, competitors, and competitive strengths. I will assess whether Nova Ltd. holds a clear competitive advantage over its main industry rivals.
Strategic Positioning
Nova Ltd. concentrates on semiconductor process control systems, serving multiple manufacturing steps and regions including Israel, Taiwan, the US, China, and Korea. Its focused product portfolio targets logic, foundries, memory sectors, and equipment makers, emphasizing vertical specialization over broad diversification.
Revenue by Segment
This chart illustrates Nova Ltd.’s product segment revenue from 2022 through 2025, highlighting its growth trajectory over four fiscal years.
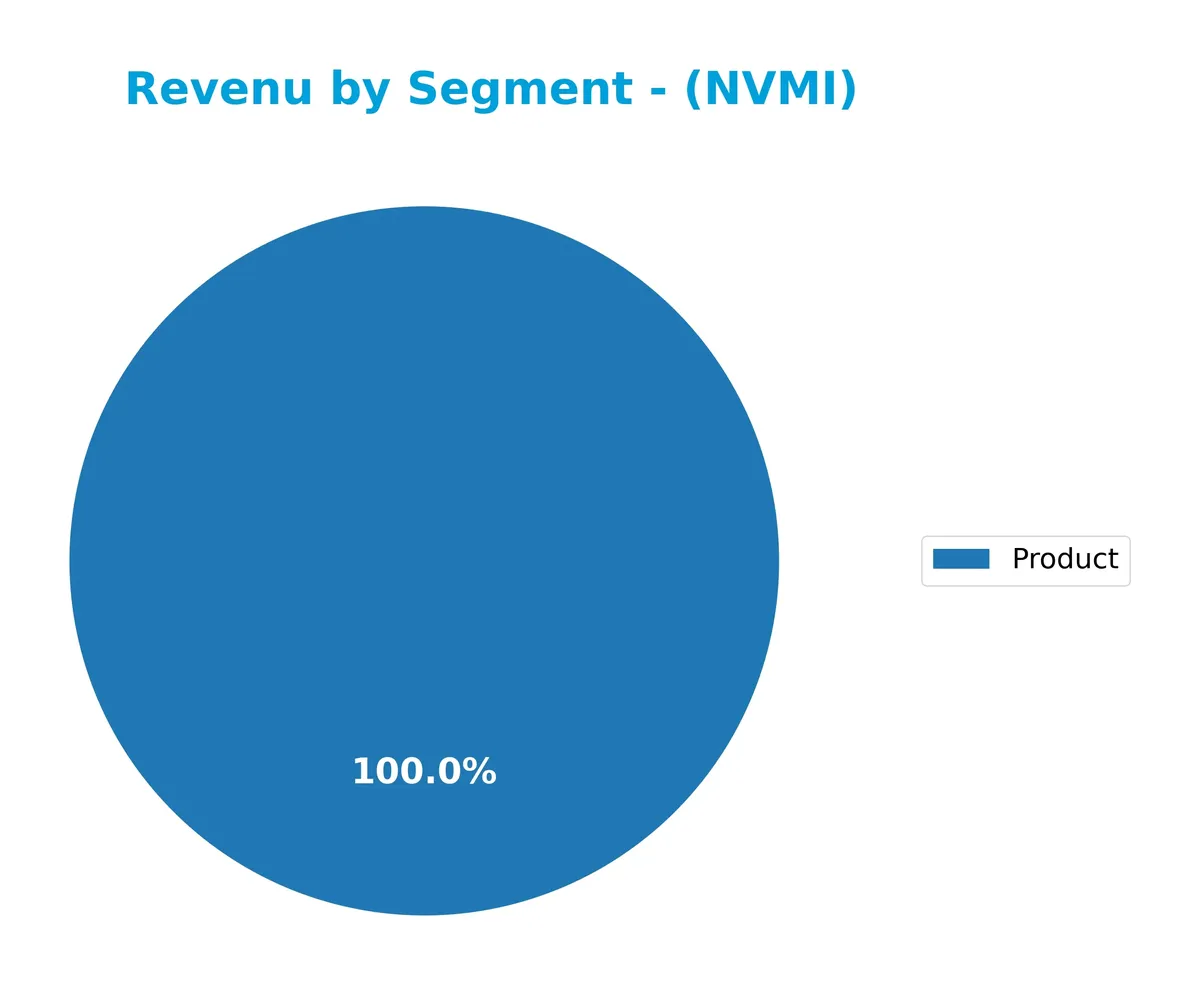
Nova Ltd.’s revenue stems solely from its product segment, which surged from $464M in 2022 to $706M in 2025. The steady increase, especially the sharp rise between 2024 and 2025, signals accelerating demand or successful market penetration. This concentrated revenue base underscores growth potential but also flags concentration risk if diversification remains limited.
Key Products & Brands
Nova Ltd.’s principal offerings focus on advanced semiconductor process control systems and metrology platforms:
| Product | Description |
|---|---|
| Process Control Systems | Systems designed for semiconductor manufacturing process control across lithography, etch, deposition, and more. |
| Metrology Platforms | Platforms for dimensional, film, material, and chemical metrology measurements supporting various process steps. |
Nova Ltd. specializes in precision metrology and process control solutions essential to semiconductor manufacturing. Its products serve leading sectors like logic, memory, and foundries worldwide.
Main Competitors
There are 38 competitors in the Semiconductor industry, with the table below showing the top 10 leaders by market capitalization:
| Competitor | Market Cap. |
|---|---|
| NVIDIA Corporation | 4.6T |
| Broadcom Inc. | 1.6T |
| Taiwan Semiconductor Manufacturing Company Limited | 1.6T |
| ASML Holding N.V. | 415B |
| Advanced Micro Devices, Inc. | 363B |
| Micron Technology, Inc. | 353B |
| Lam Research Corporation | 232B |
| Applied Materials, Inc. | 214B |
| QUALCOMM Incorporated | 185B |
| Intel Corporation | 173B |
Nova Ltd. ranks 27th among 38 competitors, holding just 0.29% of the market cap of the sector leader, NVIDIA. The company sits well below both the average market cap of the top 10 competitors (975B) and the sector median (31B). It stands approximately 25% behind its nearest rival above, indicating a significant gap in scale and market presence.
Comparisons with competitors
Check out how we compare the company to its competitors:
Does Nova have a competitive advantage?
Nova Ltd. currently lacks a competitive advantage, as its ROIC falls below WACC by 1.7%, indicating the company is shedding value. The declining ROIC trend over 2021-2025 confirms weakening profitability and value destruction.
Looking ahead, Nova serves diverse global semiconductor markets with advanced metrology platforms. The company’s exposure to multiple manufacturing steps and international customers presents potential growth opportunities through new products and process innovations.
SWOT Analysis
This SWOT analysis highlights Nova Ltd.’s core competitive position and growth prospects within the semiconductor industry.
Strengths
- strong revenue growth
- high net margin at 29.4%
- debt levels manageable at 0.61 DE
Weaknesses
- ROIC below WACC indicates value destruction
- high valuation multiples (PE 41.3, PB 8.1)
- declining ROIC trend raises profitability concerns
Opportunities
- expanding semiconductor market demand
- innovation in process control systems
- geographic diversification across key tech hubs
Threats
- intense competition in semiconductor metrology
- rapid technological change
- macroeconomic volatility affecting capex cycles
Nova’s robust profitability and growth contrast with its undervalued capital efficiency and stretched valuation. The company must focus on improving returns on invested capital while leveraging innovation to stay competitive.
Stock Price Action Analysis
The following weekly chart illustrates Nova Ltd.’s stock price movements over the last 12 months, highlighting key price fluctuations and trend developments:
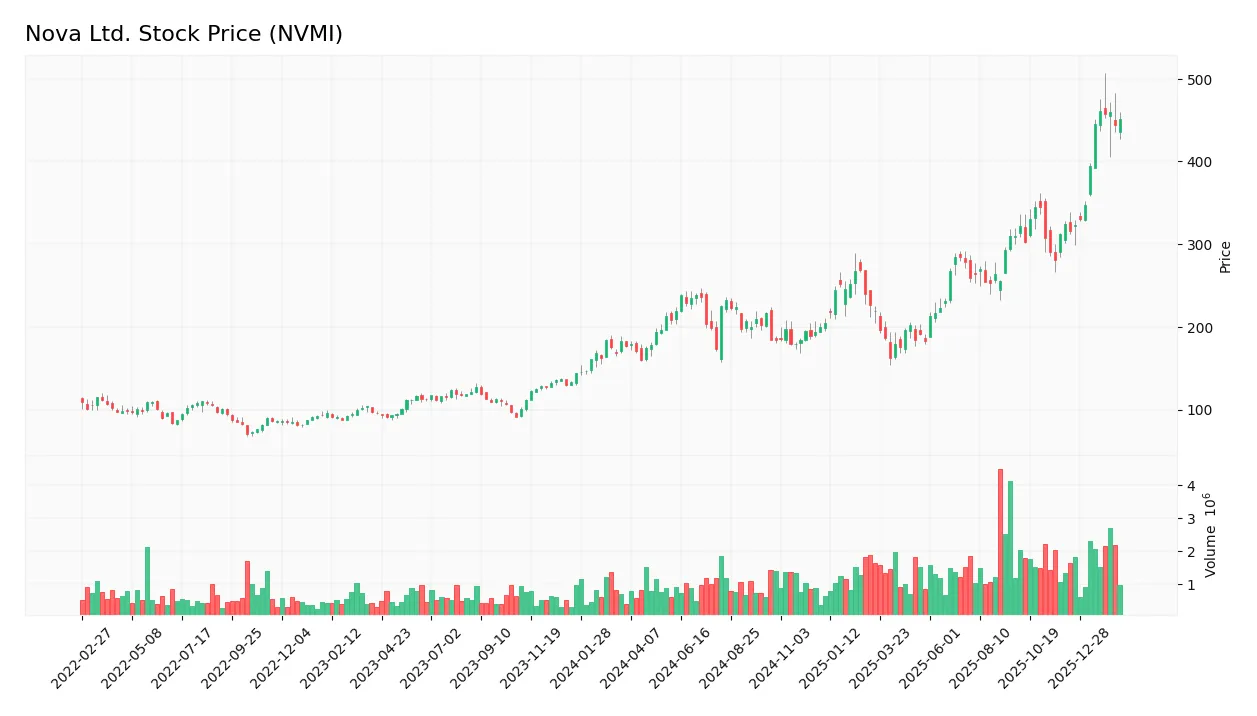
Trend Analysis
Over the past year, NVMI’s stock price increased by 154.74%, indicating a strong bullish trend with acceleration. The price ranged from a low of 160 to a high near 461. Volatility remains high with a 72.23 standard deviation, reflecting pronounced price swings.
Volume Analysis
Trading volume is increasing, with buyers accounting for 58.33% overall. In the recent three months, buyer dominance strengthened to 70.51%, signaling strong buyer-driven momentum and rising market participation. This suggests growing investor confidence in NVMI’s stock.
Target Prices
Analysts present a confident target consensus for Nova Ltd., reflecting strong growth expectations.
| Target Low | Target High | Consensus |
|---|---|---|
| 453 | 520 | 489.5 |
The target range suggests a robust upside potential, with the consensus firmly above current levels. This signals positive market sentiment among leading analysts.

Don’t Let Luck Decide Your Entry Point
Optimize your entry points with our advanced ProRealTime indicators. You’ll get efficient buy signals with precise price targets for maximum performance. Start outperforming now!
Analyst & Consumer Opinions
This section reviews analyst grades and consumer feedback to provide a balanced view of Nova Ltd.’s market perception.
Stock Grades
Here are the latest verified grades for Nova Ltd. from leading financial analysts:
| Grading Company | Action | New Grade | Date |
|---|---|---|---|
| Evercore ISI Group | Maintain | Outperform | 2026-02-13 |
| Citigroup | Maintain | Buy | 2026-02-13 |
| Needham | Upgrade | Buy | 2026-01-20 |
| B of A Securities | Maintain | Buy | 2026-01-13 |
| Jefferies | Maintain | Buy | 2025-12-15 |
| Evercore ISI Group | Maintain | Outperform | 2025-11-07 |
| Benchmark | Maintain | Buy | 2025-11-07 |
| Cantor Fitzgerald | Maintain | Overweight | 2025-06-24 |
| B of A Securities | Maintain | Buy | 2025-06-24 |
| Citigroup | Maintain | Buy | 2025-05-09 |
The consensus strongly favors a Buy rating, reflecting analyst confidence in Nova Ltd.’s prospects. Notably, Needham upgraded to Buy recently, indicating positive momentum among key evaluators.
Consumer Opinions
Consumer sentiment around Nova Ltd. reflects a mix of admiration for innovation and concerns over service consistency.
| Positive Reviews | Negative Reviews |
|---|---|
| “Nova’s cutting-edge technology truly enhances user experience.” | “Customer support response times are frustratingly slow.” |
| “The product reliability has noticeably improved this year.” | “Pricing feels steep compared to competitors.” |
| “Intuitive design and seamless integration stand out.” | “Occasional software glitches disrupt workflow.” |
Overall, consumers praise Nova Ltd. for its innovative products and improved reliability. However, recurring complaints about customer support and pricing suggest areas needing urgent management focus.
Risk Analysis
Below is a detailed table summarizing Nova Ltd.’s key risk factors, categorized by their probability and impact levels:
| Category | Description | Probability | Impact |
|---|---|---|---|
| Valuation Risk | High P/E (41.26) and P/B (8.11) ratios signal overvaluation risk amid market volatility. | Medium | High |
| Operational Risk | Low asset turnover (0.37) indicates inefficiencies in asset utilization affecting growth. | Medium | Medium |
| Financial Risk | ROIC (10.07%) below WACC (11.78%) suggests capital is not generating adequate returns. | High | High |
| Liquidity Risk | Elevated current ratio (6.28) signals potential excess idle assets, impacting efficiency. | Low | Medium |
| Debt Risk | Moderate debt-to-assets (33.85%) and debt-to-equity concerns (score 1) raise leverage risks. | Medium | Medium |
| Market Risk | Beta of 1.818 exposes the stock to above-average market swings and volatility. | High | High |
| Dividend Risk | Zero dividend yield limits income appeal to investors seeking cash flow. | Low | Low |
The most pressing risks are valuation and financial efficiency. Nova’s ROIC failing to cover its WACC warns that new investments may destroy shareholder value. Additionally, its high beta amplifies exposure to semiconductor sector cyclicality. I note that despite a safe Altman Z-Score (8.89), leverage and slow asset turnover warrant close monitoring. Investors must weigh these factors carefully against the company’s strong net margin and ROE performance.
Should You Buy Nova Ltd.?
Nova Ltd. appears to be a company with declining profitability and a very unfavorable moat, indicating value destruction. Despite a manageable leverage profile and a strong Altman Z-score suggesting financial safety, its overall rating of B- reflects moderate operational efficiency with notable valuation and debt concerns.
Strength & Efficiency Pillars
Nova Ltd. delivers robust profitability with a net margin of 29.44% and return on equity at 19.66%, both favorable in its sector. The company’s EBIT margin stands strong at 29.04%, supporting operational efficiency. However, its return on invested capital (ROIC) at 10.07% trails its weighted average cost of capital (WACC) at 11.78%, indicating Nova Ltd. is currently shedding value rather than creating it. Still, the Altman Z-Score of 8.89 places the firm in the safe zone, underscoring solid financial stability.
Weaknesses and Drawbacks
Despite operational strengths, Nova Ltd. faces valuation and leverage concerns. Its price-to-earnings ratio at 41.26 and price-to-book ratio at 8.11 signal a richly priced stock, which may limit upside potential. The company’s current ratio of 6.28 is unusually high and marked unfavorable, possibly reflecting inefficient capital use or excess liquidity. Although debt-to-equity remains moderate at 0.61, the overall ratio mix suggests caution. These metrics highlight risks that may weigh on the stock amid market volatility.
Our Final Verdict about Nova Ltd.
Nova Ltd. offers a fundamentally stable profile with strong profit margins and a safe solvency position, as reflected by its Altman Z-Score. However, the company’s inability to generate returns above its capital cost and premium valuation metrics suggest a cautious stance. Given its bullish long-term trend and strong buyer dominance recently, the stock might appear attractive for patient investors but could warrant a wait-and-see approach for a more favorable entry point.
Disclaimer: This content is for informational purposes only and does not constitute financial, investment, or other professional advice. Investing in financial markets involves a significant risk of loss, and past performance is not indicative of future results.
Additional Resources
- Nova Ltd. (NVMI) Upgraded to Buy: Here’s What You Should Know – Yahoo Finance (Feb 18, 2026)
- Semiconductor metrology firm Nova sends CFO to tech investor events – Stock Titan (Feb 18, 2026)
- Morgan Stanley Maintains Outperform on NVMI (Nova Ltd.) Feb 2026 – Meyka (Feb 16, 2026)
- Nova (NVMI) Revenue Growth And 29% Margins Reinforce Bullish Earnings Narratives – Sahm (Feb 17, 2026)
- Nova Ltd. (NASDAQ:NVMI) Q4 2025 Earnings Call Transcript – Insider Monkey (Feb 13, 2026)
For more information about Nova Ltd., please visit the official website: novami.com