Home > Analyses > Technology > monday.com Ltd.
monday.com Ltd. revolutionizes how teams organize and execute work across industries. Its flagship Work OS platform transforms complex workflows into intuitive, visual processes. Renowned for innovation, monday.com commands a strong presence in the cloud-based software sector, pushing boundaries in project management and collaboration tools. As market dynamics shift, I question whether monday.com’s core strengths and growth trajectory justify its current valuation and long-term investment appeal.

Table of contents
Business Model & Company Overview
monday.com Ltd., founded in 2012 and headquartered in Tel Aviv, Israel, commands a leading position in the Software – Application industry. Its flagship Work OS platform delivers a cloud-based, modular visual work operating system that streamlines project management, CRM, marketing, and software development. This ecosystem empowers organizations, educational bodies, and government units to build tailored work management tools with agility and scale.
The company’s revenue engine balances subscription-based software with value-added services across the Americas, Europe, and Asia. Its Work OS drives recurring revenue through modular solutions that adapt to diverse enterprise needs, reinforcing customer retention. monday.com’s competitive advantage lies in its flexible platform and strong global footprint, positioning it to shape the future of collaborative work management.
Financial Performance & Fundamental Metrics
I analyze monday.com Ltd.’s income statement, key financial ratios, and dividend payout policy to assess its core financial health and shareholder value creation.
Income Statement
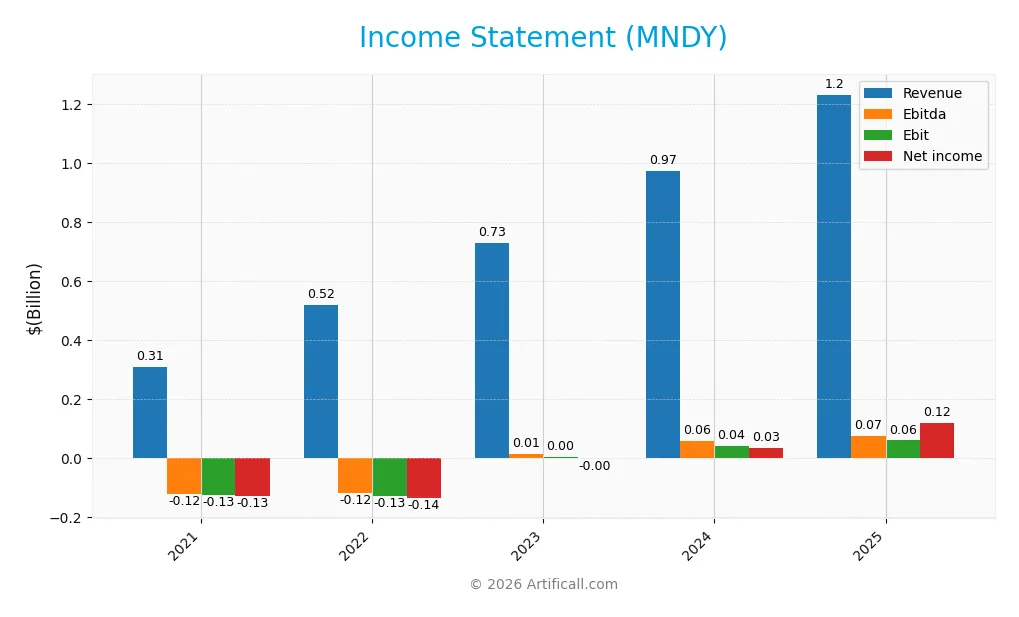
The table below summarizes monday.com Ltd.’s key income statement items for fiscal years 2021 through 2025 in USD.
| 2021 | 2022 | 2023 | 2024 | 2025 | |
|---|---|---|---|---|---|
| Revenue | 308.2M | 519.0M | 729.7M | 972.0M | 1.23B |
| Cost of Revenue | 39.0M | 66.5M | 80.6M | 103.7M | 133.1M |
| Operating Expenses | 395.3M | 604.5M | 687.6M | 889.3M | 1.10B |
| Gross Profit | 269.1M | 452.5M | 649.1M | 868.3M | 1.10B |
| EBITDA | -123.2M | -120.1M | 12.8M | 58.0M | 73.1M |
| EBIT | -126.0M | -128.7M | 3.8M | 39.8M | 59.3M |
| Interest Expense | 971K | 792K | 443K | 0 | 0 |
| Net Income | -129.3M | -136.9M | -1.9M | 32.4M | 118.7M |
| EPS | -3.09 | -2.99 | -0.04 | 0.65 | 2.31 |
| Filing Date | 2022-03-16 | 2023-03-14 | 2024-03-14 | 2025-03-17 | 2026-03-13 |
Income Statement Evolution
Monday.com Ltd. shows strong revenue growth, rising nearly 300% from 2021 to 2025. Net income turned positive after losses in early years, reflecting a 192% overall increase. Gross margins remain high and stable near 89%, while EBIT margins improve modestly but stay neutral. The company sustains expanding top-line performance alongside margin stability.
Is the Income Statement Favorable?
In 2025, Monday.com posted $1.23B revenue with a 9.6% net margin and $119M net income, signaling profitable scale. Operating income was slightly negative due to high operating expenses, but net interest income offset this. The zero interest expense and strong EPS growth above 260% highlight solid fundamentals. Overall, the income statement metrics indicate a generally favorable financial position.
Financial Ratios
The following table summarizes key financial ratios for monday.com Ltd. over the past five fiscal years, providing a clear view of its performance and financial health:
| Ratios | 2021 | 2022 | 2023 | 2024 | 2025 |
|---|---|---|---|---|---|
| Net Margin | -42% | -26% | 0% | 3% | 10% |
| ROE | -18% | -20% | 0% | 3% | 10% |
| ROIC | -18% | -20% | 2% | -2% | 0% |
| P/E | -106 | -41 | -4839 | 363 | 64 |
| P/B | 19.53 | 8.22 | 11.17 | 11.41 | 6.09 |
| Current Ratio | 4.00 | 3.10 | 2.82 | 2.66 | 2.50 |
| Quick Ratio | 4.00 | 3.10 | 2.82 | 2.66 | 2.50 |
| D/E | 0.00 | 0.07 | 0.08 | 0.10 | 0.25 |
| Debt-to-Assets | 0.00 | 0.07 | 0.05 | 0.06 | 0.15 |
| Interest Coverage | -130 | -192 | -87 | 0 | 0 |
| Asset Turnover | 0.33 | 0.50 | 0.57 | 0.58 | 0.58 |
| Fixed Asset Turnover | 15.72 | 4.53 | 7.32 | 7.13 | 6.07 |
| Dividend Yield | 0% | 0% | 0% | 0% | 0% |
Note: Negative or zero values in P/E and interest coverage ratios indicate losses or limited interest expenses. The Debt-to-Equity and Debt-to-Assets ratios increased notably in 2025. The consistently high current and quick ratios reflect strong short-term liquidity.
Evolution of Financial Ratios
From 2021 to 2025, monday.com Ltd. saw ROE improve from deeply negative to 9.52% but remain below the sector average, indicating recovery yet limited profitability. The Current Ratio steadily declined from 4.0 to 2.5, maintaining strong liquidity. Debt-to-Equity rose modestly to 0.25, reflecting cautious leverage growth. Profit margins shifted from heavy losses to a 9.64% net margin in 2025, signaling stabilizing operations.
Are the Financial Ratios Favorable?
In 2025, profitability ratios show mixed signals: net margin is neutral at 9.64%, while ROE and ROIC are unfavorable versus their respective costs. Liquidity ratios, including Current and Quick Ratios near 2.5, are favorable, supporting short-term solvency. Leverage metrics such as Debt-to-Equity and Debt-to-Assets remain low and favorable. Efficiency and market valuation ratios mostly register neutral to unfavorable, resulting in a slightly favorable overall ratio profile.
Shareholder Return Policy
monday.com Ltd. does not pay dividends, reflecting a reinvestment strategy consistent with its high-growth phase. The company focuses on expanding operations and product development, prioritizing long-term value creation over immediate shareholder payouts. Share buybacks are not reported, indicating retention of capital for growth investments.
This approach aligns with sustaining growth and innovation rather than distributing cash. Given monday.com’s improving profitability and strong free cash flow coverage, its capital allocation appears geared toward enhancing shareholder value over time. However, investors should monitor this strategy for evolving returns as the company matures.
Score analysis
The following radar chart summarizes monday.com Ltd.’s key financial scores and valuation metrics:
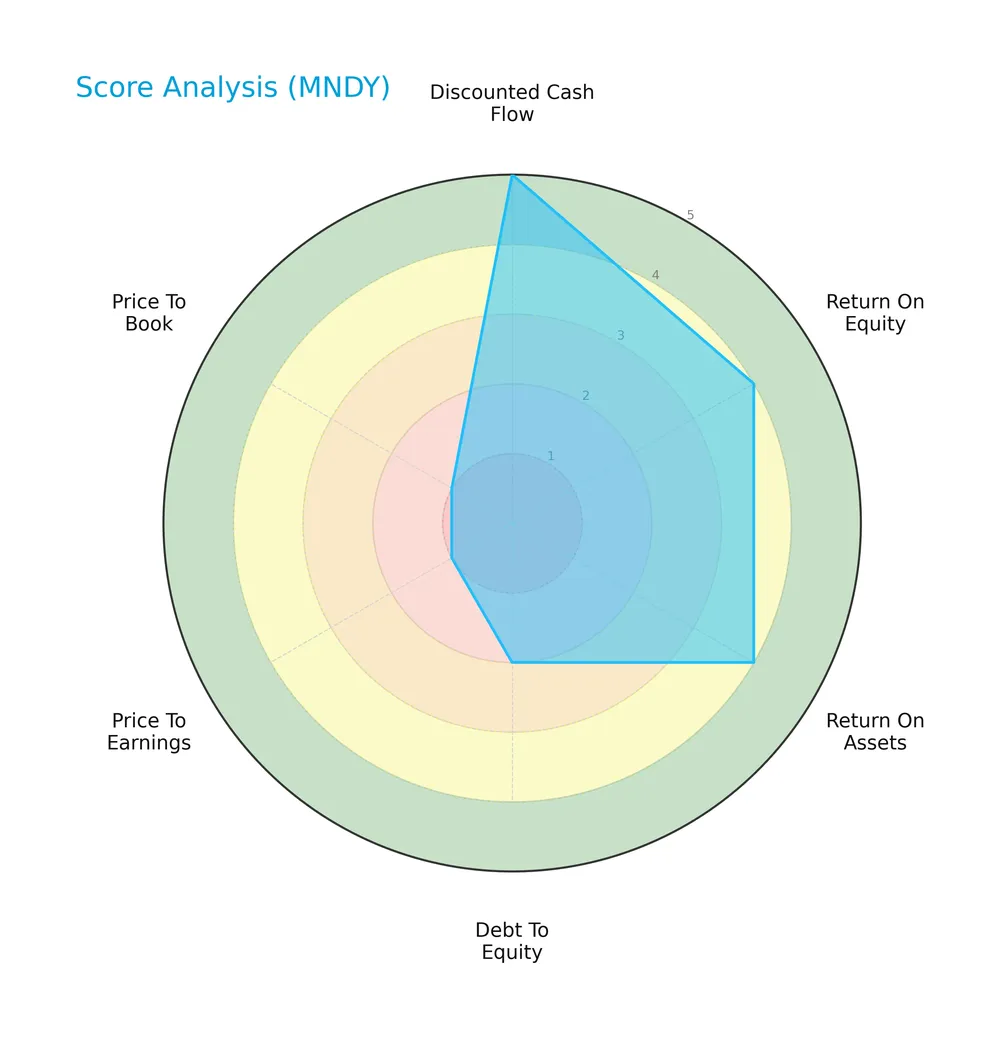
The company scores very favorably in discounted cash flow (5) and shows favorable returns on equity (4) and assets (4). However, debt-to-equity (2) and valuation multiples like price-to-earnings (1) and price-to-book (1) appear weak, indicating valuation challenges.
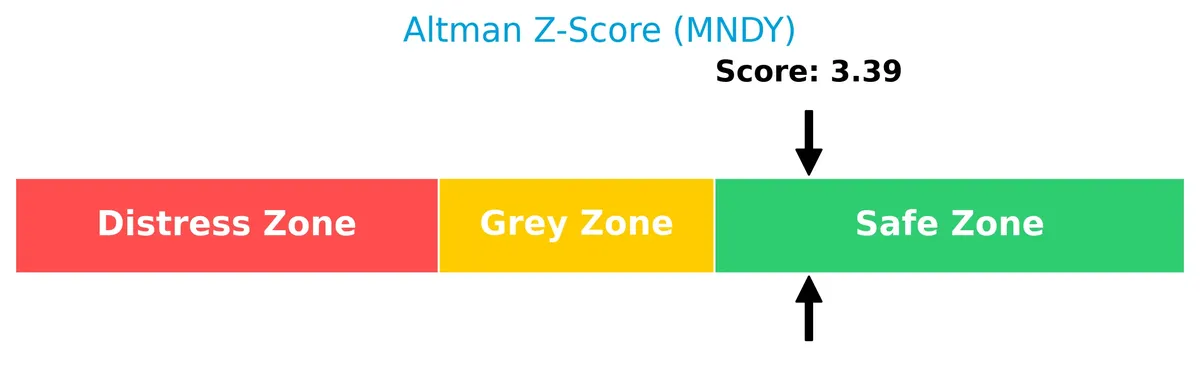
Analysis of the company’s bankruptcy risk
monday.com Ltd. sits comfortably in the safe zone with an Altman Z-Score above 3, reflecting low bankruptcy risk and solid financial stability:
Is the company in good financial health?
The Piotroski diagram illustrates monday.com Ltd.’s financial health based on nine key accounting criteria:

With a Piotroski Score of 6, the company demonstrates average financial strength, suggesting moderate operational efficiency and profitability without clear signs of distress or exceptional robustness.
Competitive Landscape & Sector Positioning
This analysis explores monday.com Ltd.’s strategic positioning, revenue streams, key products, and main competitors. I will assess whether monday.com maintains a competitive advantage within the software application sector.
Strategic Positioning
monday.com Ltd. focuses on a diversified product portfolio with its Work OS platform and modular applications across marketing, CRM, project management, and software development. It operates internationally, spanning the US, Europe, the Middle East, and Africa, targeting organizations and institutions globally.
Key Products & Brands
The following table outlines monday.com Ltd.’s main products and brand offerings:
| Product | Description |
|---|---|
| Work OS | A cloud-based visual work operating system with modular building blocks to create software applications. |
| Marketing Solutions | Product tools designed to support marketing teams in campaign management and execution. |
| CRM Solutions | Customer relationship management tools tailored for sales and client engagement workflows. |
| Project Management Tools | Software applications that help teams plan, track, and deliver projects efficiently. |
| Software Development Tools | Solutions aimed at aiding software development teams in collaboration and workflow management. |
| Business Development Services | Services focused on presale, customer success, and business growth support for various organizations. |
monday.com Ltd. offers a versatile Work OS platform with a broad suite of modular tools catering to marketing, CRM, project management, and software development. Its business services complement these products, targeting diverse organizational needs.
Main Competitors
The Technology Software – Application sector includes 33 competitors, with the top 10 leaders by market capitalization listed below:
| Competitor | Market Cap. |
|---|---|
| Salesforce, Inc. | 242B |
| Shopify Inc. | 210B |
| AppLovin Corporation | 209B |
| Intuit Inc. | 175B |
| Uber Technologies, Inc. | 172B |
| ServiceNow, Inc. | 153B |
| Cadence Design Systems, Inc. | 84B |
| Snowflake Inc. | 73B |
| Autodesk, Inc. | 61B |
| Workday, Inc. | 55B |
Monday.com Ltd. ranks 27th among 33 competitors, with a market cap just 1.41% the size of the sector leader, Salesforce. It sits well below both the average market cap of the top 10 (143B) and the sector median (19B). The company is separated from its nearest competitor above by a wide 132% gap, underscoring a significant difference in scale.
Does monday.com Ltd. have a competitive advantage?
monday.com Ltd. shows a slightly unfavorable competitive advantage, as it currently destroys value with ROIC below WACC despite growing profitability. Its high gross margin (89.2%) supports operational strength but signals caution in capital efficiency.
Looking ahead, monday.com leverages its Work OS platform with modular applications across marketing, CRM, and project management. Expansion into diverse industries and international markets offers significant growth opportunities amid rising revenue and net income trends.
Comparisons with competitors
Check out how we compare the company to its competitors:
SWOT Analysis
This SWOT analysis highlights monday.com Ltd.’s core competitive position and strategic challenges.
Strengths
- strong revenue growth at 27% annually
- high gross margin of 89%
- robust liquidity with current ratio 2.5
Weaknesses
- ROIC below WACC indicating value destruction
- high valuation multiples (PE 64, PB 6)
- moderate profitability (EBIT margin 4.8%)
Opportunities
- expanding cloud-based work OS market
- rising demand for integrated business software
- potential to improve capital efficiency
Threats
- intense competition in SaaS sector
- market sensitivity to tech valuations
- risk of margin pressure from increased operating expenses
monday.com shows strong growth and liquidity but struggles with capital efficiency and high valuation. Its strategy should focus on improving ROIC and controlling costs to sustain long-term value.
Stock Price Action Analysis
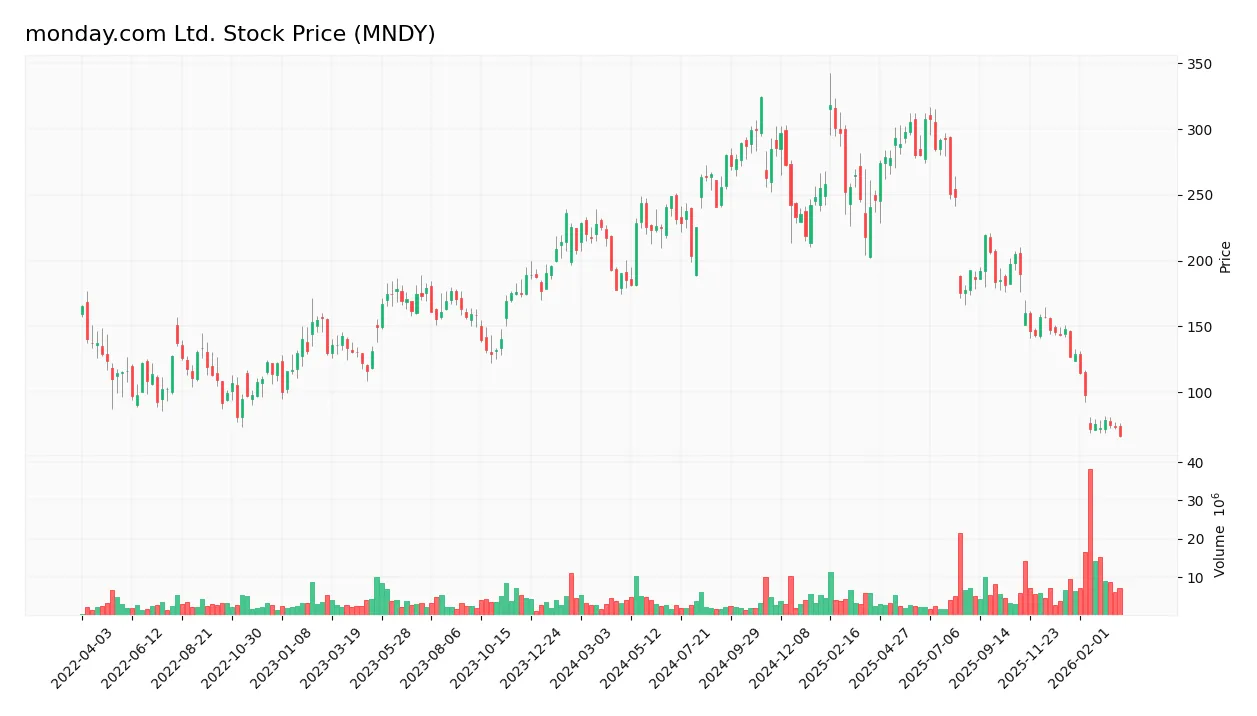
The following weekly stock chart illustrates monday.com Ltd.’s price movements over the last 12 months, highlighting key highs and lows:
Trend Analysis
Over the past year, MNDY’s stock price declined sharply by 64.16%, confirming a bearish trend. The downtrend shows deceleration despite high volatility (std. dev. 65.49). The price ranged from a high of 324.31 to a low of 66.47. Recent months confirm continued weakness with a 55.1% drop and less volatile moves.
Volume Analysis
Trading volume has increased overall, with sellers dominating 58.32% of activity year-to-date. In the recent quarter, seller volume surged, comprising 75.05% of trades. This seller dominance and rising volume suggest persistent negative sentiment and cautious market participation among investors.
Target Prices
Analysts set a clear target consensus for monday.com Ltd., reflecting mixed but optimistic expectations.
| Target Low | Target High | Consensus |
|---|---|---|
| 80 | 310 | 142.69 |
The target range spans from 80 to 310, indicating varied sentiment. The consensus at 142.69 suggests moderate confidence in upside potential.
Analyst & Consumer Opinions
This section examines analyst ratings and consumer feedback to provide a balanced view of monday.com Ltd.’s market perception.

Don’t Let Luck Decide Your Entry Point
Optimize your entry points with our advanced ProRealTime indicators. You’ll get efficient buy signals with precise price targets for maximum performance. Start outperforming now!
Stock Grades
Here are the latest verified stock grades from leading financial analysts for monday.com Ltd.:
| Grading Company | Action | New Grade | Date |
|---|---|---|---|
| Jefferies | Downgrade | Hold | 2026-02-23 |
| BTIG | Maintain | Buy | 2026-02-10 |
| Citigroup | Maintain | Buy | 2026-02-10 |
| Cantor Fitzgerald | Maintain | Overweight | 2026-02-10 |
| B of A Securities | Maintain | Neutral | 2026-02-10 |
| Oppenheimer | Maintain | Outperform | 2026-02-10 |
| Canaccord Genuity | Maintain | Buy | 2026-02-10 |
| Baird | Downgrade | Neutral | 2026-02-10 |
| Keybanc | Maintain | Overweight | 2026-02-10 |
| DA Davidson | Maintain | Buy | 2026-02-10 |
The consensus remains positive with a “Buy” rating supported by 20 analysts and 5 holds. However, recent downgrades from Jefferies and Baird indicate some caution among key firms.
Consumer Opinions
Consumer sentiment around monday.com Ltd. reflects strong enthusiasm for its intuitive platform and customer support, alongside concerns about pricing and occasional feature limitations.
| Positive Reviews | Negative Reviews |
|---|---|
| “The interface is user-friendly and highly flexible.” | “Pricing tiers feel expensive for small teams.” |
| “Customer support responds quickly and effectively.” | “Some advanced features lack depth compared to competitors.” |
| “Helps improve team collaboration and project tracking.” | “Mobile app sometimes lags during heavy use.” |
Overall, consumers praise monday.com for its ease of use and responsive support. However, pricing and occasional feature gaps remain consistent pain points.
Risk Analysis
Below is a summary table outlining key risks facing monday.com Ltd., highlighting their likelihood and potential impact:
| Category | Description | Probability | Impact |
|---|---|---|---|
| Valuation Risk | Elevated PE (64) and PB (6.1) ratios suggest expensive shares. | High | High |
| Profitability Risk | Negative ROIC (-0.12%) below WACC (9.65%) signals weak capital returns. | Medium | High |
| Market Volatility | Beta of 1.3 indicates higher sensitivity to market swings. | High | Medium |
| Debt Management | Low debt-to-equity (0.25) and strong interest coverage reduce risk. | Low | Low |
| Liquidity Risk | Favorable current and quick ratios (2.5) support short-term stability. | Low | Low |
| Growth Execution | Moderate Piotroski score (6) reflects average financial strength. | Medium | Medium |
The biggest red flags remain the stretched valuation multiples and the company’s inability to generate returns above its cost of capital. Despite a safe Altman Z-Score (3.39) indicating low bankruptcy risk, investors should monitor profitability trends closely. Market volatility amplified by the stock’s beta also adds to price risk.
Should You Buy monday.com Ltd.?
monday.com Ltd. appears to be in a phase of improving profitability with a slightly unfavorable moat as it currently sheds value despite growing ROIC. Supported by a manageable debt profile, the company suggests a moderate financial health rating of B.
Strength & Efficiency Pillars
monday.com Ltd. operates with solid operational margins, boasting a gross margin of 89.2% and a net margin of 9.64%. The company’s EBIT margin of 4.81% reflects moderate profitability. Despite an unfavorable ROIC of -0.12% trailing its WACC of 9.65%, monday.com demonstrates strong revenue and earnings growth, with net margin growth over five years exceeding 120%. Its financial structure benefits from a healthy current ratio of 2.5 and low debt-to-equity at 0.25, supporting operational efficiency and liquidity.
Weaknesses and Drawbacks
The Altman Z-Score of 3.39 places monday.com comfortably in the safe zone, alleviating solvency concerns. However, valuation metrics present significant risks: a P/E ratio of 63.93 and P/B of 6.09 indicate a high premium, potentially exposing investors to valuation compression. The return on equity at 9.52% is unfavorable, signaling lower shareholder returns relative to peers. Market dynamics show seller dominance at 75.05% in the recent period, creating short-term price pressure amid a bearish overall trend.
Our Final Verdict about monday.com Ltd.
monday.com Ltd. exhibits a mixed fundamental profile. Its strong operational margins and liquidity contrast with unfavorable ROIC and stretched valuation multiples. Despite overall financial safety, recent market pressure and weak returns suggest caution. The profile might appear attractive for patient investors focused on growth but suggests a wait-and-see approach for better entry points given current bearish momentum and seller dominance.
Disclaimer: This content is for informational purposes only and does not constitute financial, investment, or other professional advice. Investing in financial markets involves a significant risk of loss, and past performance is not indicative of future results.
Additional Resources
- monday.com Ltd. (MNDY) Securities Fraud Class Action Lawsuit Filed; May 11, 2026, Lead Plaintiff Deadline – PR Newswire (Mar 27, 2026)
- MNDY Investors Have Opportunity to Lead monday.com Ltd. Securities Fraud Lawsuit – mykxlg.com (Mar 28, 2026)
- monday.com Ltd. (NASDAQ:MNDY) Given Average Rating of “Moderate Buy” by Brokerages – MarketBeat (Mar 27, 2026)
- MONDAY.COM LTD. (MNDY) SHAREHOLDER ALERT Bernstein Liebhard – GlobeNewswire (Mar 26, 2026)
- Is monday.com Ltd. (MNDY) A Good Stock To Buy Now? – Yahoo Finance (Mar 05, 2026)
For more information about monday.com Ltd., please visit the official website: monday.com