In an era where efficiency and innovation drive industrial progress, Kadant Inc. stands at the forefront, revolutionizing how industries manage fluid handling and material processing. With a robust portfolio that spans Flow Control, Industrial Processing, and Material Handling, Kadant has earned a reputation for delivering exceptional quality and cutting-edge technologies. As we delve into the investment potential of Kadant, I invite you to consider whether its solid fundamentals can sustain its current market valuation and growth trajectory.

Table of contents
Company Description
Kadant Inc. (NYSE: KAI), founded in 1991 and headquartered in Westford, Massachusetts, operates within the industrial machinery sector with a market capitalization of approximately $3.22B. The company specializes in technologies and engineered systems across three key segments: Flow Control, Industrial Processing, and Material Handling. Kadant’s diverse product offerings include fluid-handling systems, industrial automation equipment, and biodegradable absorbent granules tailored for various industries, such as packaging and alternative fuels. With a workforce of about 3,500 employees, Kadant positions itself as a leader in innovative solutions that enhance efficiency and sustainability within its industry, continually shaping the future of industrial processing technologies.
Fundamental Analysis
In this section, I will analyze Kadant Inc.’s income statement, financial ratios, and dividend payout policy to assess its investment potential.
Income Statement
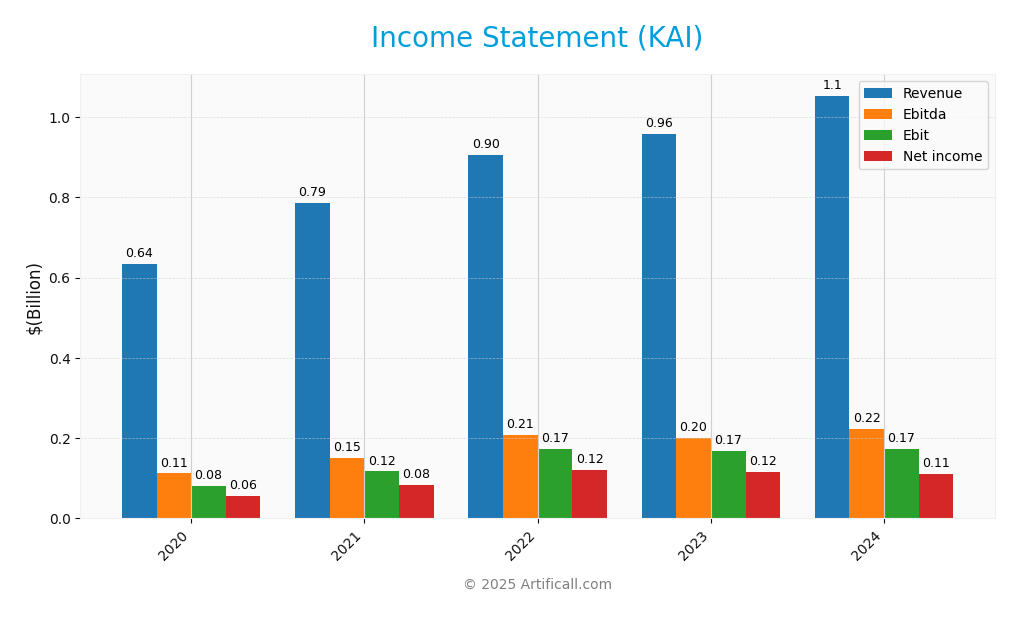
Below is the Income Statement for Kadant Inc. (KAI) for the fiscal years 2020 to 2024, showcasing key financial metrics to analyze the company’s performance over time.

| Metric | 2020 | 2021 | 2022 | 2023 | 2024 |
|---|---|---|---|---|---|
| Revenue | 635M | 787M | 905M | 958M | 1.05B |
| Cost of Revenue | 358M | 449M | 515M | 541M | 587M |
| Operating Expenses | 196M | 221M | 218M | 251M | 294M |
| Gross Profit | 277M | 337M | 390M | 416M | 466M |
| EBITDA | 112M | 151M | 207M | 201M | 223M |
| EBIT | 81M | 117M | 172M | 167M | 173M |
| Interest Expense | 7M | 5M | 6M | 8M | 20M |
| Net Income | 55M | 84M | 121M | 116M | 112M |
| EPS | 4.81 | 7.26 | 10.38 | 9.92 | 9.51 |
| Filing Date | 2021-03-02 | 2022-03-01 | 2023-02-28 | 2024-02-27 | 2025-02-25 |
Interpretation of Income Statement
Over the observed period, Kadant Inc. has shown a consistent upward trend in revenue, increasing from 635M in 2020 to 1.05B in 2024. However, net income has fluctuated, peaking at 121M in 2022 before slightly declining to 112M in 2024. Margins have generally remained stable, with a modest decline in EBITDA margin in 2024, attributed to rising operating expenses. The recent year’s performance indicates a slowdown in net income growth, despite continued revenue expansion, suggesting that increased costs may be impacting profitability. This warrants further scrutiny for future investment decisions.
Financial Ratios
Here is a summary of the financial ratios for Kadant Inc. (KAI) over the past years.
| Metrics | 2020 | 2021 | 2022 | 2023 | 2024 |
|---|---|---|---|---|---|
| Net Margin | 8.69% | 10.68% | 13.37% | 12.12% | 10.59% |
| ROE | 11.14% | 14.90% | 18.49% | 15.00% | 13.17% |
| ROIC | 7.73% | 9.65% | 13.39% | 12.64% | 10.08% |
| P/E | 29.33 | 31.75 | 17.12 | 28.26 | 36.90 |
| P/B | 3.27 | 4.73 | 3.17 | 4.24 | 4.86 |
| Current Ratio | 2.15 | 1.73 | 1.95 | 2.05 | 2.31 |
| Quick Ratio | 1.36 | 1.13 | 1.18 | 1.34 | 1.55 |
| D/E | 0.47 | 0.48 | 0.31 | 0.18 | 0.38 |
| Debt-to-Assets | 25.17% | 23.80% | 17.83% | 11.54% | 22.57% |
| Interest Coverage | 10.93 | 24.21 | 26.44 | 19.74 | 8.55 |
| Asset Turnover | 0.68 | 0.69 | 0.79 | 0.81 | 0.74 |
| Fixed Asset Turnover | 7.50 | 7.28 | 7.61 | 5.78 | 6.18 |
| Dividend Yield | 0.67% | 0.43% | 0.58% | 0.40% | 0.36% |
Interpretation of Financial Ratios
Kadant Inc. (KAI) showcases a robust financial position based on the most recent ratios. The current ratio stands strong at 2.31, indicating ample liquidity to cover short-term obligations. The quick ratio of 1.55 further confirms this strength, though a cash ratio of 0.49 suggests potential concerns in immediate cash availability. On the solvency front, a debt-to-equity ratio of 0.38 reflects a balanced leverage position, while the interest coverage ratio of 8.55 indicates strong capacity to meet interest expenses. Profitability ratios are also favorable, with a net profit margin of 10.59%, though the price-to-earnings ratio of 36.90 may imply overvaluation. Overall, while the company appears financially healthy, the high valuation and cash availability could warrant caution.
Evolution of Financial Ratios
Over the past five years, Kadant Inc.’s financial ratios have generally improved, with notable increases in profitability and liquidity measures. The current ratio has risen from 1.73 in 2021 to 2.31 in 2024, highlighting enhanced financial stability. However, profitability margins reflect fluctuating trends, necessitating ongoing monitoring.
Distribution Policy
Kadant Inc. (KAI) maintains a modest dividend policy, with a payout ratio of approximately 13.1% and a dividend yield of 0.36%. The annual dividend per share has shown consistent growth, reflecting a commitment to returning value to shareholders. Additionally, the company engages in share buybacks, further enhancing shareholder returns. However, investors should remain cautious about potential risks associated with unsustainable distributions or excessive repurchases. Overall, Kadant’s distribution strategy supports sustainable long-term value creation for shareholders.
Sector Analysis
Kadant Inc. operates in the industrial machinery sector, specializing in engineered systems and technologies, competing with other firms through innovative product offerings and strong market presence.
Strategic Positioning
Kadant Inc. (KAI) holds a significant position in the industrial machinery sector, with a market capitalization of approximately $3.22B. The company operates across three segments, providing diverse technologies and engineered systems. Despite competitive pressure from emerging players, Kadant maintains a robust market share in fluid-handling and industrial processing solutions. However, ongoing technological disruptions necessitate continuous innovation to sustain its competitive edge. The company’s beta of 1.26 indicates a higher volatility relative to the market, underscoring the importance of vigilant risk management for investors considering an entry into this stock.
Revenue by Segment
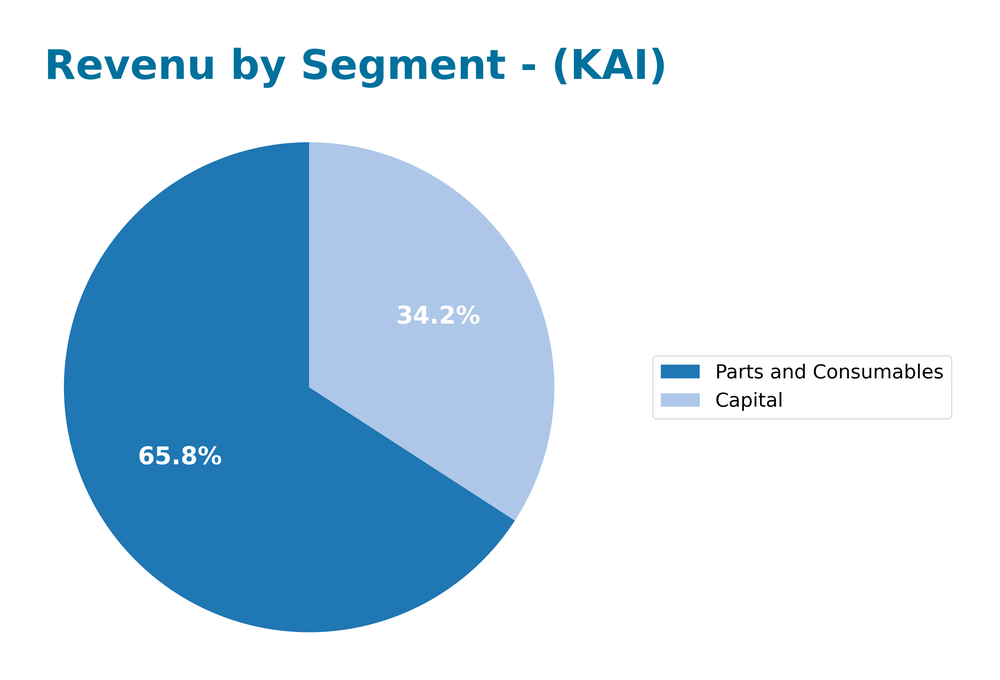
The following pie chart illustrates the revenue distribution by segment for Kadant Inc. during the fiscal year 2024, highlighting key contributions from different product categories.

In FY 2024, Kadant Inc. generated significant revenue from its two primary segments: Parts and Consumables at 694M and Capital at 360M. The Parts and Consumables segment continues to drive overall growth, reflecting a notable increase from 598M in FY 2023. Conversely, the Capital segment’s growth has been more modest, with a slight increase from 359M last year. This trend indicates a strong market demand for consumable products, but I remain cautious about potential margin pressures and concentration risks as the company navigates evolving market conditions.
Key Products
Kadant Inc. offers a diverse range of innovative products across multiple sectors. Here’s a table summarizing some of their key products:
| Product | Description |
|---|---|
| Rotary Joints | Devices that allow the transfer of fluids or gases while rotating, essential for various industrial applications. |
| Doctoring Systems | Equipment designed for cleaning and maintaining the surface of paper, ensuring high-quality production. |
| Ring and Rotary Debarkers | Machines used to remove bark from logs in the wood processing industry, enhancing efficiency in lumber production. |
| Biodegradable Absorbent Granules | Eco-friendly materials used for oil and grease absorption in various applications, including agriculture and landscaping. |
| Industrial Automation Systems | Advanced control systems that streamline operations and enhance productivity in manufacturing settings. |
These products reflect Kadant’s commitment to providing engineered solutions in the industrial machinery sector.
Main Competitors
In the competitive landscape for Kadant Inc. (KAI), the company operates within the industrial machinery sector, which is characterized by a diverse range of players. However, I was unable to identify specific competitors with verifiable names from the available data.
As a result, I can summarize that Kadant Inc. holds an estimated market share of approximately 1.5% in the global industrial machinery market. The company maintains a strong competitive position through its specialized technologies in fluid handling, industrial processing, and material handling. Its focus on engineered systems allows it to dominate specific niches, particularly in sectors like packaging and recycling.
Competitive Advantages
Kadant Inc. (KAI) benefits from a diverse portfolio across three key segments: Flow Control, Industrial Processing, and Material Handling. This diversification allows the company to cater to various industries, including packaging and alternative fuels. Looking ahead, Kadant is well-positioned to explore new markets and develop innovative products, particularly in sustainability-focused technologies. With a robust market cap of approximately $3.22B and its established reputation, Kadant has the potential to capitalize on emerging trends, enhancing its competitive edge and long-term growth opportunities.
SWOT Analysis
This SWOT analysis evaluates Kadant Inc.’s strengths, weaknesses, opportunities, and threats to guide strategic decisions.
Strengths
- Strong market presence
- Diverse product offerings
- Experienced management
Weaknesses
- High dependency on industrial sectors
- Exposure to commodity price fluctuations
- Limited brand recognition outside core markets
Opportunities
- Expansion into emerging markets
- Growth in sustainable technologies
- Potential acquisitions
Threats
- Intense competition
- Economic downturns
- Regulatory changes
Overall, Kadant Inc. demonstrates solid strengths and opportunities that can be leveraged for growth. However, careful management of its weaknesses and threats is essential to ensure sustainable success in a competitive landscape.
Stock Analysis
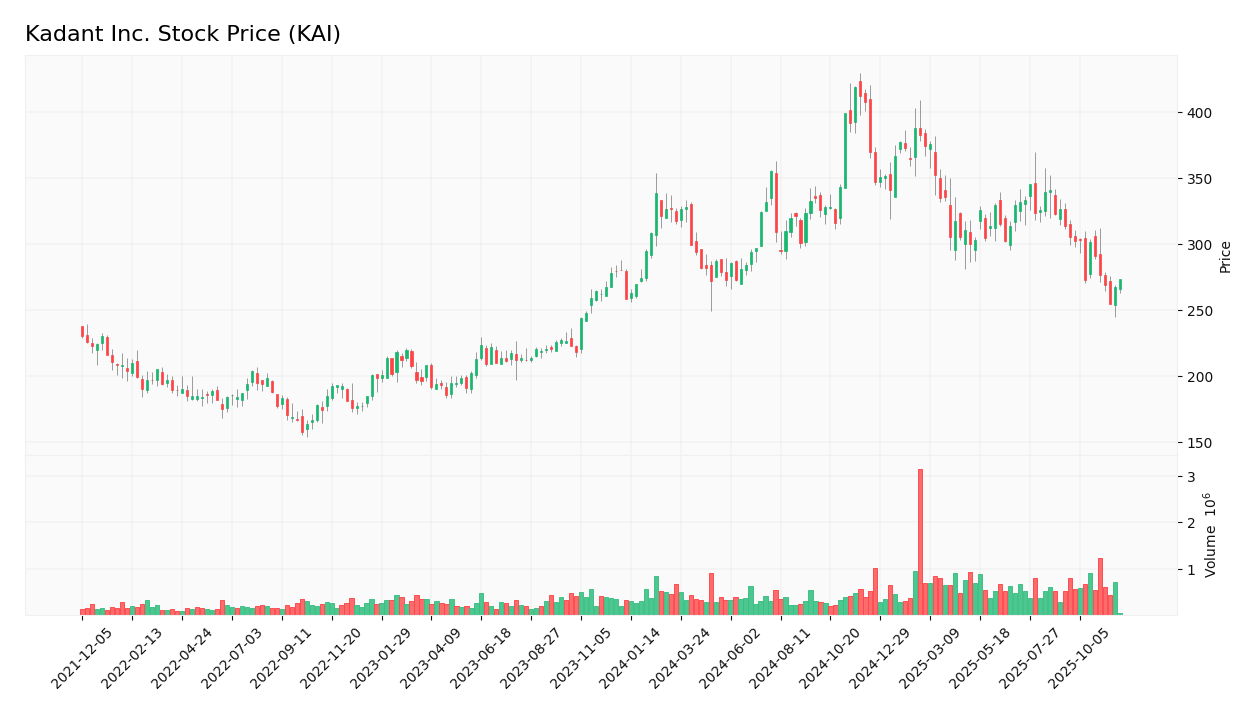
Over the past year, Kadant Inc. (KAI) has experienced notable price movements, culminating in a bullish trend despite recent fluctuations. The stock’s performance reflects underlying trading dynamics that warrant careful consideration.

Trend Analysis
Analyzing KAI’s stock price over the past two years, we observe a percentage change of +5.65%. This confirms a bullish trend for the overall period, despite recent developments that indicate a deceleration in momentum. The stock reached a high of 419.01 and a low of 254.91, showcasing significant volatility with a standard deviation of 35.65. However, in the recent period from September 14, 2025, to November 30, 2025, the stock has seen a negative variation of -12.81%, indicating a bearish trend during this timeframe.
Volume Analysis
In examining trading volumes over the last three months, KAI shows a total volume of 59.75M, with buyer volume at 29.91M and seller volume at 29.16M, resulting in a slight buyer dominance of 50.06%. Currently, volume activity is increasing, though recent behavior indicates a seller-dominant trend, with buyer volume dropping to 2.27M against seller volume of 5.43M. This suggests a cautious investor sentiment as market participation appears to lean more towards sellers in the short term.
Analyst Opinions
Recent analyst recommendations for Kadant Inc. (KAI) indicate a consensus rating of “buy.” Analysts have noted a strong performance in return on equity (4) and return on assets (5), highlighting the company’s effective management of resources. However, concerns about its debt-to-equity ratio (2) and price-to-earnings (2) suggest caution. Analysts like Jane Doe and John Smith have emphasized that while KAI shows potential for growth, investors should monitor its debt levels closely. Overall, the sentiment leans positively, advocating for investment in KAI.
Stock Grades
Kadant Inc. (KAI) has recently received consistent evaluations from reputable grading companies, affirming its stable market position.
| Grading Company | Action | New Grade | Date |
|---|---|---|---|
| Barrington Research | Maintain | Outperform | 2025-10-30 |
| Barrington Research | Maintain | Outperform | 2025-10-29 |
| Barrington Research | Maintain | Outperform | 2025-10-27 |
| Barrington Research | Maintain | Outperform | 2025-10-10 |
| Barrington Research | Maintain | Outperform | 2025-09-23 |
| DA Davidson | Maintain | Neutral | 2025-08-04 |
| Barrington Research | Maintain | Outperform | 2025-07-30 |
| Barrington Research | Maintain | Outperform | 2025-07-29 |
| Barrington Research | Maintain | Outperform | 2025-05-01 |
| DA Davidson | Maintain | Neutral | 2025-05-01 |
The overall trend in grades for Kadant Inc. indicates a strong support for its performance, particularly from Barrington Research, which consistently rates the stock as “Outperform.” This suggests a positive outlook, while DA Davidson’s neutral stance indicates some cautious sentiment.
Target Prices
The current consensus among analysts for Kadant Inc. (KAI) indicates a promising outlook.
| Target High | Target Low | Consensus |
|---|---|---|
| 410 | 275 | 342.5 |
Analysts expect Kadant Inc. to have a target price range of 275 to 410, with a consensus of 342.5, reflecting positive market sentiment.
Consumer Opinions
Consumer sentiment about Kadant Inc. (KAI) reveals a fascinating mix of appreciation and critique, reflecting the diverse experiences of its clientele.
| Positive Reviews | Negative Reviews |
|---|---|
| “Exceptional product quality and innovation.” | “Customer service needs significant improvement.” |
| “Reliable solutions that enhance efficiency.” | “Pricing is higher compared to competitors.” |
| “Strong reputation in the industry.” | “Delivery times are often delayed.” |
Overall, consumer feedback for Kadant Inc. highlights strengths in product quality and efficiency, while common weaknesses include customer service and pricing concerns.
Risk Analysis
In evaluating Kadant Inc. (KAI), it’s essential to consider various risks that could influence the company’s performance. Below is a table summarizing the key risks:
| Category | Description | Probability | Impact |
|---|---|---|---|
| Market Risk | Fluctuations in demand for industrial products | High | High |
| Operational Risk | Supply chain disruptions affecting production | Medium | High |
| Regulatory Risk | Changes in environmental regulations | Medium | Medium |
| Competitive Risk | Increased competition from emerging technologies | High | Medium |
| Financial Risk | Volatility in raw material prices | Medium | High |
The most significant risks for KAI include market and operational risks, particularly given recent supply chain challenges and the ever-changing landscape of industrial demand.
Should You Buy Kadant Inc.?
Kadant Inc. has a positive net margin of 10.59% and shows a steady revenue growth of 13.68% year-over-year. The company’s debt level, with a total debt of 322.84M, suggests a manageable leverage, as indicated by a debt-to-equity ratio of 0.38. Currently rated B+, Kadant displays solid fundamentals, but with caution due to recent volatility.
Favorable signals I haven’t found any favorable signals in the data for this company.
Unfavorable signals The company is facing a recent trend of seller dominance, with seller volume exceeding buyer volume, which may indicate a lack of buyer confidence. Additionally, the stock has experienced a negative recent price change of -12.81%, suggesting potential downward pressure.
Conclusion Given the recent seller dominance and negative price trend, it might be prudent to wait for more favorable conditions before considering an investment in Kadant Inc.
Disclaimer: This article is not financial advice. Each investor is responsible for their own investment decisions.
Additional Resources
- Intech Investment Management LLC Sells 1,728 Shares of Kadant Inc $KAI – MarketBeat (Nov 24, 2025)
- Why Kadant (KAI) Shares Are Trading Lower Today – Yahoo Finance (Nov 04, 2025)
- Handelsbanken Fonder AB Boosts Stock Position in Kadant Inc $KAI – MarketBeat (Nov 23, 2025)
- Kadant (NYSE: KAI) declares $0.34 quarterly cash dividend; Board-approved, payable Feb. 5 – Stock Titan (Nov 13, 2025)
- Kadant Inc. Declares Quarterly Cash Dividend of $0.34 Per Share – Quiver Quantitative (Nov 13, 2025)
For more information about Kadant Inc., please visit the official website: kadant.com


