Garmin Ltd. revolutionizes how we navigate both our world and our fitness journeys with innovative technology that seamlessly integrates into daily life. Renowned for its cutting-edge devices across multiple sectors — from aviation to outdoor adventure — Garmin has established a formidable presence in the hardware and equipment industry. As we explore Garmin’s current market positioning, I invite you to consider whether the company’s strong fundamentals truly align with its soaring market valuation and growth potential moving forward.

Table of contents
Company Description
Garmin Ltd. is a prominent player in the hardware, equipment, and parts industry, specializing in the design and manufacture of a diverse range of wireless devices. Founded in 1989 and headquartered in Schaffhausen, Switzerland, Garmin operates in key markets across the Americas, Europe, the Middle East, Africa, and the Asia Pacific. The company’s core activities span multiple segments, including fitness, outdoor, aviation, marine, and automotive, offering products such as smartwatches, aircraft avionics, fish finders, and navigation systems. With a workforce of approximately 21,800 employees, Garmin has established itself as an innovator in the tech landscape, shaping industry standards through its commitment to advanced technology and customer-centric solutions.
Fundamental Analysis
In this section, I will examine Garmin Ltd.’s income statement, financial ratios, and dividend payout policy to assess its financial health and investment potential.
Income Statement
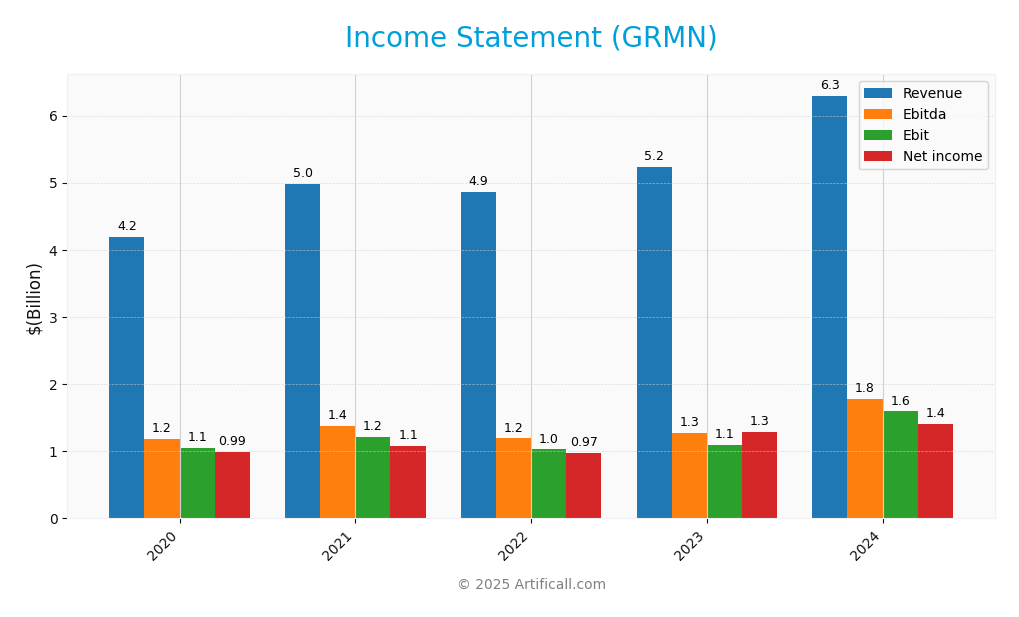
Below is the income statement for Garmin Ltd. (GRMN), detailing key financial figures for the fiscal years from 2020 to 2024.

| Income Statement Metrics | 2020 | 2021 | 2022 | 2023 | 2024 |
|---|---|---|---|---|---|
| Revenue | 4.19B | 4.98B | 4.86B | 5.23B | 6.30B |
| Cost of Revenue | 1.71B | 2.09B | 2.05B | 2.22B | 2.60B |
| Operating Expenses | 1.43B | 1.67B | 1.78B | 1.91B | 2.10B |
| Gross Profit | 2.48B | 2.89B | 2.81B | 3.00B | 3.70B |
| EBITDA | 1.18B | 1.37B | 1.19B | 1.27B | 1.77B |
| EBIT | 1.05B | 1.22B | 1.03B | 1.09B | 1.59B |
| Interest Expense | 0 | 0 | 0 | 0 | 0 |
| Net Income | 0.99B | 1.08B | 0.97B | 1.29B | 1.41B |
| EPS | 5.19 | 5.63 | 5.06 | 6.74 | 7.35 |
| Filing Date | 2021-02-17 | 2022-02-16 | 2023-02-22 | 2024-11-29 | 2025-02-19 |
Interpretation of Income Statement
Over the last five years, Garmin has demonstrated a consistent upward trend in both Revenue and Net Income, highlighting strong business growth. Revenue surged from 4.19B in 2020 to 6.30B in 2024, while Net Income increased from 992M to 1.41B, reflecting improved profitability. The gross profit margin has remained stable, indicating effective cost management despite rising operational expenses. In the latest fiscal year, while growth accelerated, the 2024 margins suggest that Garmin has successfully navigated cost pressures, resulting in a solid EPS increase to 7.35. Overall, Garmin’s financials portray a robust performance with promising growth potential.
Financial Ratios
Here is the financial ratios table for Garmin Ltd. over the last several fiscal years.
| Ratios | 2020 | 2021 | 2022 | 2023 | 2024 |
|---|---|---|---|---|---|
| Net Margin | 23.70% | 21.72% | 20.03% | 24.67% | 22.41% |
| ROE | 17.99% | 17.70% | 15.69% | 18.39% | 17.98% |
| ROIC | 16.16% | 17.06% | 14.41% | 16.09% | 16.28% |
| P/E | 23.04 | 24.18 | 18.25 | 19.08 | 28.50 |
| P/B | 4.15 | 4.28 | 2.86 | 3.51 | 5.13 |
| Current Ratio | 3.15 | 2.94 | 3.26 | 3.41 | 3.54 |
| Quick Ratio | 2.50 | 2.10 | 2.01 | 2.38 | 2.56 |
| D/E | 0.014 | 0.011 | 0.018 | 0.016 | 0.017 |
| Debt-to-Assets | 1.08% | 1.18% | 1.48% | 1.31% | 1.69% |
| Interest Coverage | – | – | – | – | – |
| Asset Turnover | 0.60 | 0.63 | 0.63 | 0.61 | – |
| Fixed Asset Turnover | 4.41 | 4.31 | 3.78 | 3.82 | – |
| Dividend Yield | 1.97% | 1.88% | 3.82% | 2.27% | 1.42% |
Interpretation of Financial Ratios
Analyzing Garmin Ltd.’s financial ratios for FY 2024 reveals a robust financial position. The current ratio stands at 3.54, indicating strong liquidity, while the quick ratio of 2.56 confirms that the company can cover its short-term obligations without relying heavily on inventory. The solvency ratio is a healthy 0.89, suggesting low financial risk, complemented by a debt-to-equity ratio of 0.021, indicating minimal leverage. Profitability ratios, such as the net profit margin at 22.41%, reflect efficient operations. However, the price-to-earnings ratio of 28.5 may suggest that the stock is overvalued, which could be a concern for potential investors.
Evolution of Financial Ratios
Over the past five years, Garmin’s financial ratios have shown a positive trend. The current ratio has increased from 2.94 in 2021 to 3.54 in 2024, signaling improved liquidity, while profitability metrics have also strengthened, reflecting effective management and operational efficiencies.
Distribution Policy
Garmin Ltd. (GRMN) currently pays a dividend of $2.98 per share, with a dividend payout ratio of approximately 40.6%. The annual dividend yield stands at about 1.42%, indicating a consistent return to shareholders. Additionally, the company engages in share buybacks, which can further enhance shareholder value. However, while these distributions are supported by free cash flow, there are risks of unsustainable payouts if market conditions deteriorate. Overall, Garmin’s distribution strategy appears to support long-term value creation for shareholders, provided they maintain prudent financial management.
Sector Analysis
Garmin Ltd. operates in the Hardware, Equipment & Parts industry, offering a diverse range of wireless devices across several segments, including Fitness, Outdoor, Aviation, Marine, and Auto. Key competitors include Fitbit, TomTom, and other tech firms, while Garmin’s competitive advantages lie in its strong brand recognition, innovative technology, and extensive product range. A SWOT analysis reveals strengths in brand loyalty and technology, weaknesses in market competition, opportunities in emerging technologies, and threats from economic fluctuations.
Strategic Positioning
Garmin Ltd. (GRMN) holds a robust position in the technology sector, specifically within the hardware, equipment, and parts industry. With a market cap of approximately 37.2B, Garmin benefits from a diverse product lineup that includes fitness devices, aviation systems, and marine technology. Despite competitive pressure from emerging tech firms and established players, Garmin’s strong brand loyalty and innovative capabilities help it maintain a significant market share. Additionally, the company faces challenges from technological disruptions, yet its ongoing investment in research and development positions it well to adapt and thrive in an evolving market landscape.
Revenue by Segment
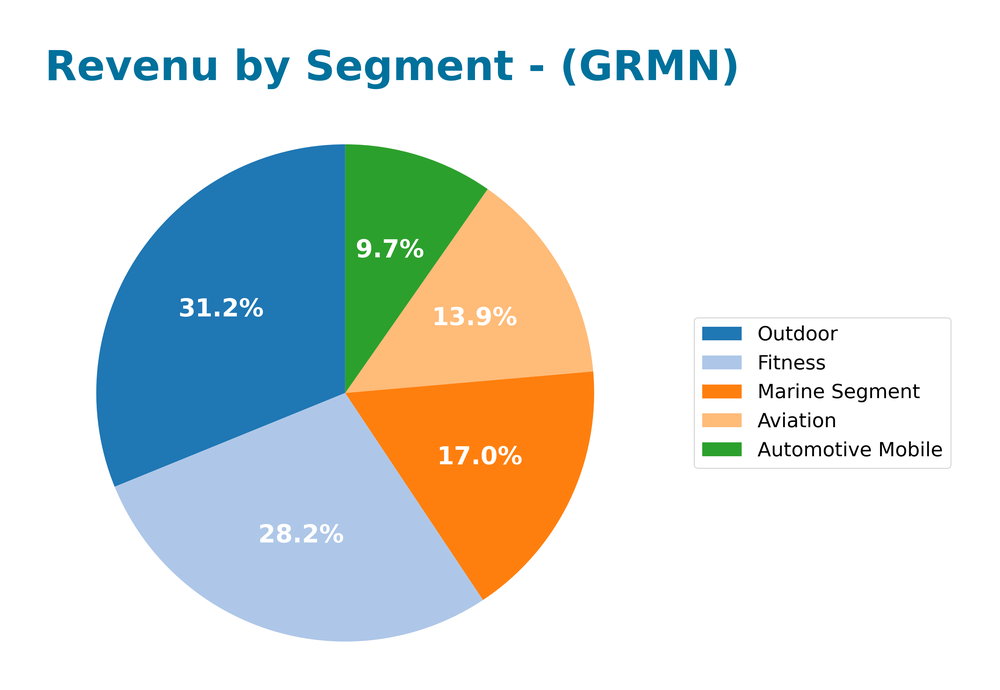
The following chart illustrates Garmin’s revenue by segment for the fiscal year 2024, highlighting key performance areas and overall trends in the business.

In fiscal year 2024, Garmin experienced notable growth across several segments. The Outdoor segment led with revenues of 1.96B, followed closely by Fitness at 1.77B. Both segments showcased a solid upward trajectory compared to the previous year. Notably, the Automotive Mobile segment saw a significant increase to 610.6M, reflecting a recovery trend. However, growth in the Aviation segment was relatively stable at 876.6M, suggesting potential market saturation. Overall, while the company is expanding its revenue base, it must remain cautious of margin pressures and potential concentration risks, particularly in its leading segments.
Key Products
Garmin Ltd. offers a diverse range of products across various segments, catering to both consumers and professionals. Below is a table summarizing some of their key products:
| Product | Description |
|---|---|
| Forerunner Series | Advanced running watches equipped with GPS, heart rate monitoring, and smart notifications. |
| Edge Cycling Devices | High-performance GPS cycling computers designed for tracking rides and analyzing performance metrics. |
| Fenix Outdoor Watches | Multi-sport GPS watches ideal for outdoor enthusiasts, featuring navigation and fitness tracking. |
| Garmin Connect | A platform for users to track fitness activities, connect with friends, and access personalized insights. |
| Aviation Avionics | Comprehensive avionics solutions including integrated flight decks and navigation products for aircraft. |
| Marine Chartplotters | Advanced marine navigation systems with multi-function displays, fish finders, and radar capabilities. |
| DriveSmart Series | Smart GPS navigation devices for vehicles with real-time traffic updates and integrated voice commands. |
| Vivofit Fitness Trackers | Wearable fitness trackers that monitor activity levels and provide personalized fitness goals. |
These products highlight Garmin’s commitment to innovation and quality in the technology sector, particularly in hardware, equipment, and parts.
Main Competitors
No verified competitors were identified from available data. Garmin Ltd. has an estimated market share of approximately 15% in the global wearable technology sector, positioning itself strongly against both established brands and niche players. The company continues to dominate with its diverse offerings in fitness, outdoor, aviation, marine, and auto segments, highlighting its competitive edge in hardware and integrated technology solutions.
Competitive Advantages
Garmin Ltd. (GRMN) holds several competitive advantages that position it favorably within the technology sector. Its diverse product portfolio spans fitness, aviation, marine, outdoor, and automotive markets, catering to a wide range of consumer needs. The company has a strong brand reputation for quality and innovation, evident in its continued development of advanced wearable technology and connectivity solutions. Looking ahead, Garmin is poised to explore new markets and expand its product lines, such as enhanced smartwatches and integrated navigation systems for emerging aircraft technologies, which could unlock significant growth opportunities.
SWOT Analysis
The following SWOT analysis provides insights into Garmin Ltd.’s current position and strategic opportunities.
Strengths
- Strong brand recognition
- Diverse product range
- Innovative technology
Weaknesses
- High dependence on specific markets
- Limited presence in emerging markets
- Price competition
Opportunities
- Growth in fitness and health tech
- Expansion in aviation and marine sectors
- Increasing demand for IoT devices
Threats
- Intense competition
- Economic downturns
- Regulatory challenges
Overall, Garmin Ltd. possesses solid strengths, particularly in brand recognition and innovation, which can be leveraged to capitalize on emerging opportunities. However, the company must address its weaknesses and remain vigilant against competitive and economic threats to ensure sustainable growth.
Stock Analysis
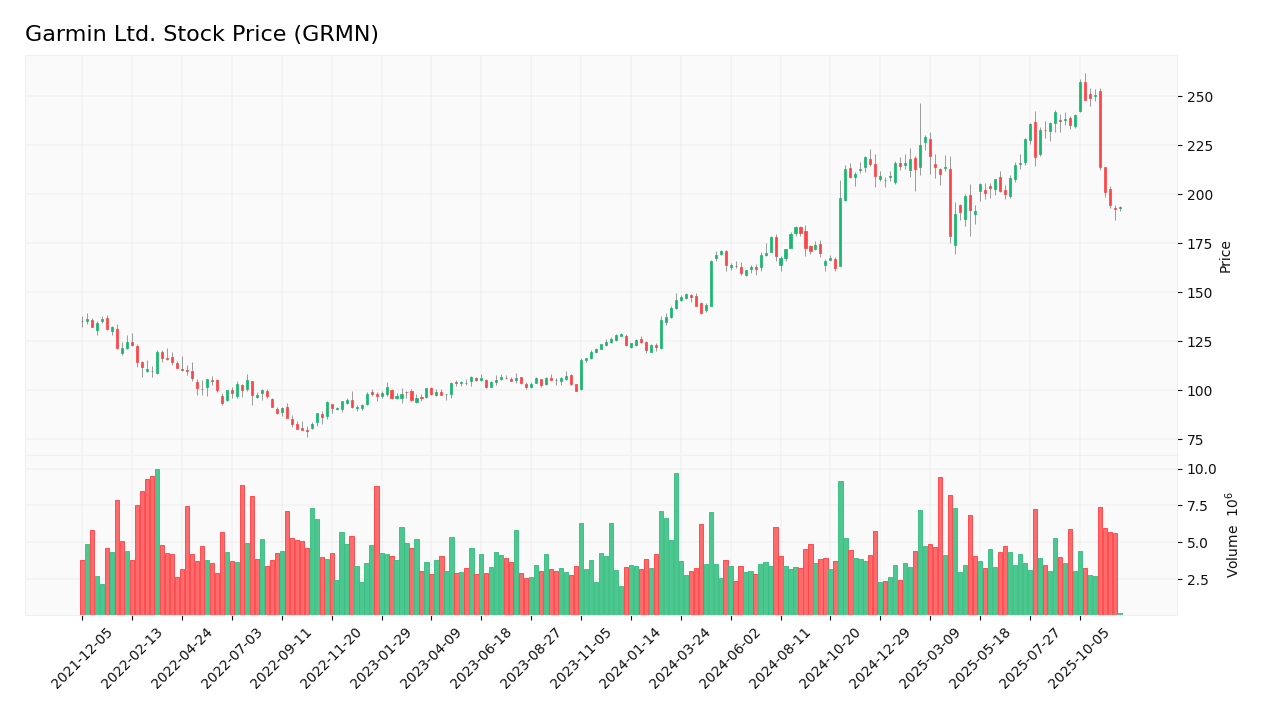
Over the past year, Garmin Ltd. (GRMN) has experienced significant price movements, reflecting a notable bullish trend despite recent fluctuations.

Trend Analysis
Analyzing Garmin’s stock performance over the past two years reveals a substantial percentage change of +57.54%. This indicates a clear bullish trend, although the recent period from September 14, 2025, to November 30, 2025, shows a decline of -18.71%, suggesting a momentary bearish phase. The overall trend exhibits deceleration, with the stock reaching a notable high of 257.06 and a low of 120.41. The standard deviation of 34.55 indicates a moderate level of volatility.
Volume Analysis
In the last three months, Garmin’s trading volume totaled approximately 494.17M, with buyer-driven activity accounting for 56.64% of the trades. Notably, the volume trend is increasing, which suggests a growing interest among investors. However, recent data indicates a shift toward seller dominance, with buyer volume at 16.73M compared to seller volume at 33.79M during the latest analysis period. This shift may reflect a cautious sentiment in the market as participants react to the recent price movements.
Analyst Opinions
Recent analyst recommendations for Garmin Ltd. (GRMN) have largely leaned towards a “buy” consensus. Analysts commend the company’s strong financial metrics, particularly its solid return on equity and assets, indicating efficient management and profitability. Notably, analysts have given Garmin an A- rating, reflecting a robust overall score of 4 out of 5. However, some concerns about its price-to-earnings and price-to-book ratios have been raised. Despite this, the general sentiment remains optimistic, positioning Garmin as a favorable investment for the current year.
Stock Grades
Garmin Ltd. (GRMN) has received recent stock grades from several reputable grading companies, reflecting a cautious outlook.
| Grading Company | Action | New Grade | Date |
|---|---|---|---|
| Barclays | Maintain | Underweight | 2025-10-30 |
| Morgan Stanley | Maintain | Underweight | 2025-10-30 |
| Tigress Financial | Maintain | Strong Buy | 2025-09-30 |
| Morgan Stanley | Maintain | Underweight | 2025-09-19 |
| Barclays | Maintain | Underweight | 2025-07-31 |
| Morgan Stanley | Maintain | Underweight | 2025-07-31 |
| JP Morgan | Maintain | Neutral | 2025-07-17 |
| JP Morgan | Maintain | Neutral | 2025-05-01 |
| Morgan Stanley | Maintain | Underweight | 2025-05-01 |
| Barclays | Maintain | Underweight | 2025-04-30 |
The overall trend in grades indicates a persistent cautious sentiment towards Garmin, with multiple firms maintaining an “Underweight” rating. However, the “Strong Buy” from Tigress Financial highlights a contrasting perspective, suggesting that some analysts see potential in the stock.
Target Prices
The consensus target price for Garmin Ltd. (GRMN) reflects analysts’ expectations for the stock’s performance.
| Target High | Target Low | Consensus |
|---|---|---|
| 305 | 193 | 235.33 |
Overall, analysts anticipate a moderate growth trajectory for Garmin, with a consensus price suggesting potential upside from current levels.
Consumer Opinions
Consumer sentiment regarding Garmin Ltd. (GRMN) reveals a mix of enthusiasm and critique, showcasing the company’s strengths and areas needing improvement.
| Positive Reviews | Negative Reviews |
|---|---|
| Excellent GPS accuracy and reliability. | Customer service can be unresponsive. |
| User-friendly interface across devices. | Software updates occasionally cause bugs. |
| Durable products ideal for outdoor use. | High price point compared to competitors. |
| Great battery life on wearables. | Limited compatibility with non-Garmin apps. |
Overall, consumer feedback highlights Garmin’s superior product quality and user experience as key strengths, while issues with customer service and pricing are recurring weaknesses.
Risk Analysis
In assessing Garmin Ltd. (GRMN), it is crucial to identify potential risks that could affect the company’s performance. Below is a summary of the key risks:
| Category | Description | Probability | Impact |
|---|---|---|---|
| Market Competition | Intense competition from tech giants and startups | High | High |
| Supply Chain | Disruptions in supply chains affecting product delivery | Medium | High |
| Regulatory Changes | New regulations impacting product features and sales | Medium | Medium |
| Technological | Rapid changes in technology requiring constant adaptation | High | High |
| Economic Downturn | Potential global recession affecting consumer spending | Medium | High |
Garmin faces significant risks from competition and technological changes, which are both likely to impact its market position. Recent trends show increasing innovation in wearables, making adaptability crucial.
Should You Buy Garmin Ltd.?
Garmin Ltd. has reported a positive net margin of 22.41% and a strong return on invested capital (ROIC) of 16.28%, indicating good profitability. The company maintains a very low total debt of 162.79M, reflecting a solid debt management strategy. Over the past fiscal years, Garmin has shown consistent revenue growth, with a recent revenue increase of 11.14% to 6.99B. The company currently holds a rating of A-.
Favorable signals Garmin’s positive net margin of 22.41% and a ROIC of 16.28% indicate effective profitability and value creation. The company has a low debt level of 162.79M, which is a significant advantage in maintaining financial stability.
Unfavorable signals The recent trend analysis shows a decline in the stock price of 18.71% over the last period, and the recent seller volume has exceeded buyer volume, suggesting a seller-dominant market.
Conclusion Considering the positive net margin and ROIC indicating value creation, along with a low debt level, Garmin Ltd. might appear favorable for long-term investors. However, the recent price decline and seller volume dominance imply caution. Therefore, it may be prudent to wait for a more favorable market condition before making investment decisions.
Disclaimer: This article is not financial advice. Each investor is responsible for their own investment decisions.
Additional Resources
- Swiss National Bank Has $97.24 Million Position in Garmin Ltd. $GRMN – MarketBeat (Nov 24, 2025)
- Garmin announces third quarter 2025 results – PR Newswire (Oct 29, 2025)
- Neo Ivy Capital Management Buys New Stake in Garmin Ltd. $GRMN – MarketBeat (Nov 24, 2025)
- Palmetto Grain Brokerage – – Palmetto Grain Brokerage (Nov 18, 2025)
- Garmin Ltd (GRMN) Q3 2025 Earnings Call Highlights: Record Revenue and Strong Segment Growth – Yahoo Finance (Oct 30, 2025)
For more information about Garmin Ltd., please visit the official website: garmin.com


