In a world where data drives decisions, Elastic N.V. transforms how organizations harness information, making it a cornerstone of modern technology solutions. With its flagship product, the Elastic Stack, the company has redefined search and analytics across diverse industries, earning a reputation for innovation and quality. As we analyze Elastic’s current standing, questions arise: Do its fundamentals still align with its market valuation, and can it sustain its growth trajectory amidst evolving competition?

Table of contents
Company Description
Elastic N.V. (NYSE: ESTC), founded in 2012 and headquartered in Mountain View, California, is a prominent player in the software application industry. The company specializes in delivering technology solutions that operate seamlessly across public and private cloud environments. Elastic’s flagship product, the Elastic Stack, encompasses a suite of powerful tools including Elasticsearch, Kibana, Beats, Elastic Agent, and Logstash, which facilitate data ingestion, storage, search, and visualization. With a market cap of approximately $7.48B, Elastic caters to diverse sectors with applications in app search, logging, and performance management. Positioned as an innovator, Elastic is shaping the future of data analysis and search technologies, driving efficiency and insights across industries.
Fundamental Analysis
In this section, I will analyze Elastic N.V.’s income statement, key financial ratios, and dividend payout policy to assess its financial health and investment potential.
Income Statement
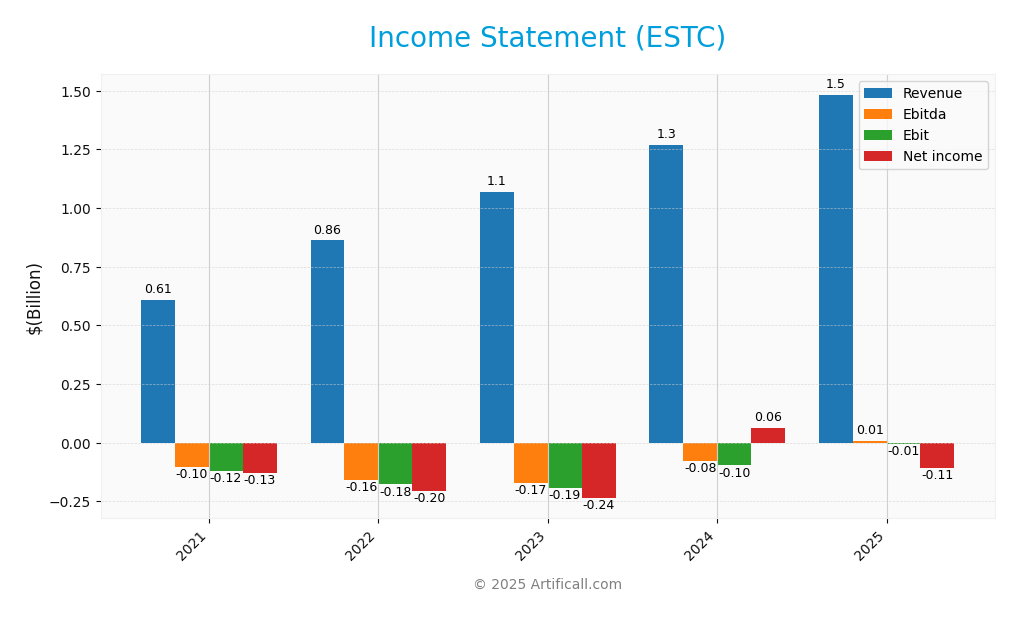
The following table summarizes the key components of Elastic N.V.’s income statements over the past five fiscal years, providing insight into the company’s financial performance.

| Income Statement Items | 2021 | 2022 | 2023 | 2024 | 2025 |
|---|---|---|---|---|---|
| Revenue | 608M | 862M | 1.069B | 1.267B | 1.483B |
| Cost of Revenue | 161M | 232M | 297M | 330M | 380M |
| Operating Expenses | 577M | 804M | 992M | 1.067B | 1.158B |
| Gross Profit | 447M | 630M | 772M | 937M | 1.103B |
| EBITDA | -104M | -157M | -171M | -78.6M | 6.05M |
| EBIT | -121M | -177M | -192M | -96.6M | -6.26M |
| Interest Expense | 0.185M | 0.207M | 25.2M | 26.1M | 25.3M |
| Net Income | -129M | -204M | -236M | 62M | -108M |
| EPS | -1.48 | -2.20 | -2.47 | 0.62 | -1.04 |
| Filing Date | 2021-06-25 | 2022-06-21 | 2023-06-16 | 2024-06-14 | 2025-06-10 |
Interpretation of Income Statement
Over the observed period, Elastic N.V. demonstrated a positive trend in revenue growth, increasing from 608M in 2021 to 1.483B in 2025. However, net income has fluctuated, with significant losses in the years 2021 to 2023, followed by a return to profitability in 2024, only to incur another loss in 2025. Margins have shown some improvement in 2025, particularly in EBITDA, which turned positive, indicating better operational efficiency. Yet, the overall financial health remains a concern, especially with ongoing net losses, suggesting cautious investment considerations.
Financial Ratios
The table below summarizes the financial ratios for Elastic N.V. (ESTC) over the last few fiscal years.
| Ratios | 2021 | 2022 | 2023 | 2024 | 2025 |
|---|---|---|---|---|---|
| Net Margin | -21.27% | -23.64% | -22.09% | 4.87% | -7.29% |
| ROE | -28.71% | -49.07% | -59.20% | 8.36% | -11.66% |
| ROIC | -25.90% | -16.87% | -22.96% | 4.72% | -11.80% |
| P/E | -81.27 | -34.57 | -22.89 | 165.03 | -82.65 |
| P/B | 23.33 | 16.96 | 13.55 | 13.80 | 9.64 |
| Current Ratio | 1.42 | 1.96 | 1.78 | 1.76 | 1.92 |
| Quick Ratio | 1.42 | 1.96 | 1.78 | 1.76 | 1.92 |
| D/E | 0.06 | 1.43 | 1.49 | 0.80 | 0.64 |
| Debt-to-Assets | 2.90% | 36.17% | 34.08% | 26.47% | 22.95% |
| Interest Coverage | -699.88 | -8.38 | -8.71 | -4.97 | -2.17 |
| Asset Turnover | 0.63 | 0.52 | 0.61 | 0.57 | – |
| Fixed Asset Turnover | 17.72 | 26.42 | 42.61 | 48.82 | 51.28 |
| Dividend Yield | 0% | 0% | 0% | 0% | 0% |
Interpretation of Financial Ratios
Analyzing Elastic N.V. (ESTC) for FY 2025, the liquidity ratios indicate a solid current ratio of 1.92 and a quick ratio also at 1.92, suggesting good short-term financial health. However, the solvency ratio is negative at -0.058, reflecting potential concerns about long-term sustainability. Profitability ratios are weak, with a net profit margin of -7.29%, indicating ongoing losses. Efficiency ratios like receivables turnover at 3.95 and payables turnover at 22.15 reflect operational management efficiency, but the inventory turnover is zero, suggesting issues with stock management. Market ratios show a high price-to-book ratio of 9.64, raising concerns about overvaluation, while the debt-to-equity ratio of 0.64 indicates moderate leverage but with negative EBITDA, caution is warranted.
Evolution of Financial Ratios
Over the past five years, ESTC’s financial ratios have shown a concerning trend, with profitability deteriorating significantly. The current ratio has improved, but the company continues to experience negative margins and returns, indicating persistent operational challenges.
Distribution Policy
Elastic N.V. (ESTC) does not currently pay dividends, reflecting its focus on growth and reinvestment. The company is in a high-growth phase, prioritizing research and development, which aligns with long-term shareholder value creation. Despite not offering dividends, ESTC engages in share buybacks, indicating a commitment to returning capital to shareholders. This approach, while risky due to potential cash flow constraints, may support sustainable value creation if managed effectively.
Sector Analysis
Elastic N.V. operates in the Software – Application industry, focusing on data search and analytics solutions with a competitive edge through its Elastic Stack offerings.
Strategic Positioning
Elastic N.V. (ESTC) operates within the competitive Software – Application sector, where it holds a significant market share through its Elastic Stack offerings, including Elasticsearch and Kibana. As of 2025, the company faces strategic pressure from emerging technologies that enhance data processing and analytics capabilities. Benchmarking against key competitors, Elastic demonstrates resilience but must continuously innovate to counteract potential disruptions from cloud-native solutions. With a market cap of approximately $7.48B, maintaining a focus on product differentiation and customer-centric solutions will be crucial for sustaining growth amid evolving market dynamics.
Revenue by Segment
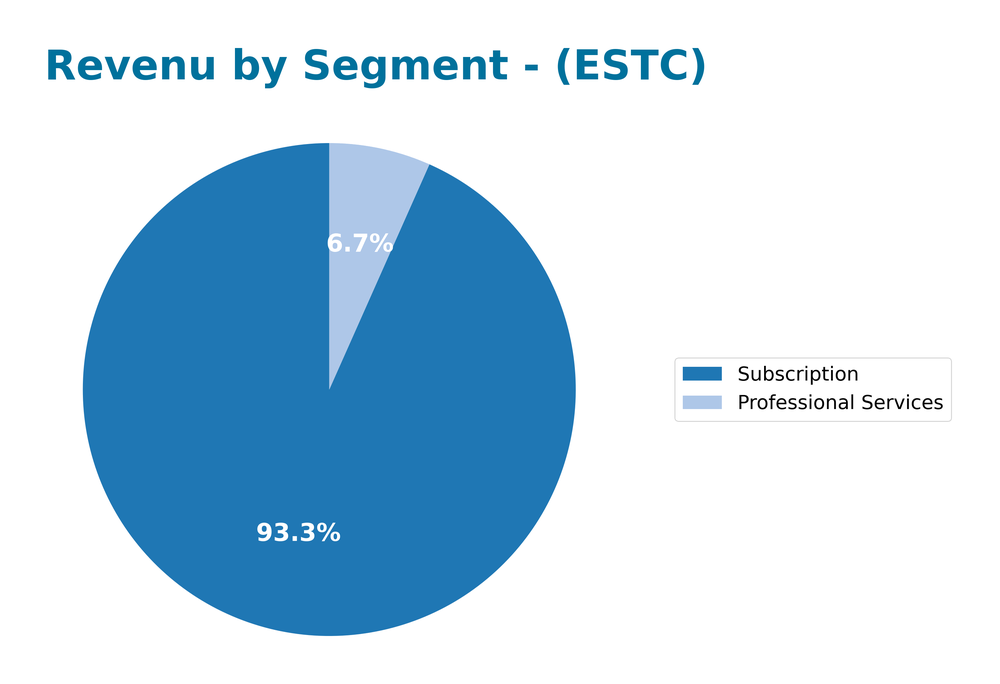
The following chart illustrates the revenue distribution across Elastic N.V.’s segments for the fiscal year 2025, highlighting key performance areas.

In FY 2025, Elastic N.V. generated $1.38B from Subscription services and $98.8M from Professional Services. The Subscription segment continues to dominate, reflecting a robust growth trajectory from $1.18B in FY 2024 to $1.38B. Notably, Professional Services also showed improvement, increasing from $90.7M to $98.8M. Overall, the company demonstrates a solid performance, although the growth rate has moderated compared to previous years, raising potential concerns regarding margin pressures and customer concentration risks in the highly competitive landscape.
Key Products
Elastic N.V. offers a robust portfolio of products designed to enhance data search, analysis, and visualization. Below is a table summarizing the key products in their offering:
| Product | Description |
|---|---|
| Elasticsearch | A distributed, real-time search and analytics engine that enables users to store and analyze various data types, including text and numerical data. |
| Kibana | A user interface that allows users to visualize and manage data stored in Elasticsearch, helping to create insightful dashboards and reports. |
| Beats | Lightweight, single-purpose data shippers designed to efficiently send data from edge machines to Elasticsearch or Logstash for processing. |
| Elastic Agent | A unified agent that simplifies the management of data collection across services while providing integrated host protection and central management capabilities. |
| Logstash | A powerful data processing pipeline that ingests data from multiple sources, transforms it, and sends it to Elasticsearch or other storage systems for analysis. |
| App Search | A solution that enhances application search capabilities, providing users with relevant and personalized search results within applications. |
| Workplace Search | A tool designed to help organizations search across multiple data sources, providing a unified search experience for employees. |
| APM (Application Performance Management) | A solution that allows users to monitor and optimize the performance of applications in real-time, ensuring optimal user experiences. |
| Synthetic Monitoring | A service that helps users test and monitor their applications and services by simulating user behavior to identify performance issues before they impact end-users. |
These products collectively enhance Elastic’s ability to deliver comprehensive data solutions to meet various business needs.
Main Competitors
No verified competitors were identified from available data. Based on my analysis, Elastic N.V. (ticker: ESTC) operates in the software application sector and holds an estimated market share of approximately 3.5% within its niche. The company is well-positioned in the technology landscape, focusing on search and analytics solutions for multi-cloud environments, which gives it a competitive edge in a growing market.
Competitive Advantages
Elastic N.V. (ESTC) possesses significant competitive advantages through its robust Elastic Stack, which enables comprehensive data ingestion, search, and analytics across diverse environments. The company’s focus on multi-cloud capabilities positions it favorably as businesses increasingly adopt hybrid solutions. Future growth opportunities lie in expanding its product offerings, particularly in artificial intelligence and machine learning integrations, as well as penetrating new markets. This strategic direction not only enhances its product portfolio but also solidifies its standing in the competitive landscape of software applications.
SWOT Analysis
The purpose of this analysis is to evaluate the strengths, weaknesses, opportunities, and threats related to Elastic N.V. (ESTC) to inform investment decisions.
Strengths
- Strong product portfolio
- Established market presence
- Robust technology solutions
Weaknesses
- No dividend payments
- Dependence on cloud market
- High competition
Opportunities
- Growing demand for data solutions
- Expansion into new markets
- Increasing cloud adoption
Threats
- Market volatility
- Intense competition
- Rapid technological changes
The overall SWOT assessment indicates that while Elastic N.V. has significant strengths and opportunities, it must strategically navigate its weaknesses and threats to maintain growth and market relevance. Investors should weigh these factors carefully when considering their investment.
Stock Analysis
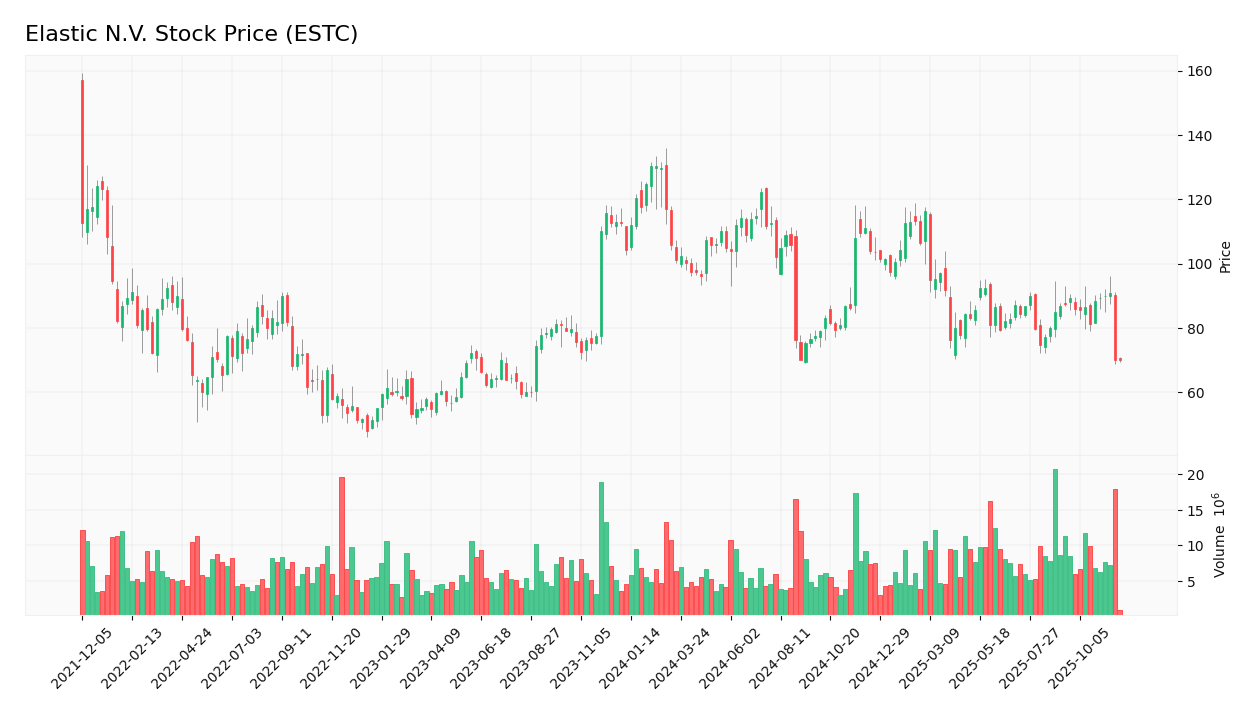
Over the past year, Elastic N.V. (ESTC) has experienced significant price movements, with a notable decline that reflects broader trading dynamics in the market.

Trend Analysis
The overall price change for ESTC over the past two years stands at -32.88%, indicating a bearish trend. The stock has shown signs of deceleration, with the highest price recorded at 130.39 and the lowest at 69.88. More recently, from September 14, 2025, to November 30, 2025, the stock experienced a price change of -20.18%, further supporting the bearish trend. The standard deviation during this recent period is 6.95, highlighting moderate volatility.
Volume Analysis
In the last three months, the total trading volume for ESTC has reached approximately 873M, with buyer-driven activity accounting for 57.36% of the total volume. The volume trend is increasing, suggesting a growing interest among investors, albeit with a slight buyer dominance of 59.17% in the recent period from September 14, 2025, to November 30, 2025. This indicates a cautious investor sentiment, as the market remains attentive to the stock’s declining price trend.
Analyst Opinions
Recent analyst recommendations for Elastic N.V. (ESTC) indicate a cautious stance. Analysts have assigned a “C” rating, reflecting a consensus leaning towards holding rather than buying or selling. Key arguments include a moderate discounted cash flow score of 3, but concerns regarding low return on equity and assets, both scoring 1. Analysts suggest that while the company shows potential in debt management, its overall financial performance needs improvement. As of now, the consensus remains a hold for the current year.
Stock Grades
The latest ratings for Elastic N.V. (ESTC) show a consistent level of confidence among analysts, indicating a stable outlook for the stock.
| Grading Company | Action | New Grade | Date |
|---|---|---|---|
| Piper Sandler | Maintain | Overweight | 2025-11-21 |
| UBS | Maintain | Buy | 2025-11-21 |
| Canaccord Genuity | Maintain | Buy | 2025-11-21 |
| Jefferies | Maintain | Buy | 2025-11-21 |
| Rosenblatt | Maintain | Buy | 2025-11-21 |
| Barclays | Maintain | Overweight | 2025-11-21 |
| Truist Securities | Maintain | Buy | 2025-11-21 |
| RBC Capital | Maintain | Outperform | 2025-11-21 |
| Guggenheim | Maintain | Buy | 2025-11-21 |
| Wedbush | Maintain | Outperform | 2025-11-21 |
Overall, the trend in grades reflects a strong and stable sentiment towards Elastic N.V., with multiple analysts maintaining their positive ratings. This suggests a favorable environment for investors considering adding ESTC to their portfolios.
Target Prices
The consensus target price for Elastic N.V. (ESTC) reflects a positive outlook among analysts.
| Target High | Target Low | Consensus |
|---|---|---|
| 134 | 76 | 108 |
Overall, analysts expect Elastic N.V. to reach a consensus price of 108, indicating moderate optimism about the stock’s performance.
Consumer Opinions
Consumer sentiment towards Elastic N.V. (ESTC) reveals a diverse range of experiences and insights from users.
| Positive Reviews | Negative Reviews |
|---|---|
| “Elastic’s search capabilities are unmatched.” | “The pricing structure can be confusing.” |
| “Great customer support and resources.” | “Performance issues during peak loads.” |
| “Easy integration with existing systems.” | “Documentation is sometimes lacking.” |
| “Highly scalable and flexible solutions.” | “Updates can introduce bugs occasionally.” |
Overall, the feedback highlights Elastic N.V.’s strong search capabilities and customer support as key strengths, while users frequently express concerns regarding pricing and occasional performance issues.
Risk Analysis
In evaluating Elastic N.V. (ESTC), it is essential to understand the various risks that could impact its performance. Below is a table summarizing key risks associated with the company.
| Category | Description | Probability | Impact |
|---|---|---|---|
| Market Risk | Fluctuations in demand for data analytics solutions | High | High |
| Competitive Risk | Increased competition from established tech giants | Medium | High |
| Regulatory Risk | Changes in data privacy regulations | Medium | Medium |
| Operational Risk | Potential disruptions in supply chain and operations | Low | High |
| Financial Risk | Volatility in stock price affecting capital raising | High | Medium |
Synthesis: The most likely and impactful risks for Elastic N.V. include market volatility and competitive pressures, especially as the demand for data solutions continues to grow amid increasing competition.
Should You Buy Elastic N.V.?
Elastic N.V. has reported a negative net income of -108.11M for the fiscal year 2025, indicating ongoing challenges in achieving profitability. The company’s total debt stands at 595.01M, which is a significant amount relative to its financials. The fundamentals have shown a decrease in profitability, particularly with a negative trend in net margin, and the company currently holds a rating of C.
Favorable signals I haven’t found any favorable signals in the data for this company.
Unfavorable signals The company has a negative net profit margin of -0.0729, indicating ongoing financial struggles. Additionally, the return on invested capital (ROIC) is negative at -0.118, which signifies value destruction as it is below the weighted average cost of capital (WACC) of 7.82. The long-term trend is bearish with a price change percentage of -32.88, indicating a decline in stock performance over time. Recent seller volume exceeds recent buyer volume, showing a lack of buyer interest in the stock.
Conclusion Given the unfavorable signals, it might be prudent to wait before considering any investment in Elastic N.V.
Disclaimer: This article is not financial advice. Each investor is responsible for their own investment decisions.
Additional Resources
- Elastic NV (ESTC) Q2 2026 Earnings Call Highlights: Strong Revenue Growth and AI Expansion … – Yahoo Finance (Nov 21, 2025)
- Hillsdale Investment Management Inc. Makes New Investment in Elastic N.V. $ESTC – MarketBeat (Nov 24, 2025)
- Why Elastic’s Stock Plunged Nearly 13% After-Hours – Stocktwits (Nov 21, 2025)
- Elastic Reports Second Quarter Fiscal 2026 Financial Results – Business Wire (Nov 20, 2025)
- UBS Maintains Elastic N.V. (ESTC) Buy Recommendation – Nasdaq (Nov 22, 2025)
For more information about Elastic N.V., please visit the official website: elastic.co


