Imagine a world where seamless connections and innovative welding technologies drive industries forward. ESAB Corporation stands at the forefront of metal fabrication, revolutionizing how businesses operate with its cutting-edge welding consumables and automated solutions. Renowned for its commitment to quality and innovation, ESAB caters to diverse markets, from construction to renewable energy. As I delve into the investment potential of ESAB, I urge you to consider whether its strong fundamentals still justify its current market valuation and growth trajectory.

Table of contents
Company Description
ESAB Corporation, founded in 2021 and headquartered in Wilmington, Delaware, specializes in manufacturing and supplying consumable products and equipment for cutting, joining, and automated welding. With a market capitalization of $6.53B, ESAB stands as a noteworthy player in the metal fabrication industry, offering a diverse range of welding consumables and advanced fabrication technology. The company operates in various markets, including construction, transportation, and renewable energy, selling its products through independent distributors and direct sales. ESAB’s strategic focus on innovation and digital solutions positions it as a leader in enhancing productivity and efficiency in welding operations, shaping the future of the industry.
Fundamental Analysis
In this section, I will conduct a fundamental analysis of ESAB Corporation, examining its income statement, financial ratios, and dividend payout policy.
Income Statement
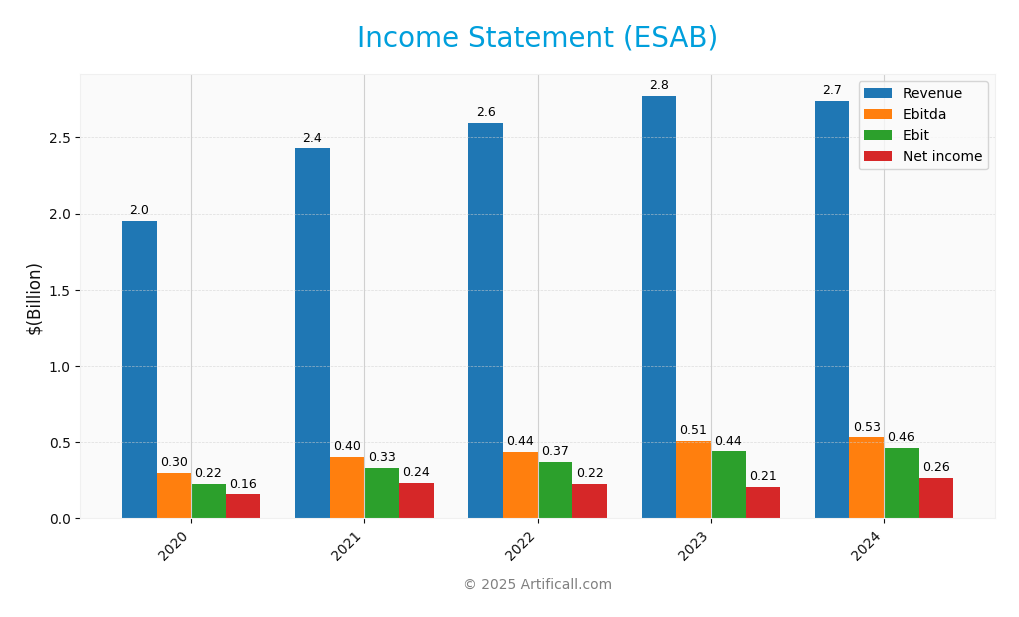
The following table provides a comprehensive overview of ESAB Corporation’s income statement over the past five fiscal years, highlighting key financial metrics.

| Metric | 2020 | 2021 | 2022 | 2023 | 2024 |
|---|---|---|---|---|---|
| Revenue | 1.95B | 2.43B | 2.59B | 2.77B | 2.74B |
| Cost of Revenue | 1.27B | 1.59B | 1.71B | 1.76B | 1.70B |
| Operating Expenses | 480M | 532M | 556M | 612M | 590M |
| Gross Profit | 682M | 838M | 886M | 1.02B | 1.04B |
| EBITDA | 299M | 405M | 435M | 509M | 531M |
| EBIT | 225M | 330M | 370M | 440M | 465M |
| Interest Expense | 0 | 0 | 38M | 85M | 65M |
| Net Income | 157M | 235M | 224M | 205M | 265M |
| EPS | 2.62 | 3.92 | 3.73 | 3.38 | 4.36 |
| Filing Date | 2020-12-31 | 2021-12-31 | 2022-12-31 | 2023-12-31 | 2025-02-20 |
Interpretation of Income Statement
Over the last five years, ESAB Corporation has exhibited stable revenue, peaking at 2.77B in 2023 before slightly declining to 2.74B in 2024. Net income has shown a promising trajectory, increasing from 157M in 2020 to 265M in 2024, reflecting improved operational efficiency. Margins, particularly gross and EBITDA margins, have remained relatively stable, suggesting effective cost management despite fluctuating revenues. In 2024, the company maintained a solid performance, with net income rising significantly compared to the previous year, indicating potential for sustained growth moving forward.
Financial Ratios
The following table summarizes the key financial ratios for ESAB Corporation over the last few years.
| Ratios | 2020 | 2021 | 2022 | 2023 | 2024 |
|---|---|---|---|---|---|
| Net Margin | 8.07% | 9.68% | 8.63% | 7.40% | 9.66% |
| ROE | 6.29% | 9.55% | 16.57% | 12.77% | 14.97% |
| ROIC | 5.33% | 7.94% | 7.99% | 8.76% | 10.30% |
| P/E | 19.07 | 12.77 | 12.59 | 25.42 | 27.37 |
| P/B | 1.20 | 1.22 | 2.09 | 3.25 | 4.10 |
| Current Ratio | 1.75 | 1.62 | 1.64 | 1.61 | 1.82 |
| Quick Ratio | 1.07 | 0.91 | 0.95 | 0.98 | 1.18 |
| D/E | 0.04 | 0.04 | 0.97 | 0.70 | 0.66 |
| Debt-to-Assets | 2.87% | 3.16% | 34.99% | 29.19% | 28.84% |
| Interest Coverage | – | 0 | 8.67 | 4.75 | 6.90 |
| Asset Turnover | 0.58 | 0.70 | 0.69 | 0.72 | 0.68 |
| Fixed Asset Turnover | 4.93 | 6.16 | 6.89 | 7.12 | 7.06 |
| Dividend Yield | – | – | 0.21% | 0.26% | 0.23% |
Interpretation of Financial Ratios
The financial ratios for ESAB Corporation as of December 31, 2024, exhibit a mixed picture of the company’s financial health. The liquidity ratios, with a current ratio of 1.82 and a quick ratio of 1.18, indicate a solid ability to cover short-term liabilities. However, the solvency ratio of 0.15 raises concerns about long-term debt sustainability. Profitability metrics are relatively strong, with a net profit margin of 9.66% and an EBITDA margin of 19.39%, reflecting efficient operations. The company’s debt-to-equity ratio of 0.66 indicates moderate leverage, while the interest coverage ratio of 6.90 suggests it can comfortably handle interest obligations. Overall, while profitability appears strong, the solvency and liquidity aspects warrant closer monitoring.
Evolution of Financial Ratios
Over the past five years, ESAB’s financial ratios have shown improvement, particularly in profitability metrics, with net profit margins increasing from 8.63% in 2022 to 9.66% in 2024. However, the solvency ratios have fluctuated, highlighting potential long-term debt concerns that need ongoing attention.
Distribution Policy
ESAB Corporation currently pays a modest dividend of $0.281 per share, with a dividend payout ratio of approximately 6.4%. The annual dividend yield stands at 0.23%, indicating a conservative approach to returns. The company also engages in share buyback programs, which can enhance shareholder value. However, the low payout ratio suggests a focus on reinvesting profits for growth, which aligns with long-term value creation. Overall, this distribution strategy seems sustainable and supportive of shareholder interests.
Sector Analysis
ESAB Corporation operates in the metal fabrication manufacturing sector, providing advanced welding and cutting solutions. Its key products include consumables and equipment that position it competitively against industry leaders.
Strategic Positioning
ESAB Corporation holds a significant position in the metal fabrication industry, with a market cap of approximately 6.53B USD. The company’s key product offerings, including welding consumables and cutting equipment, have solidified its market share, particularly in sectors like construction and energy. Competitive pressure remains robust, as industry players continuously innovate and adapt to technological disruptions. ESAB’s focus on digital solutions and productivity-enhancing software positions it favorably against competitors, helping to mitigate risks associated with market fluctuations and evolving customer needs.
Revenue by Segment
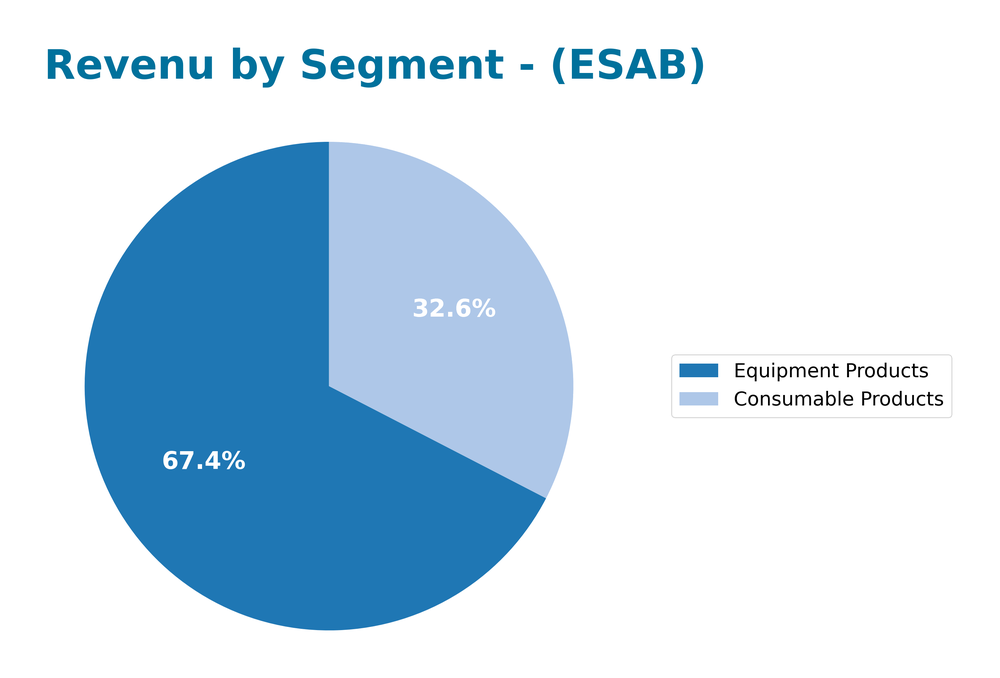
The following chart illustrates the revenue distribution by segment for ESAB Corporation from 2022 to 2024, highlighting trends in their business performance over these fiscal years.

In analyzing the revenue segments, we see consistent growth in “Consumable Products,” increasing from 741M in 2022 to 893M in 2024, signaling a strong demand for these products. Conversely, “Equipment Products” experienced a slight decline from 1.92B in 2023 to 1.85B in 2024, indicating potential market saturation or shifts in customer preferences. While the growth in consumables is encouraging, the slowdown in equipment sales raises concerns about margin risks and overall concentration in the product portfolio.
Key Products
Below is a table summarizing the key products offered by ESAB Corporation, which are essential for various applications in the metal fabrication industry.
| Product | Description |
|---|---|
| Welding Consumables | A comprehensive range including electrodes, cored and solid wires, and fluxes for various welding applications. |
| Cutting Consumables | Products such as electrodes, nozzles, shields, and tips designed for efficient cutting processes. |
| Portable Welding Machines | Versatile welding equipment ideal for on-site applications, providing both convenience and portability. |
| Automated Cutting Systems | Large-scale, customized systems for industrial applications that enhance productivity in high-volume environments. |
| Digital Software Solutions | Tools designed to optimize welding operations, including remote monitoring and documentation digitization. |
These products reflect ESAB’s commitment to innovation and efficiency in the metal fabrication sector, catering to a wide array of industries including construction, transportation, and energy.
Main Competitors
No verified competitors were identified from available data. However, I can provide insights into ESAB Corporation’s estimated market share and competitive position. ESAB operates in the Manufacturing – Metal Fabrication sector and is known for its extensive range of welding and cutting consumables and equipment. The company’s market presence is significant, particularly in North America, where it serves various industries, including construction, energy, and transportation.
Competitive Advantages
ESAB Corporation stands out in the metal fabrication industry due to its comprehensive product range and innovative solutions. With a focus on cutting, joining, and automated welding, the company leverages advanced technologies, including digital software for productivity enhancement. Looking ahead, ESAB is well-positioned to explore new markets and develop additional products, particularly in renewable energy and medical applications. These opportunities, combined with a strong brand presence and a commitment to customer service, solidify its competitive edge in a growing industry.
SWOT Analysis
The purpose of this SWOT analysis is to evaluate ESAB Corporation’s current position in the market and identify strategic directions for future growth.
Strengths
- Strong brand recognition
- Diverse product portfolio
- Advanced technology in welding solutions
Weaknesses
- Relatively high beta (1.195)
- Dependence on volatile raw materials
- Limited market presence in emerging economies
Opportunities
- Growing demand for automation in manufacturing
- Expansion into renewable energy sectors
- Digital transformation of welding solutions
Threats
- Intense competition in the metal fabrication industry
- Economic downturns affecting capital spending
- Regulatory challenges in manufacturing processes
Overall, ESAB Corporation’s strengths and opportunities present a solid foundation for growth. However, the company must address its weaknesses and be vigilant about external threats to effectively leverage its competitive position in the market.
Stock Analysis
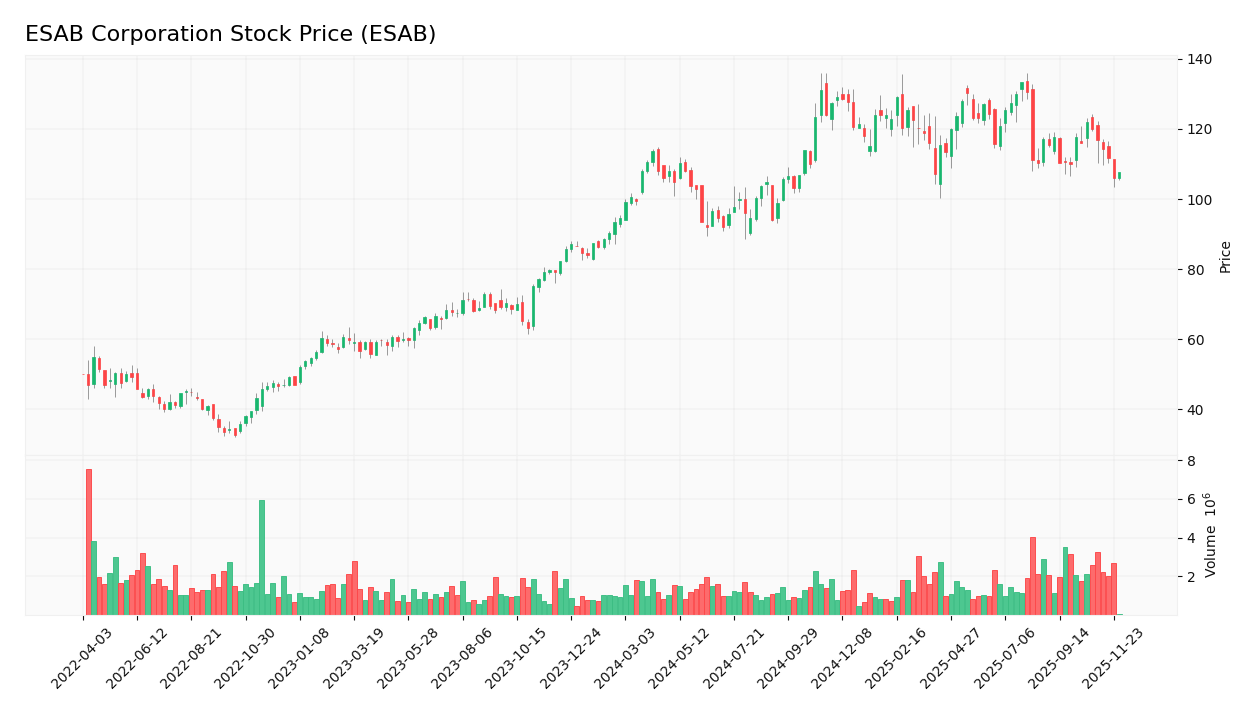
Over the past year, ESAB Corporation’s stock price has experienced significant fluctuations, culminating in a notable bullish trend despite recent volatility.

Trend Analysis
Analyzing the stock over the past two years, ESAB has shown a percentage change of +27.61%. This indicates a bullish trend overall, although it is worth noting that the trend has experienced deceleration recently, with a price change of -2.31% from September 14, 2025, to November 30, 2025. The stock reached a high of 133.28 and a low of 83.93, with a standard deviation of 12.54 signifying moderate volatility.
Volume Analysis
In terms of trading volumes over the last three months, total volume has reached 170.14M, with a buyer volume of 78.64M and a seller volume of 90.73M. The volume trend indicates increasing activity, although the recent period reflects a seller-dominant sentiment with only 28.36% of the volume being buyer-driven. This suggests that investor sentiment may be leaning towards caution as market participation remains elevated but skewed towards selling.
Analyst Opinions
Recent analyst recommendations for ESAB Corporation indicate a consensus rating of “Buy” for 2025, with a B- rating from several analysts. Notably, the overall score is 3, reflecting solid performance in return on assets (4) but weaker scores in debt-to-equity (1) and price-to-earnings (2). Analysts emphasize the company’s strong operational efficiency and potential for growth, though caution is advised due to its current debt levels. Investors should consider this balanced perspective when evaluating their investment in ESAB.
Stock Grades
The latest stock ratings for ESAB Corporation showcase a consistent outlook from reputable grading companies.
| Grading Company | Action | New Grade | Date |
|---|---|---|---|
| JP Morgan | Maintain | Overweight | 2025-10-30 |
| UBS | Maintain | Buy | 2025-10-20 |
| JP Morgan | Maintain | Overweight | 2025-10-14 |
| Loop Capital | Upgrade | Buy | 2025-08-22 |
| JP Morgan | Maintain | Overweight | 2025-08-07 |
| Stifel | Upgrade | Buy | 2025-08-07 |
| Oppenheimer | Maintain | Outperform | 2025-08-07 |
| Stifel | Maintain | Hold | 2025-07-21 |
| Evercore ISI Group | Maintain | In Line | 2025-05-19 |
| Stifel | Maintain | Hold | 2025-05-02 |
Overall, the trend in grades indicates a positive sentiment towards ESAB, with multiple upgrades to “Buy” and consistent “Overweight” ratings from JP Morgan, suggesting strong confidence in the stock’s performance moving forward.
Target Prices
The consensus target price for ESAB Corporation is positive, reflecting analysts’ expectations for the stock.
| Target High | Target Low | Consensus |
|---|---|---|
| 150 | 140 | 146.33 |
Analysts generally anticipate a favorable outlook for ESAB, with target prices indicating growth potential within this range.
Consumer Opinions
Consumer sentiment regarding ESAB Corporation showcases a mixed bag of experiences, reflecting both commendable strengths and notable weaknesses.
| Positive Reviews | Negative Reviews |
|---|---|
| “Excellent product quality and durability.” | “Customer service is slow to respond.” |
| “Innovative solutions that meet our needs.” | “Higher pricing compared to competitors.” |
| “Dependable and efficient equipment.” | “Occasional issues with product availability.” |
Overall, consumer feedback suggests that while ESAB Corporation is praised for its high-quality products and innovative solutions, it faces criticism regarding customer service responsiveness and pricing competitiveness.
Risk Analysis
Understanding the potential risks associated with investing in ESAB Corporation is crucial for making informed decisions. Below is a table summarizing key risks:
| Category | Description | Probability | Impact |
|---|---|---|---|
| Market Volatility | Fluctuations in the market can affect stock prices. | High | High |
| Supply Chain Disruptions | Global supply chain issues may impact production. | Medium | High |
| Regulatory Changes | New regulations may increase operational costs. | Medium | Medium |
| Competition | Increased competition can pressure margins. | High | Medium |
| Economic Downturn | Economic slowdown can reduce demand for products. | Medium | High |
In my analysis, market volatility and supply chain disruptions stand out as the most likely and impactful risks for ESAB, particularly given the current economic climate.
Should You Buy ESAB Corporation?
ESAB Corporation has displayed a positive net margin of 9.66%, indicating profitability. The company is carrying a significant total debt of 1.16B, which represents a debt-to-equity ratio of 0.6576. Overall, the company’s fundamentals have shown positive evolution with a recent revenue increase of 9.27% year-over-year, and it holds a rating of B-.
Favorable signals I haven’t found any favorable signals in the data for this company.
Unfavorable signals The total debt of 1.16B indicates a high debt level, which may pose a risk. Additionally, recent seller volume has exceeded buyer volume, suggesting that the stock is under selling pressure.
Conclusion Given the unfavorable signals, it might be more prudent to wait for more positive indicators before considering an investment in ESAB Corporation.
Disclaimer: This article is not financial advice. Each investor is responsible for their own investment decisions.
Additional Resources
- Universal Beteiligungs und Servicegesellschaft mbH Has $5.47 Million Stock Holdings in ESAB Corporation $ESAB – MarketBeat (Nov 23, 2025)
- Estimating The Intrinsic Value Of ESAB Corporation (NYSE:ESAB) – Yahoo Finance (Oct 30, 2025)
- ESAB Corporation Announces Third Quarter 2025 Results – Business Wire (Oct 29, 2025)
- ESAB Corporation (NYSE:ESAB) Elevates Industrial Productivity – Kalkine Media (Nov 10, 2025)
- ESAB Corporation: Visible Path For Accelerated Growth And Margin Expansion (Rating Upgrade) – Seeking Alpha (Nov 03, 2025)
For more information about ESAB Corporation, please visit the official website: esab.com


