In the rapidly evolving world of technology, semiconductor giants QUALCOMM Incorporated (QCOM) and Arm Holdings plc (ARM) stand out for their innovative contributions. Both companies are pivotal in shaping the future of wireless and computing technologies, operating within the same industry and overlapping in market focus. QUALCOMM excels in wireless communication technologies, while Arm specializes in CPU architecture and licensing. This analysis will help you determine which company presents the most compelling investment opportunity.
Table of contents
Company Overview
QUALCOMM Overview
QUALCOMM Incorporated, founded in 1985 and headquartered in San Diego, California, is a leading player in the semiconductor industry, primarily focused on wireless technology. The company operates through three main segments: Qualcomm CDMA Technologies (QCT), Qualcomm Technology Licensing (QTL), and Qualcomm Strategic Initiatives (QSI). QCT develops integrated circuits for 3G, 4G, and 5G technologies, while QTL monetizes its extensive patent portfolio by licensing intellectual property crucial for wireless product manufacturing. QSI invests in early-stage companies across various sectors, including AI and IoT, enhancing its innovation pipeline. With a market capitalization of approximately $175B, QUALCOMM is positioned as a key enabler of mobile communication globally.
Arm Holdings Overview
Arm Holdings plc, founded in 1990 and headquartered in Cambridge, UK, specializes in designing and licensing CPU architectures and related technologies. The company provides microprocessors, graphics processing units, and software tools that are essential for semiconductor manufacturers and original equipment manufacturers (OEMs). Arm’s technologies serve diverse markets such as automotive, consumer electronics, and IoT. As a subsidiary of Kronos II LLC, Arm has a robust market capitalization of around $139B and plays a significant role in the global semiconductor ecosystem.
Key Similarities and Differences
Both QUALCOMM and Arm Holdings operate within the semiconductor industry, focusing on foundational technologies that drive wireless and computing products. However, QUALCOMM has a more diversified business model that includes significant licensing revenues and direct chip manufacturing, while Arm primarily relies on licensing its CPU designs to third parties, positioning itself as an architectural innovator rather than a manufacturer. This distinction shapes their respective market strategies and revenue models, presenting different investment profiles.
Income Statement Comparison
The following table presents a comparison of key income statement metrics for QUALCOMM Incorporated (QCOM) and Arm Holdings plc (ARM) for their most recent fiscal years.
| Metric | QCOM | ARM |
|---|---|---|
| Revenue | 44.28B | 4.01B |
| EBITDA | 14.93B | 902M |
| EBIT | 13.33B | 720M |
| Net Income | 5.54B | 792M |
| EPS | 5.06 | 0.75 |
Interpretation of Income Statement
In the latest fiscal year, QUALCOMM demonstrated significant growth, with revenue increasing from 38.96B in 2024 to 44.28B in 2025, indicating robust demand for its products. Conversely, Arm Holdings showed a substantial increase in revenue as well, from 3.23B to 4.01B, reflecting a positive growth trajectory. Both companies maintained stable or improved margins, with QCOM’s EBITDA margin remaining strong despite economic pressures. However, I noted that QCOM’s net income decreased from 10.14B to 5.54B, which may raise concerns about profitability sustainability going forward. Meanwhile, ARM’s net income growth to 792M signals improving profitability.
Financial Ratios Comparison
In the following table, I present a comparative analysis of key financial ratios for Qualcomm Incorporated (QCOM) and Arm Holdings plc (ARM) based on the most recent available data for fiscal year 2025.
| Metric | QCOM | ARM |
|---|---|---|
| ROE | 26.13% | 11.58% |
| ROIC | 13.19% | 11.31% |
| P/E | 32.70 | 141.58 |
| P/B | 8.54 | 16.40 |
| Current Ratio | 2.82 | 5.20 |
| Quick Ratio | 2.10 | 5.20 |
| D/E | 0.70 | 0.05 |
| Debt-to-Assets | 29.54% | 3.99% |
| Interest Coverage | 18.61 | – |
| Asset Turnover | 0.88 | 0.45 |
| Fixed Asset Turnover | 9.44 | 5.61 |
| Payout ratio | 68.67% | 0% |
| Dividend yield | 2.10% | 0% |
Interpretation of Financial Ratios
Qualcomm exhibits strong profitability with a high ROE and ROIC, indicating effective capital use. Conversely, Arm’s significantly higher P/E ratio suggests market expectations for future growth but comes with potential valuation concerns. Qualcomm’s lower debt metrics and higher current ratios reflect stronger financial stability. However, Arm demonstrates impressive liquidity, indicating it can cover short-term obligations easily. Investors should weigh Qualcomm’s stability against Arm’s growth potential, keeping in mind the associated risks.
Dividend and Shareholder Returns
QUALCOMM (QCOM) actively pays dividends, with a yield of 2.1% and a payout ratio of 68.7% in 2025. The dividend per share has shown a consistent trend, supported by robust free cash flow, although caution is warranted regarding sustainability if earnings falter. In contrast, Arm Holdings (ARM) does not pay dividends, opting instead to reinvest in growth and R&D, which may align with long-term shareholder value creation. However, ARM is also engaging in share buybacks. Overall, QCOM’s dividends indicate a commitment to returning value, while ARM’s strategy reflects a focus on future growth.
Strategic Positioning
QUALCOMM (QCOM) and Arm Holdings (ARM) operate in the highly competitive semiconductor industry, each holding significant market share in their respective segments. QCOM focuses on wireless technologies, commanding a strong position with its diverse product range and substantial market cap of $175B. Meanwhile, ARM, valued at approximately $139B, specializes in CPU architectures, facing increased competitive pressure amid technological disruptions like AI and IoT. Both companies are poised to adapt and innovate, ensuring they maintain relevance in a rapidly evolving market.
Stock Comparison
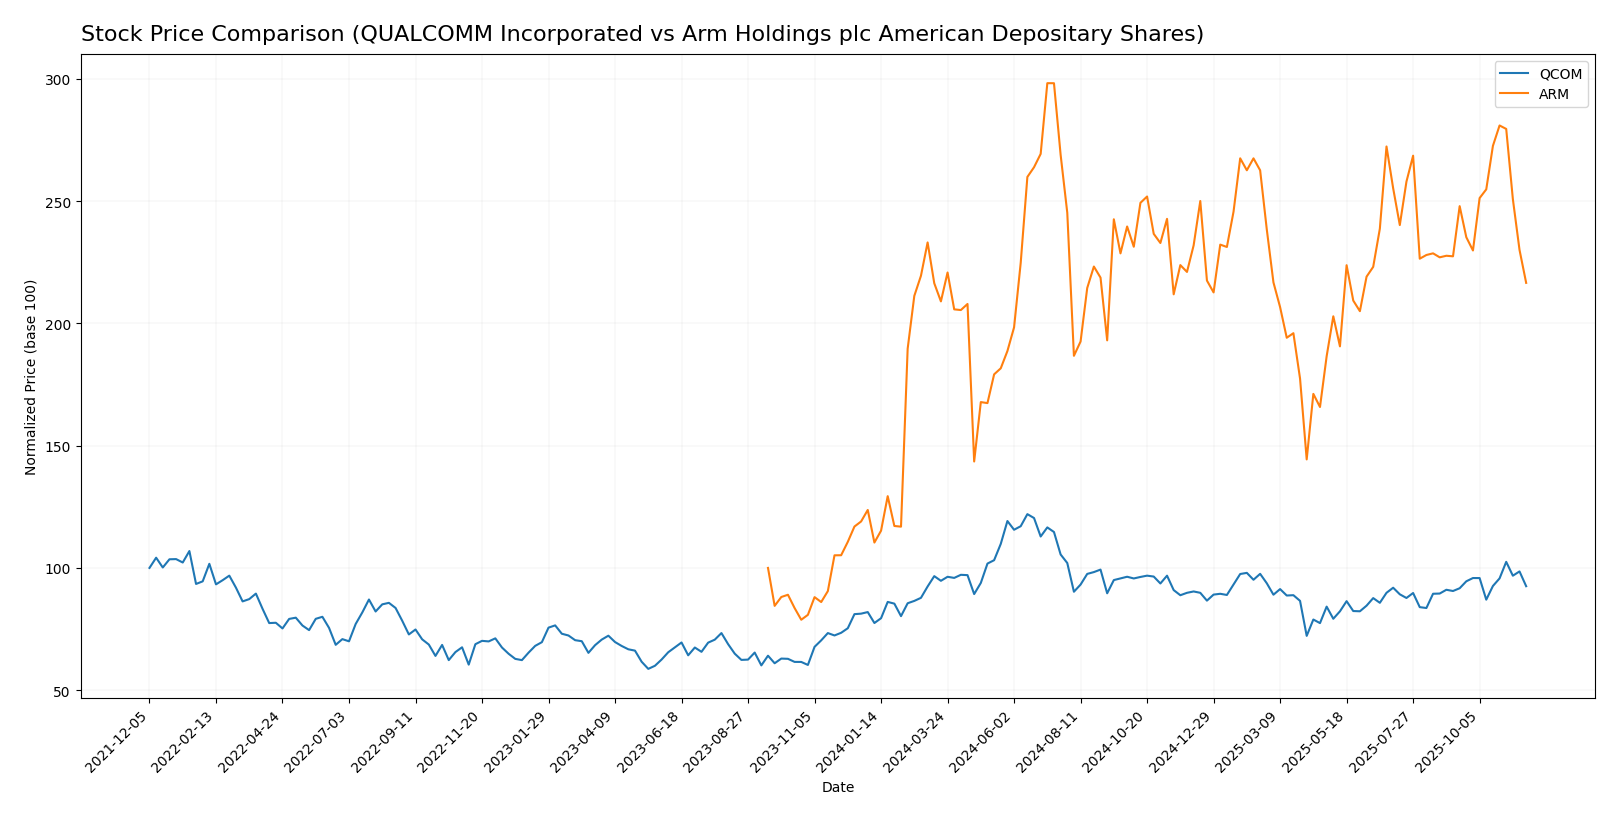
In analyzing the stock price movements of QUALCOMM Incorporated (QCOM) and Arm Holdings plc (ARM) over the past year, we observe significant trading dynamics that reflect differing investor sentiments and market conditions.
Trend Analysis
QUALCOMM Incorporated (QCOM) has shown a price change of +12.91% over the past year, indicating a bullish trend. The stock has experienced notable highs at 215.33 and lows at 127.46, with an acceleration in its upward movement. The recent trend analysis reveals a slight increase of +2.16% from September 7, 2025, to November 23, 2025, with a standard deviation of 6.8, suggesting some volatility but overall maintaining a positive trajectory.
Arm Holdings plc (ARM) has outperformed with a remarkable price change of +75.08% over the past year, also reflecting a bullish trend. The stock’s highest price reached 181.19, while the lowest was 67.05. However, in the recent period from September 7, 2025, to November 23, 2025, it has seen a decline of -4.78%, indicating a shift in momentum. The standard deviation during this period is 12.37, suggesting increased volatility.
In summary, while both stocks have shown bullish trends over the longer term, ARM has recently faced a downturn, contrasting with QCOM’s stable upward movement.
Analyst Opinions
Recent analyst recommendations for QUALCOMM Incorporated (QCOM) indicate a “Buy” rating from several analysts, including a B+ from notable sources, emphasizing strong return on equity and assets. In contrast, Arm Holdings plc (ARM) received a “Hold” rating, rated B- overall, with analysts citing concerns around its price-to-earnings metrics and growth potential. The consensus for QCOM suggests a bullish outlook for 2025, while ARM appears more cautious, leaning towards a hold strategy.
Stock Grades
In today’s analysis, I will present the latest stock grades for QUALCOMM Incorporated (QCOM) and Arm Holdings plc (ARM), based on reliable data from recognized grading companies.
QUALCOMM Incorporated Grades
| Grading Company | Action | New Grade | Date |
|---|---|---|---|
| B of A Securities | maintain | Buy | 2025-11-06 |
| Piper Sandler | maintain | Overweight | 2025-11-06 |
| Wells Fargo | maintain | Underweight | 2025-11-06 |
| UBS | maintain | Neutral | 2025-11-06 |
| Rosenblatt | maintain | Buy | 2025-11-06 |
| Mizuho | maintain | Outperform | 2025-11-06 |
| JP Morgan | maintain | Overweight | 2025-11-04 |
| Rosenblatt | maintain | Buy | 2025-10-28 |
| Citigroup | maintain | Neutral | 2025-10-28 |
| UBS | maintain | Neutral | 2025-10-27 |
Arm Holdings plc Grades
| Grading Company | Action | New Grade | Date |
|---|---|---|---|
| Loop Capital | maintain | Buy | 2025-11-12 |
| Needham | maintain | Hold | 2025-11-06 |
| Wells Fargo | maintain | Overweight | 2025-11-06 |
| Keybanc | maintain | Overweight | 2025-11-06 |
| Benchmark | maintain | Hold | 2025-11-06 |
| UBS | maintain | Buy | 2025-11-06 |
| Mizuho | maintain | Outperform | 2025-11-06 |
| Barclays | maintain | Overweight | 2025-11-06 |
| TD Cowen | maintain | Buy | 2025-11-06 |
| Rosenblatt | maintain | Buy | 2025-11-06 |
Overall, both QCOM and ARM are receiving consistent ratings from multiple analysts, indicating a generally positive outlook, especially for ARM, which has a majority of “Buy” ratings. However, caution is warranted with QCOM, given its mixed reviews, particularly from Wells Fargo.
Target Prices
Analysts have provided reliable target prices for both QUALCOMM Incorporated (QCOM) and Arm Holdings plc (ARM).
| Company | Target High | Target Low | Consensus |
|---|---|---|---|
| QUALCOMM | 210 | 165 | 190 |
| Arm Holdings | 210 | 190 | 200 |
For QUALCOMM, the consensus target price of 190 suggests a potential upside from its current price of 163.3, while Arm’s consensus of 200 indicates a healthy outlook compared to its current price of 131.57. Overall, analysts are optimistic about both companies in the semiconductor sector.
Strengths and Weaknesses
The following table summarizes the strengths and weaknesses of QUALCOMM Incorporated (QCOM) and Arm Holdings plc (ARM) based on the most recent data.
| Criterion | QUALCOMM (QCOM) | Arm Holdings (ARM) |
|---|---|---|
| Diversification | High | Moderate |
| Profitability | Strong (12.51%) | Moderate (19.77%) |
| Innovation | Strong | High |
| Global presence | Extensive | Moderate |
| Market Share | Significant | Emerging |
| Debt level | Manageable (29.54%) | Low (3.99%) |
Key takeaways: QUALCOMM demonstrates strong diversification and global presence despite a moderate debt level, while Arm Holdings excels in innovation and profitability with minimal debt. Each company has unique strengths to consider for investment.
Risk Analysis
In the following table, I present a concise overview of the key risks associated with Qualcomm (QCOM) and Arm Holdings (ARM).
| Metric | Qualcomm (QCOM) | Arm Holdings (ARM) |
|---|---|---|
| Market Risk | Moderate | High |
| Regulatory Risk | Low | Moderate |
| Operational Risk | Moderate | High |
| Environmental Risk | Low | Low |
| Geopolitical Risk | Moderate | High |
Both companies face significant market and operational risks, particularly Arm, given its higher exposure to volatile tech sectors and geopolitical tensions. The semiconductor industry is currently under scrutiny for regulatory compliance, which could impact operations.
Which one to choose?
When comparing QUALCOMM Incorporated (QCOM) and Arm Holdings plc (ARM), QCOM appears to be the more stable choice for investors. It boasts a solid market cap of approximately 181B and a B+ rating, with favorable profit margins and a consistent revenue stream with a recent bullish stock trend showing a 12.91% price change. In contrast, ARM, with a market cap of around 112B, has experienced a remarkable price increase of 75.08% but carries a B- rating and higher valuations, evidenced by a P/E ratio of 141.58, indicating potential overvaluation.
For growth-focused investors, ARM may seem attractive due to its rapid price escalation; however, those prioritizing stability and lower risk may prefer QCOM given its robust fundamentals and lower debt levels.
Specific risks include market dependence for both companies and ARM’s potential overvaluation in a volatile tech landscape.
Disclaimer: This article is not financial advice. Each investor is responsible for their own investment decisions.
Go further
I encourage you to read the complete analyses of QUALCOMM Incorporated and Arm Holdings plc American Depositary Shares to enhance your investment decisions: