Fortinet, Inc. is not just a player in the cybersecurity landscape; it’s a force shaping how businesses protect their digital assets and maintain trust in an increasingly connected world. With its innovative FortiGate solutions and a robust portfolio that spans secure networking, endpoint protection, and threat intelligence, Fortinet stands out as a leader in the Software – Infrastructure sector. As we delve into this analysis, I invite you to consider whether the company’s fundamentals still justify its current market valuation and growth potential amidst evolving industry challenges.
Table of contents
Company Description
Fortinet, Inc. is a prominent player in the cybersecurity sector, specializing in integrated and automated security solutions. Founded in 2000 and headquartered in Sunnyvale, California, the company serves a wide range of markets across the Americas, Europe, the Middle East, Africa, and the Asia Pacific. Fortinet’s product portfolio includes FortiGate hardware and software, offering advanced firewall and intrusion prevention services, as well as a variety of networking and security solutions like FortiAP and FortiWeb. With a market capitalization of approximately $60.5B, Fortinet stands as a leader in the Software – Infrastructure industry, consistently driving innovation and shaping the future of cybersecurity through its robust ecosystem and commitment to secure digital experiences.
Fundamental Analysis
This section will provide an analysis of Fortinet, Inc.’s income statement, financial ratios, and dividend payout policy to assess its financial health and investment potential.
Income Statement
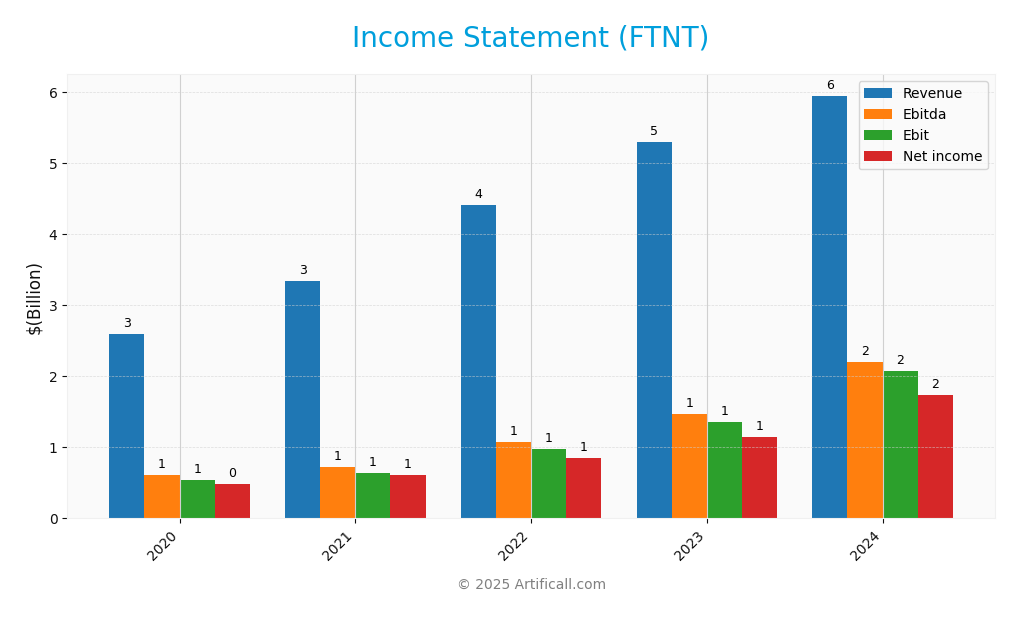
Below is the income statement for Fortinet, Inc. (FTNT), detailing the company’s performance over recent fiscal years.
| Income Statement | 2020 | 2021 | 2022 | 2023 | 2024 |
|---|---|---|---|---|---|
| Revenue | 2.59B | 3.34B | 4.42B | 5.30B | 5.96B |
| Cost of Revenue | 570M | 783M | 1.08B | 1.24B | 1.16B |
| Operating Expenses | 1.49B | 1.91B | 2.36B | 2.83B | 2.99B |
| Gross Profit | 2.02B | 2.56B | 3.33B | 4.07B | 4.80B |
| EBITDA | 610M | 728M | 1.08B | 1.47B | 2.20B |
| EBIT | 542M | 643M | 974M | 1.35B | 2.08B |
| Interest Expense | 0 | 15M | 18M | 21M | 20M |
| Net Income | 489M | 607M | 857M | 1.15B | 1.75B |
| EPS | 0.60 | 0.74 | 1.08 | 1.47 | 2.28 |
| Filing Date | 2021-02-19 | 2022-02-25 | 2023-02-24 | 2024-02-26 | 2025-02-21 |
Over the past five years, Fortinet has demonstrated a consistent upward trajectory in both revenue and net income. Revenue surged from 2.59B in 2020 to 5.96B in 2024, reflecting strong market demand for cybersecurity solutions. Net income followed suit, rising from 489M to 1.75B, indicating improved profitability. Notably, the gross profit margin has remained stable, enhancing overall financial health. In 2024, growth continued, though at a slightly slower pace than previous years, suggesting the company is maturing in its market segment.
Financial Ratios
The table below summarizes the key financial ratios for Fortinet, Inc. (FTNT) over the past five years.
| Financial Ratios | 2020 | 2021 | 2022 | 2023 | 2024 |
|---|---|---|---|---|---|
| Net Margin | 18.83% | 18.16% | 19.41% | 21.64% | 29.30% |
| ROE | 57.07% | 77.63% | -30.44% | -247.69% | 116.83% |
| ROIC | 21.65% | 17.65% | 29.72% | 31.16% | 27.05% |
| WACC | 6.00% | 6.00% | 6.00% | 6.00% | 6.00% |
| P/E | 49.93 | 96.66 | 45.13 | 39.70 | 41.38 |
| P/B | 28.50 | 75.03 | -137.40 | -98.34 | 48.35 |
| Current Ratio | 1.50 | 1.55 | 1.24 | 1.19 | 1.47 |
| Quick Ratio | 1.42 | 1.48 | 1.15 | 1.06 | 1.39 |
| D/E | 0.00 | 1.26 | -3.52 | -2.14 | 0.67 |
| Debt-to-Assets | 0.00 | 0.17 | 0.16 | 0.14 | 0.10 |
| Interest Coverage | 0.00 | 43.65 | 53.87 | 59.10 | 90.17 |
| Asset Turnover | 0.64 | 0.56 | 0.71 | 0.73 | 0.61 |
| Fixed Asset Turnover | 5.79 | 4.86 | 4.92 | 5.08 | 4.41 |
| Dividend Yield | 0.00% | 0.00% | 0.00% | 0.00% | 0.00% |
Interpretation of Financial Ratios
In 2024, Fortinet’s financial ratios indicate strong performance, particularly with a net margin of 29.30% and a return on equity (ROE) of 116.83%. However, the negative values for ROE in previous years raise concerns about financial stability. The current ratio of 1.47 shows healthy liquidity, although the high P/E ratio suggests that the stock may be overvalued.
Evolution of Financial Ratios
Over the past five years, Fortinet’s financial ratios have shown significant improvement, especially in net margin and ROE. While there were fluctuations in the past, the latest year reflects a recovery and strengthening of profitability, although concerns remain regarding its valuation metrics.
Distribution Policy
Fortinet, Inc. (FTNT) does not currently pay dividends, reflecting its focus on reinvestment to fuel growth and innovation. The company’s strategy prioritizes research and development, with its capital allocated towards expanding market share rather than returning cash to shareholders. Additionally, Fortinet engages in share buybacks, which can enhance shareholder value over time. This approach aligns with long-term value creation, provided that investments lead to sustainable revenue growth.
Sector Analysis
Fortinet, Inc. operates in the Software – Infrastructure industry, providing a comprehensive range of cybersecurity solutions, including hardware, software, and services, to various sectors worldwide.
Strategic Positioning
Fortinet, Inc. (FTNT) holds a significant position within the cybersecurity market, boasting a market cap of approximately $60.5B. The company excels in providing integrated cybersecurity solutions, particularly with its FortiGate product line, which delivers multiple security functions. However, competitive pressure from industry peers continues to rise, as new entrants and established players innovate rapidly. The ongoing technological disruption, particularly in cloud security and AI-driven solutions, necessitates that Fortinet continuously adapts its offerings to maintain its market share and relevance. Overall, while Fortinet is well-positioned, vigilance in monitoring competitive dynamics and technological advancements is crucial for sustained growth.
Revenue by Segment
The following pie chart illustrates Fortinet, Inc.’s revenue by segment for the fiscal year 2024, showcasing key areas contributing to their overall financial performance.
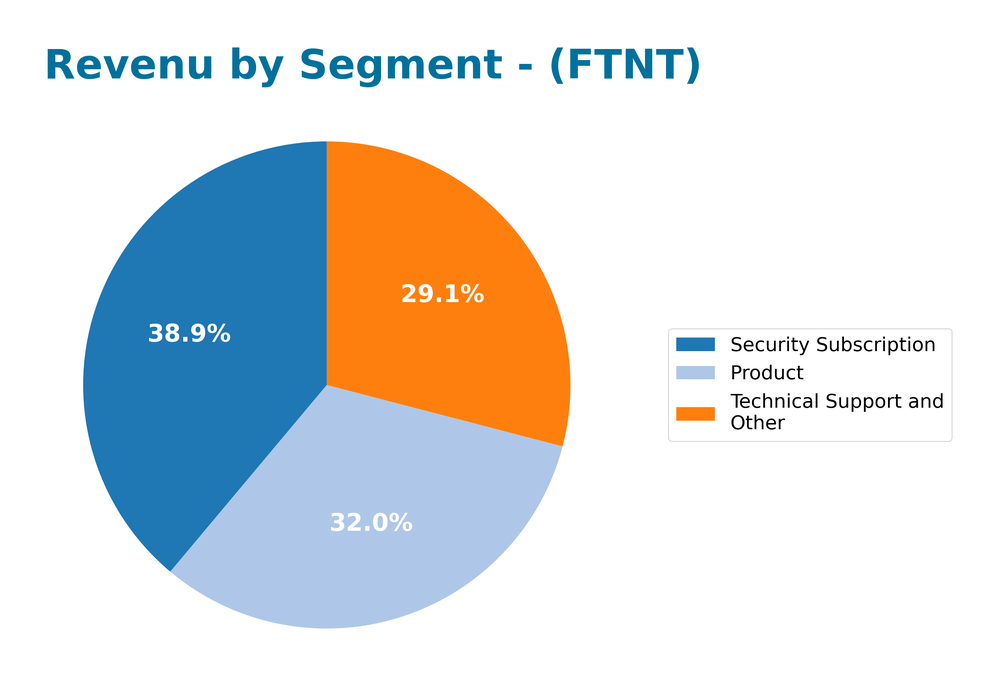
In FY 2024, Fortinet’s revenue segments displayed a robust performance, with “Security Subscription” leading at 2.32B, followed closely by “Product” at 1.91B and “Technical Support and Other” at 1.73B. The “Security Subscription” segment has shown a notable increase, indicating a strategic shift towards recurring revenue models, which can enhance stability. However, the “Product” revenue decreased slightly from the previous year, reflecting potential market saturation or competitive pressures. Overall, while the company continues to grow, the deceleration in product sales highlights potential concentration risks that investors should monitor closely.
Key Products
Below is a table summarizing the key products offered by Fortinet, Inc., which plays a crucial role in providing comprehensive cybersecurity solutions.
| Product | Description |
|---|---|
| FortiGate | A next-generation firewall that integrates multiple security functions such as intrusion prevention and anti-malware. |
| FortiSwitch | A family of secure switching solutions that connect end devices while ensuring robust network security. |
| FortiAP | Offers secure wireless networking solutions complementing FortiGate’s security features. |
| FortiMail | A secure email gateway that protects against phishing and malware threats. |
| FortiWeb | Web application firewall solutions designed to protect web applications from attacks. |
| FortiClient | Endpoint protection software that includes anti-malware, behavior-based exploit protection, and application firewall. |
| FortiSandbox | Provides proactive detection and mitigation services against advanced threats. |
| FortiManager | Centralized management solution for FortiGate products, enabling scalable security management. |
| FortiAnalyzer | Offers centralized network logging, analyzing, and reporting capabilities to enhance visibility and response. |
| FortiToken | Multi-factor authentication solutions to safeguard systems and sensitive data. |
| FortiAuthenticator | Provides identity and access management solutions for secure access control. |
| FortiEDR/XDR | An advanced endpoint protection solution that combines machine learning anti-malware with real-time post-infection protection. |
These products collectively enhance the security posture of organizations across various industries, making Fortinet a formidable player in the cybersecurity sector.
Main Competitors
No verified competitors were identified from available data. Fortinet, Inc. holds a significant position in the cybersecurity software sector, with an estimated market share of approximately 5% in the global market. The company is recognized for its broad range of security solutions, making it a key player in the industry.
Competitive Advantages
Fortinet, Inc. (FTNT) boasts significant competitive advantages in the cybersecurity sector, driven by its comprehensive suite of integrated solutions and robust market presence. The company’s strong reputation for innovation, particularly with its FortiGate and FortiWeb product families, positions it well in an increasingly digital landscape where security is paramount. With plans to expand into emerging markets and develop new products, Fortinet is poised to capitalize on growth opportunities, particularly in sectors like healthcare and financial services. This strategic focus on technology advancement and market penetration enhances its long-term outlook.
SWOT Analysis
This SWOT analysis provides an overview of Fortinet, Inc.’s strategic position in the cybersecurity industry.
Strengths
- Strong brand recognition
- Comprehensive product portfolio
- Robust financial performance
Weaknesses
- High dependence on North American market
- Limited diversification in services
- Relatively high pricing
Opportunities
- Growing cybersecurity demand
- Expanding into emerging markets
- Increasing cloud adoption
Threats
- Intense competition
- Rapid technological changes
- Regulatory challenges
The overall SWOT assessment indicates that while Fortinet has strong market positioning and opportunities for growth, it must address its weaknesses and external threats to enhance its competitive edge and sustain long-term success.
Stock Analysis
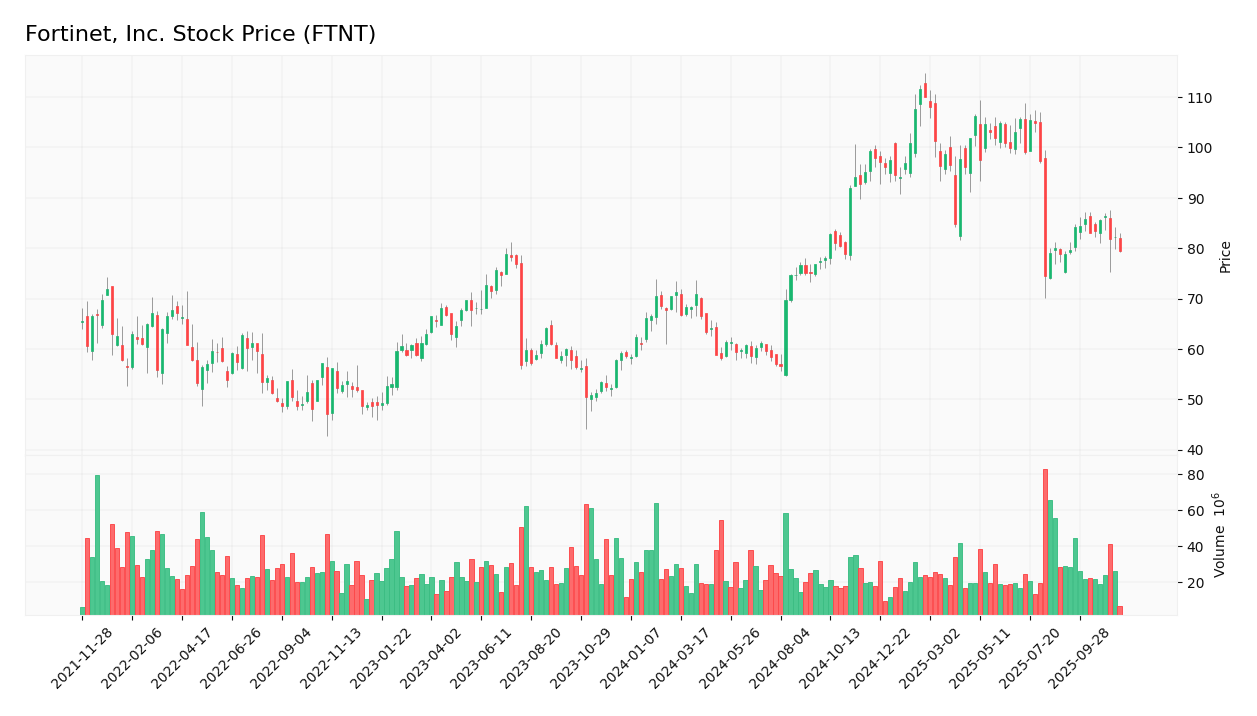
Over the past year, Fortinet, Inc. (ticker: FTNT) has exhibited notable price movements, with a significant shift that reflects the stock’s trading dynamics.
Trend Analysis
Analyzing FTNT’s performance over the last 12 months, the stock has experienced a price change of +35.58%. This indicates a bullish trend overall, despite a recent trend change of just +0.66% from September 7, 2025, to November 23, 2025. The stock has seen its highest price at 111.64 and its lowest at 56.51, showcasing a standard deviation of 16.18, which indicates volatility in its price movements. The overall trend demonstrates deceleration, suggesting that while the stock remains bullish, the rate of price increase is slowing down.
Volume Analysis
In the last three months, the total trading volume for FTNT has reached approximately 3.27B shares, with a majority being buyer-driven at 52.07% (1.70B shares). However, the overall volume trend is decreasing, which may signal a waning interest among investors. In the recent period, from September 7 to November 23, the buyer volume surged to 240.49M shares compared to only 70.44M shares sold, reflecting a strongly buyer-dominant sentiment with a buyer dominance percentage of 77.35%. This suggests that while overall activity is decreasing, there is still significant engagement from buyers in the market.
Analyst Opinions
Recent analyst recommendations for Fortinet, Inc. (FTNT) indicate a consensus rating of “Buy.” Analysts highlight the company’s strong return on equity (5) and return on assets (5), reflecting robust operational efficiency. The discounted cash flow score (4) suggests solid future cash generation potential. However, the price-to-earnings (2) and price-to-book (1) scores indicate some caution regarding valuation. Notable analysts, including those from major investment firms, emphasize that while FTNT presents attractive growth prospects, investors should remain vigilant about market volatility.
Stock Grades
Fortinet, Inc. (FTNT) has received various grades from recognized grading companies, reflecting a consensus on its current standing in the market.
| Grading Company | Action | New Grade | Date |
|---|---|---|---|
| JP Morgan | Maintain | Neutral | 2025-11-06 |
| Rosenblatt | Maintain | Neutral | 2025-11-06 |
| Mizuho | Maintain | Underperform | 2025-11-06 |
| Baird | Maintain | Neutral | 2025-11-06 |
| Barclays | Maintain | Equal Weight | 2025-11-06 |
| UBS | Maintain | Neutral | 2025-11-06 |
| TD Cowen | Maintain | Hold | 2025-11-06 |
| RBC Capital | Maintain | Sector Perform | 2025-11-06 |
| Jefferies | Maintain | Hold | 2025-11-06 |
| Piper Sandler | Maintain | Neutral | 2025-11-06 |
Overall, the trend in grades indicates a stable outlook, with many analysts maintaining their previous ratings. Notably, while most grades remain neutral, Mizuho’s stance as “Underperform” suggests caution, indicating potential challenges ahead for Fortinet.
Target Prices
The consensus target price for Fortinet, Inc. (FTNT) indicates a positive outlook among analysts.
| Target High | Target Low | Consensus |
|---|---|---|
| 110 | 67 | 88.5 |
Overall, analysts expect Fortinet’s stock to reach a consensus price of 88.5, reflecting a favorable sentiment in the market.
Consumer Opinions
Consumer sentiment surrounding Fortinet, Inc. (FTNT) reflects a mix of appreciation for its cybersecurity solutions and concerns about its pricing structure.
| Positive Reviews | Negative Reviews |
|---|---|
| “Fortinet’s products are top-notch and reliable for our security needs.” | “The pricing is a bit steep compared to competitors.” |
| “Great customer support and easy implementation.” | “Updates can be slow at times, causing disruptions.” |
| “I love the user-friendly interface of their software.” | “Some features feel outdated and need improvement.” |
Overall, consumer feedback indicates strong satisfaction with Fortinet’s product reliability and customer support, while pricing and software updates are common areas of concern.
Risk Analysis
In evaluating Fortinet, Inc. (FTNT), it’s essential to consider the various risks that could impact its performance.
| Category | Description | Probability | Impact |
|---|---|---|---|
| Market Risk | Fluctuations in demand for cybersecurity services. | High | High |
| Regulatory Risk | Changes in cybersecurity regulations and compliance. | Medium | High |
| Technology Risk | Rapid technological changes may outpace innovation. | High | Medium |
| Competitive Risk | Increased competition from other cybersecurity firms. | High | High |
| Economic Risk | Global economic downturn affecting IT budgets. | Medium | Medium |
Given the current climate, market and competitive risks are particularly pronounced, with demand for cybersecurity services remaining critical amid increasing threats.
Should You Buy Fortinet, Inc.?
Fortinet, Inc. exhibits a positive net margin of 29.3%, indicating strong profitability. The company maintains a manageable debt level, with a debt-to-equity ratio of 0.67, reflecting reasonable financial leverage. Over time, Fortinet has shown consistent growth in key fundamentals, and it currently holds a rating of B+.
Given the positive net margin, a return on invested capital (ROIC) of 27.05% that exceeds the weighted average cost of capital (WACC) of 8.8%, and a long-term bullish trend in performance, Fortinet appears favorable for long-term investors. Additionally, the recent buyer volume surpasses seller volume, suggesting a demand for the stock.
A. Favorable signals The company has a positive net margin of 29.3%, which signals strong profitability. Furthermore, the ROIC of 27.05% exceeds the WACC of 8.8%, indicating effective value creation. The stock has demonstrated a long-term bullish trend, which may attract long-term investors. Lastly, the recent buyer volume significantly exceeds seller volume, showing strong buyer interest.
B. Unfavorable signals There are no unfavorable signals.
C. Conclusion Based on these factors, Fortinet might be considered an attractive option for long-term investors, given its strong financial metrics and positive market signals.
However, the high price-to-earnings ratio (PER) of 41.38 indicates that the stock is overvalued, although strong growth in net income may partially justify this valuation.
The primary risks include its elevated valuation, potential market volatility, and competitive pressures in the cybersecurity sector.
Disclaimer: This article is not financial advice. Each investor is responsible for their own investment decisions.
Additional Resources
- Integrated Quantitative Investments LLC Acquires New Stake in Fortinet, Inc. $FTNT – MarketBeat (Nov 18, 2025)
- Fortinet (NASDAQ: FTNT) joins Crime Stoppers on Cybercrime Bounty using anonymous tips – Stock Titan (Nov 18, 2025)
- Portnoy Law Firm Announces Class Action on Behalf of Fortinet, Inc. Investors – GlobeNewswire (Nov 18, 2025)
- FTNT LAWSUIT ALERT: The Gross Law Firm Notifies Fortinet, Inc. Investors of a Class Action Lawsuit and Upcoming Deadline – Morningstar (Nov 17, 2025)
- Rockefeller Capital Management L.P. Purchases 19,920 Shares of Fortinet, Inc. $FTNT – MarketBeat (Nov 18, 2025)
For more information about Fortinet, Inc., please visit the official website: fortinet.com


