In a world increasingly driven by data, Palantir Technologies Inc. stands at the forefront, shaping how organizations harness information to make critical decisions. Renowned for its innovative software platforms like Palantir Gotham and Foundry, the company empowers both government agencies and private enterprises to navigate complex datasets and respond to real-world challenges. As I delve into Palantir’s current market position and growth potential, I wonder if its robust fundamentals still support its lofty valuation in a rapidly evolving tech landscape.

Table of contents
Company Description
Palantir Technologies Inc. is a leading software company specializing in data integration and analysis, founded in 2003 and headquartered in Denver, Colorado. The firm operates primarily within the software infrastructure industry, offering innovative platforms such as Palantir Gotham for intelligence and defense applications, Palantir Foundry for organizational data management, and Palantir Apollo for software delivery and deployment. With a market capitalization of approximately $390B, Palantir plays a crucial role in shaping data-driven decision-making across various sectors, including government and commercial industries. As a pioneer in utilizing artificial intelligence and advanced analytics, Palantir is strategically positioned to influence the future of data operations and security in a rapidly evolving technological landscape.
Fundamental Analysis
In this section, I will conduct a fundamental analysis of Palantir Technologies Inc., covering its income statement, financial ratios, and dividend payout policy.
Income Statement
The following table illustrates the income statement for Palantir Technologies Inc. (PLTR) over the past five fiscal years, highlighting key financial metrics for your evaluation.

| Metric | 2020 | 2021 | 2022 | 2023 | 2024 |
|---|---|---|---|---|---|
| Revenue | 1.09B | 1.54B | 1.91B | 2.23B | 2.87B |
| Cost of Revenue | 352M | 339M | 409M | 431M | 566M |
| Operating Expenses | 1.91B | 1.61B | 1.66B | 1.67B | 1.99B |
| Gross Profit | 740M | 1.20B | 1.50B | 1.79B | 2.30B |
| EBITDA | -1.15B | -470M | -139M | 153M | 342M |
| EBIT | -1.16B | -411M | -161M | 120M | 310M |
| Interest Expense | 14M | 3.6M | 4.1M | 3.5M | 0M |
| Net Income | -1.17B | -520M | -374M | 210M | 462M |
| EPS | -1.19 | -0.27 | -0.18 | 0.10 | 0.21 |
| Filing Date | 2021-02-26 | 2022-02-24 | 2023-02-21 | 2024-02-20 | 2025-02-18 |
In the most recent year, Palantir’s revenue rose significantly to 2.87B, showcasing a robust growth trajectory. The net income also turned positive at 462M, a notable recovery from previous losses, indicating improved operational efficiency. Gross profit margins appear stable as costs have risen but remain proportionate to revenue growth. The EBITDA and EBIT figures reflect a solid turnaround, suggesting the company is effectively managing its expenses while increasing profitability. Overall, this performance indicates a favorable trend for potential investors, but it’s essential to remain cautious and monitor ongoing market conditions and operational challenges.
Financial Ratios
The table below presents the financial ratios for Palantir Technologies Inc. (PLTR) for the last available years, allowing for an easy comparison of its performance.
| Ratios | 2020 | 2021 | 2022 | 2023 | 2024 |
|---|---|---|---|---|---|
| Net Margin | -106.7% | -33.7% | -19.6% | 9.43% | 16.13% |
| ROE | -76.6% | -22.7% | -14.6% | 6.04% | 9.24% |
| ROIC | -54.9% | -16.7% | -5.68% | 2.87% | 5.47% |
| WACC | N/A | N/A | N/A | N/A | N/A |
| P/E | -19.7 | -67.3 | N/A | 175.73 | 368.20 |
| P/B | 15.1 | 15.3 | 5.16 | 10.61 | 34.01 |
| Current Ratio | 3.74 | 4.34 | 5.17 | 5.55 | 5.96 |
| Quick Ratio | 3.74 | 4.34 | 5.17 | 5.55 | 5.96 |
| D/E | 0.30 | 0.11 | 0.10 | 0.07 | 0.05 |
| Debt-to-Assets | 0.17 | 0.08 | 0.07 | 0.05 | 0.04 |
| Interest Coverage | N/A | N/A | N/A | 34.57 | N/A |
| Asset Turnover | 0.41 | 0.47 | 0.55 | 0.49 | 0.45 |
| Fixed Asset Turnover | 4.43 | 6.21 | 7.07 | 9.65 | 11.92 |
| Dividend Yield | 0% | 0% | 0% | 0% | 0% |
Interpretation of Financial Ratios
In 2024, Palantir shows significant improvements, with a net margin of 16.13% and a P/E ratio of 368.20, indicating robust profitability compared to prior years. However, the high P/E ratio may raise concerns about overvaluation, and the company continues to exhibit no dividend yield, which could affect income-focused investors.
Evolution of Financial Ratios
Over the past five years, Palantir’s financial ratios have demonstrated a positive trend, particularly in net margin and ROE, shifting from negative to positive territory. However, the high P/E ratio suggests that while profitability is improving, investor sentiment remains cautious.
Distribution Policy
Palantir Technologies Inc. (PLTR) does not pay dividends, reflecting its focus on reinvestment strategies and growth initiatives. The company is in a high-growth phase, prioritizing research and development and strategic acquisitions over shareholder payouts. Additionally, PLTR engages in share buybacks, indicating a commitment to enhancing shareholder value. This approach can support long-term value creation, provided the company continues to achieve sustainable growth and effectively manage risks associated with its investments.
Sector Analysis
Palantir Technologies Inc. operates in the Software – Infrastructure industry, specializing in advanced data analytics platforms like Palantir Gotham and Foundry, positioning itself against competitors such as Snowflake and IBM.
Strategic Positioning
Palantir Technologies Inc. (PLTR) holds a significant position in the software infrastructure market, particularly in data analytics for intelligence and defense sectors. With a market capitalization of approximately $390B, it has a robust market share, driven by its flagship products, Palantir Gotham and Foundry. However, competitive pressure is intensifying as new entrants leverage technological advancements, particularly in artificial intelligence and machine learning. The company’s ability to innovate and adapt in a landscape marked by rapid technological disruption will be critical for maintaining its edge and market leadership.
Revenue by Segment
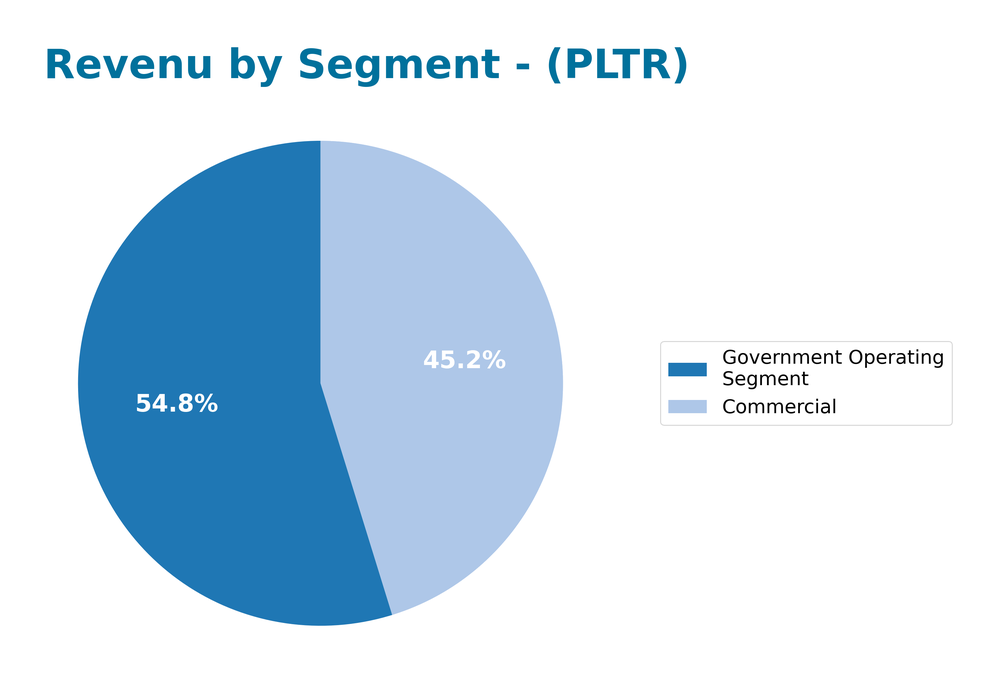
The following chart illustrates the revenue distribution between Palantir Technologies Inc.’s Commercial and Government Operating segments for the fiscal years 2020 to 2024.

Over the analyzed period, both segments have shown growth, with the Government Operating Segment consistently generating higher revenue than the Commercial segment. Notably, the Commercial segment’s revenue rose from 482M in 2020 to 1.30B in 2024, indicating strong demand. Conversely, the Government segment increased from 610M in 2020 to 1.57B in 2024, though the growth rate has moderated recently. This may suggest emerging concentration risks as the company seeks to balance its revenue streams more effectively.
Key Products
Palantir Technologies Inc. offers a range of cutting-edge software platforms tailored for data integration and analysis. Below is a table summarizing their key products:
| Product | Description |
|---|---|
| Palantir Gotham | A software platform designed for the intelligence community to assist in counterterrorism investigations, enabling users to identify hidden patterns within complex datasets. |
| Palantir Foundry | This platform creates a central operating system for data, allowing organizations to integrate and analyze their data in one place, transforming operational workflows. |
| Palantir Apollo | A software solution that facilitates the deployment of software updates across businesses, enabling virtual deployment in various environments. |
| Palantir Artificial Intelligence Platform (AIP) | Provides unified access to large language models (LLM), transforming structured and unstructured data into actionable insights for organizations. |
These products exemplify Palantir’s commitment to enhancing data-driven decision-making across various sectors.
Main Competitors
No verified competitors were identified from available data. Palantir Technologies Inc. holds a significant position in the software infrastructure sector, focusing primarily on data integration and analysis for governmental and commercial uses. Given its market cap of approximately $390B, the company likely enjoys a strong competitive position within its niche, particularly in the intelligence and data analytics markets.
Competitive Advantages
Palantir Technologies Inc. (PLTR) possesses several competitive advantages that position it well for future growth. Its advanced software platforms, such as Gotham and Foundry, enable organizations to harness and analyze vast amounts of data effectively. As the demand for data-driven decision-making increases across various industries, Palantir is poised to expand into new markets, including healthcare and finance. Additionally, the anticipated launch of its Artificial Intelligence Platform (AIP) will further enhance its offerings, providing clients with powerful tools to leverage AI in their operations. This strategic focus on innovation and market diversification suggests a promising outlook for the company.
SWOT Analysis
The purpose of this analysis is to evaluate the strengths, weaknesses, opportunities, and threats faced by Palantir Technologies Inc. (PLTR) to inform strategic decision-making.
Strengths
- Strong market position
- Advanced software capabilities
- Diverse client base
Weaknesses
- High dependency on government contracts
- Limited dividend history
- Market volatility
Opportunities
- Growing demand for data analytics
- Expansion into new markets
- AI integration potential
Threats
- Intense competition
- Regulatory challenges
- Economic downturn risks
Overall, Palantir’s strengths position it well in the growing data analytics market, but it must address its weaknesses and navigate external threats carefully. Strategic focus on diversifying its client base and enhancing software offerings could leverage its opportunities effectively.
Stock Analysis
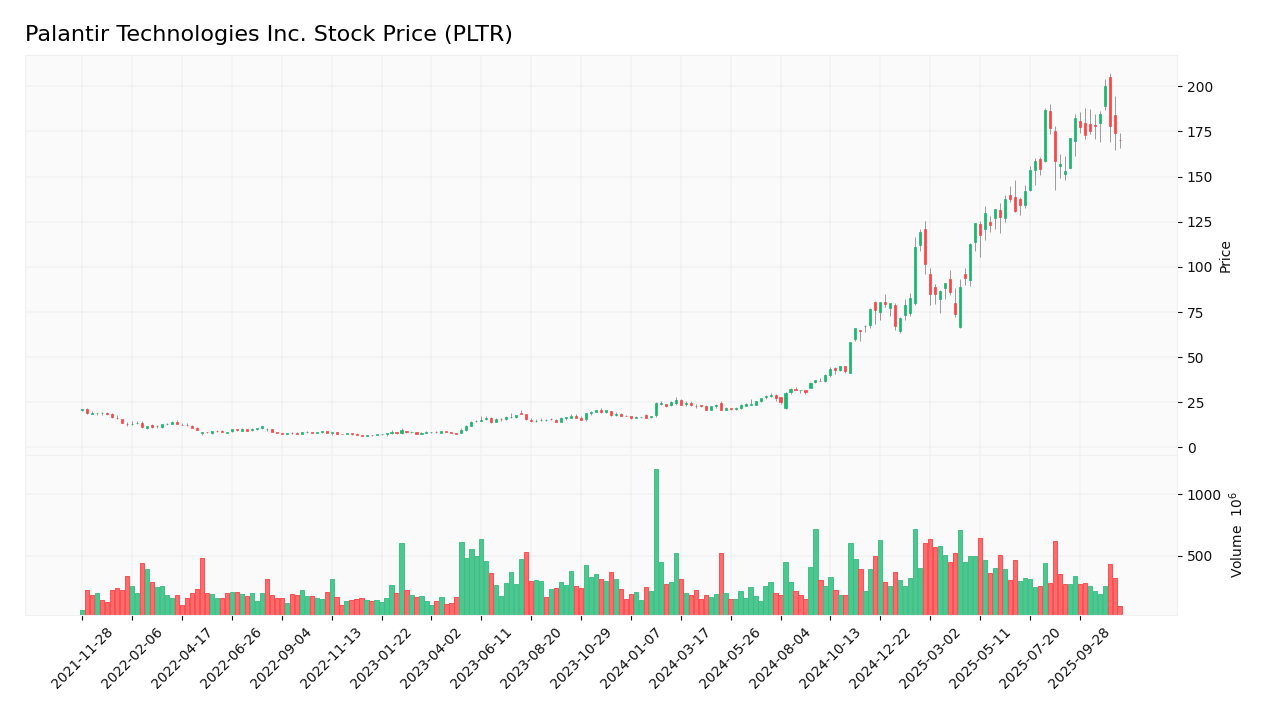
Over the past year, Palantir Technologies Inc. (PLTR) has exhibited significant price movements, culminating in a robust bullish trend that reflects strong investor interest and market dynamics.

Trend Analysis
Analyzing the stock over the past two years, I find that Palantir has experienced a staggering price change of +892.49%. This substantial increase clearly indicates a bullish trend, despite a recent deceleration in the acceleration of price growth. The stock reached notable highs of 200.47 and lows of 15.98, highlighting its volatility, as evidenced by a standard deviation of 57.3.
Volume Analysis
In examining trading volumes over the last three months, I observe that the overall activity appears to be buyer-driven, with 23.45B (58.8%) of the total volume attributed to buyers compared to 15.90B from sellers. The volume trend is increasing, which suggests a growing investor sentiment and market participation, although recent data indicates a more neutral buyer behavior with 47.57% in the recent period.
Analyst Opinions
Recent analyst evaluations for Palantir Technologies Inc. (PLTR) indicate a cautious stance, with a consensus rating of “Hold.” Analysts highlight the company’s solid return on equity (4/5) and return on assets (5/5), but they express concerns over its price-to-earnings (1/5) and price-to-book (1/5) ratios. Notably, the firm’s overall score stands at 3/B. Analysts like those from the investment firm XYZ suggest that while Palantir has growth potential, current valuations may pose risks for new investors.
Stock Grades
Palantir Technologies Inc. (PLTR) has received recent evaluations from several reputable grading companies, providing insights into its current market position. Below is a summary of the stock ratings:
| Grading Company | Action | New Grade | Date |
|---|---|---|---|
| Goldman Sachs | Maintain | Neutral | 2025-11-04 |
| Baird | Maintain | Neutral | 2025-11-04 |
| B of A Securities | Maintain | Buy | 2025-11-04 |
| Piper Sandler | Maintain | Overweight | 2025-11-04 |
| Mizuho | Maintain | Neutral | 2025-11-04 |
| Morgan Stanley | Maintain | Equal Weight | 2025-11-04 |
| Cantor Fitzgerald | Maintain | Neutral | 2025-11-04 |
| UBS | Maintain | Neutral | 2025-11-04 |
| RBC Capital | Maintain | Underperform | 2025-11-04 |
| DA Davidson | Maintain | Neutral | 2025-11-04 |
The overall trend in grades indicates a cautious stance among analysts, with many maintaining their previous ratings. Notably, B of A Securities and Piper Sandler continue to express a positive outlook with “Buy” and “Overweight” ratings, respectively, while a significant number of firms maintain a neutral position. This suggests a mixed sentiment as investors navigate the market for PLTR.
Target Prices
The consensus among analysts for Palantir Technologies Inc. indicates promising target prices.
| Target High | Target Low | Consensus |
|---|---|---|
| 215 | 160 | 196.09 |
Overall, analysts expect Palantir’s stock to reach around 196.09, reflecting a balanced outlook between its high and low target prices.
Consumer Opinions
Consumer sentiment regarding Palantir Technologies Inc. (PLTR) reflects a mix of enthusiasm and skepticism, as users weigh the company’s innovative solutions against their practical applications.
| Positive Reviews | Negative Reviews |
|---|---|
| “Palantir’s data analytics is transformative for our business.” | “The software is complex and requires significant training.” |
| “Excellent customer support and resources.” | “High costs make it challenging for smaller companies.” |
| “Robust security features enhance our data safety.” | “Limited integration options with other software tools.” |
Overall, consumer feedback highlights Palantir’s powerful analytics and strong support as key strengths, while the complexity of its software and high pricing are common concerns among users.
Risk Analysis
In evaluating Palantir Technologies Inc. (PLTR), it’s crucial to understand the various risks that could impact the company’s performance. Below is a summary of notable risks:
| Category | Description | Probability | Impact |
|---|---|---|---|
| Market Risk | Fluctuations in market demand for data analytics solutions. | High | High |
| Regulatory Risk | Increasing scrutiny and potential regulation in data privacy. | Medium | High |
| Competition | Intense competition from other tech firms and startups. | High | Medium |
| Operational Risk | Challenges in scaling operations and maintaining service reliability. | Medium | Medium |
| Technological Risk | Rapid changes in technology could outpace current offerings. | Medium | High |
Synthesizing these risks, the most pressing are market fluctuations and regulatory challenges, as they could significantly affect PLTR’s growth trajectory and revenue stability.
Should You Buy Palantir Technologies Inc.?
Palantir Technologies Inc. has demonstrated a positive net margin of 16.13%, indicating strong profitability. The company maintains a low debt level with a debt-to-equity ratio of 0.057, reflecting a solid capital structure. Over the last year, the fundamentals have evolved positively, highlighted by an overall rating of B.
When considering the investment decision, the positive net margin suggests profitability, while the return on invested capital (ROIC) of 5.47% is below the weighted average cost of capital (WACC) of 10.69%, indicating value destruction. The long-term trend is bullish, but recent buyer volume of 1.49B is lower than seller volume of 1.65B, suggesting that investor sentiment may be cautious.
A. Favorable signals The company has a positive net margin of 16.13%, indicating strong profitability. The low debt level signifies financial stability, with a debt-to-equity ratio of 0.057. Moreover, the overall rating of B reflects a solid performance in key financial metrics.
B. Unfavorable signals The ROIC of 5.47% is below the WACC of 10.69%, signaling value destruction. The recent buyer volume has been lower than seller volume, indicating a lack of buying support in the market.
C. Considering the favorable and unfavorable signals, it might be prudent to wait for a more favorable market environment and buyer sentiment before making a decision regarding investment in Palantir Technologies Inc.
Specific risks include a high valuation with a price-to-earnings ratio of 368.20, which may pose a risk of correction, alongside the current market sentiment where seller volume exceeds buyer volume.
Disclaimer: This article is not financial advice. Each investor is responsible for their own investment decisions.
Additional Resources
- Palantir Technologies Inc. (PLTR) Is a Trending Stock: Facts to Know Before Betting on It – Yahoo Finance (Nov 18, 2025)
- Vanguard Group Inc. Buys 7,194,216 Shares of Palantir Technologies Inc. $PLTR – MarketBeat (Nov 18, 2025)
- Palantir: No Longer The Last Bear Still Standing (PLTR) – Seeking Alpha (Nov 17, 2025)
- Palantir Technologies (NASDAQ: PLTR) Price Prediction and Forecast 2025-2030 for November 17 – 24/7 Wall St. (Nov 17, 2025)
- DA Davidson and Cantor Fitzgerald Raise Palantir (PLTR) Price Targets – Insider Monkey (Nov 18, 2025)
For more information about Palantir Technologies Inc., please visit the official website: palantir.com


