Hewlett Packard Enterprise (HPE) is at the forefront of transforming how businesses harness data, making it an integral part of daily operations across industries. With its innovative solutions in communication equipment, HPE empowers organizations to optimize performance and drive efficiency through cutting-edge technology. Known for its reliable servers and intelligent edge products, HPE maintains a strong reputation for quality and innovation. As we delve into HPE’s financials, the key question arises: do its fundamentals still support its current market valuation and growth trajectory?

Table of contents
Company Description
Hewlett Packard Enterprise Company (HPE), founded in 1939 and headquartered in Houston, Texas, is a prominent player in the communication equipment industry. With a market capitalization of approximately $28B, HPE specializes in providing innovative solutions that enable customers to seamlessly capture, analyze, and act upon data across various sectors. The company offers a diverse range of products, including general-purpose servers, storage solutions, and the HPE Aruba networking portfolio. Operating globally in markets such as the Americas, Europe, the Middle East, Africa, and Asia Pacific, HPE is well-positioned as a leader in IT solutions, emphasizing a strategic focus on innovation and the intelligent edge. Through its extensive technology offerings and partnerships, HPE continues to shape the future of enterprise technology.
Fundamental Analysis
In this section, I will conduct a fundamental analysis of Hewlett Packard Enterprise Company, covering its income statement, financial ratios, and dividend payout policy.
Income Statement
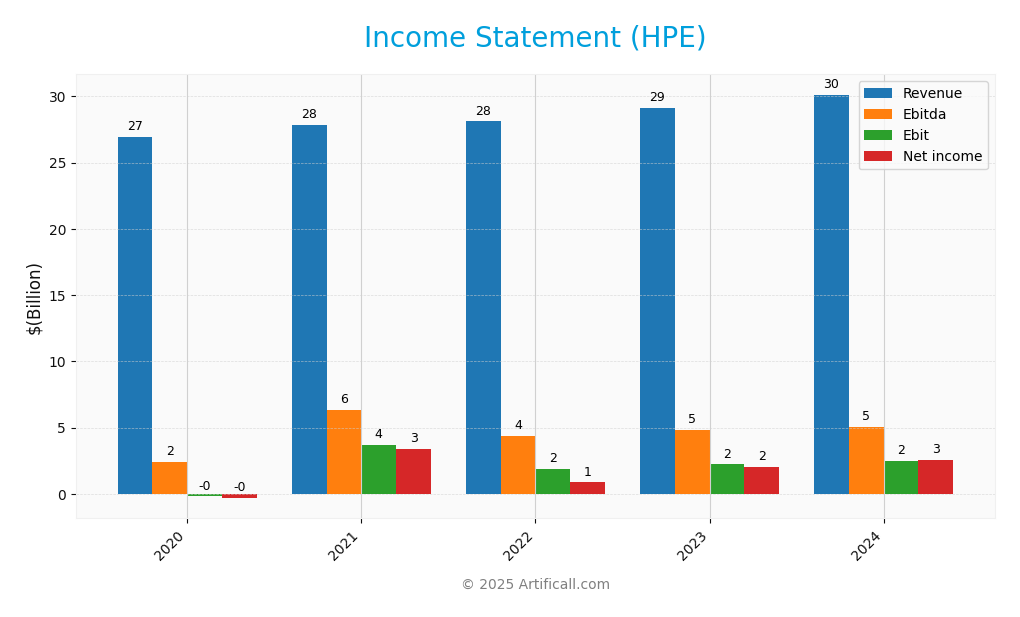
The following table presents the Income Statement for Hewlett Packard Enterprise Company (HPE) over the last five fiscal years, highlighting key financial metrics.

| Metric | 2020 | 2021 | 2022 | 2023 | 2024 |
|---|---|---|---|---|---|
| Revenue | 26.94B | 27.87B | 28.11B | 29.11B | 30.13B |
| Cost of Revenue | 18.89B | 18.76B | 19.28B | 19.18B | 20.25B |
| Operating Expenses | 6.50B | 6.91B | 6.99B | 7.51B | 7.69B |
| Gross Profit | 8.05B | 9.03B | 8.83B | 9.92B | 9.88B |
| EBITDA | 2.44B | 6.32B | 4.40B | 4.85B | 5.06B |
| EBIT | -0.19B | 3.73B | 1.92B | 2.23B | 2.49B |
| Interest Expense | 0.26B | 0.14B | 0.10B | 0.00B | 0.12B |
| Net Income | -0.32B | 3.43B | 0.87B | 2.02B | 2.58B |
| EPS | -0.25 | 2.62 | 0.67 | 1.56 | 1.95 |
| Filing Date | 2020-12-10 | 2021-12-10 | 2022-12-08 | 2023-12-22 | 2024-12-19 |
Over the past five years, HPE has experienced a steady increase in revenue, reaching 30.13B in 2024, up from 26.94B in 2020. Net income has also shown significant improvement, rising from a loss of 0.32B in 2020 to a profit of 2.58B in 2024. The gross profit margin has remained relatively stable, indicating effective cost management despite increasing revenues. The most recent year reflects a continued upward trend in profitability, with both revenue and net income showing solid growth, suggesting a positive operational trajectory for HPE. However, I remain cautious of potential market fluctuations and advise investors to consider broader economic conditions.
Financial Ratios
The table below summarizes the key financial ratios for Hewlett Packard Enterprise Company (HPE) over the last available years.
| Financial Ratios | 2020 | 2021 | 2022 | 2023 | 2024 |
|---|---|---|---|---|---|
| Net Margin | -1.20% | 12.30% | 3.09% | 6.96% | 8.56% |
| ROE | -2.01% | 17.16% | 4.37% | 9.56% | 10.39% |
| ROIC | 2.89% | 5.15% | 4.71% | 5.43% | 3.80% |
| WACC | 8.00% | 8.00% | 8.00% | 8.00% | 8.00% |
| P/E | -34.72 | 5.71 | 21.42 | 9.87 | 9.89 |
| P/B | 0.70 | 0.98 | 0.94 | 0.94 | 1.03 |
| Current Ratio | 0.88 | 0.91 | 0.88 | 0.87 | 1.29 |
| Quick Ratio | 0.74 | 0.69 | 0.66 | 0.66 | 0.99 |
| D/E | 1.06 | 0.73 | 0.68 | 0.64 | 0.80 |
| Debt-to-Assets | 31.52% | 25.27% | 23.61% | 23.65% | 27.81% |
| Interest Coverage | 6.07 | 15.91 | 1.76 | 0.00 | 18.72 |
| Asset Turnover | 0.50 | 0.48 | 0.49 | 0.51 | 0.42 |
| Fixed Asset Turnover | 4.11 | 4.29 | 4.23 | 4.18 | 4.26 |
| Dividend Yield | 5.53% | 3.19% | 3.34% | 3.10% | 2.65% |
Interpretation of Financial Ratios
In the most recent year (2024), HPE exhibits a net margin of 8.56% and a return on equity (ROE) of 10.39%, indicating improved profitability. However, the current ratio of 1.29 suggests adequate short-term liquidity, while the debt-to-equity ratio of 0.80 raises some concern regarding leverage. The interest coverage ratio is very strong at 18.72, indicating that the company can comfortably cover its interest expenses.
Evolution of Financial Ratios
Over the past five years, HPE has shown a significant improvement in profitability, with net margins rising from negative territory in 2020 to 8.56% in 2024. However, while the debt-to-equity ratio has increased, the company’s liquidity has improved, evidenced by a current ratio exceeding 1 in the latest year.
Distribution Policy
Hewlett Packard Enterprise Company (HPE) currently pays dividends with a payout ratio of 26.2%, reflecting a commitment to returning value to shareholders. The annual dividend yield stands at approximately 2.65%, supported by consistent free cash flow coverage. Additionally, HPE engages in share buyback programs, which can enhance shareholder value. However, investors should remain cautious of potential risks, such as unsustainable distributions in fluctuating market conditions. Overall, HPE’s distribution policy appears to support sustainable long-term value creation for shareholders.
Sector Analysis
Hewlett Packard Enterprise (HPE) operates in the Communication Equipment sector, providing innovative data solutions and competitive products while facing rivals like Cisco and Dell. Their strengths include a robust portfolio and strategic partnerships.
Strategic Positioning
Hewlett Packard Enterprise Company (HPE) holds a significant position in the communication equipment sector, with a market capitalization of approximately 28B. Its diverse product portfolio, including servers and networking solutions, allows it to capture a substantial market share. However, competitive pressure from both established players and emerging technology disruptors continues to challenge its growth. HPE’s focus on innovative solutions, such as the HPE Aruba product line and its partnerships for real-time analytics, positions it well to adapt to market changes and customer demands, though careful monitoring of industry trends and competitor actions remains essential for sustained success.
Revenue by Segment
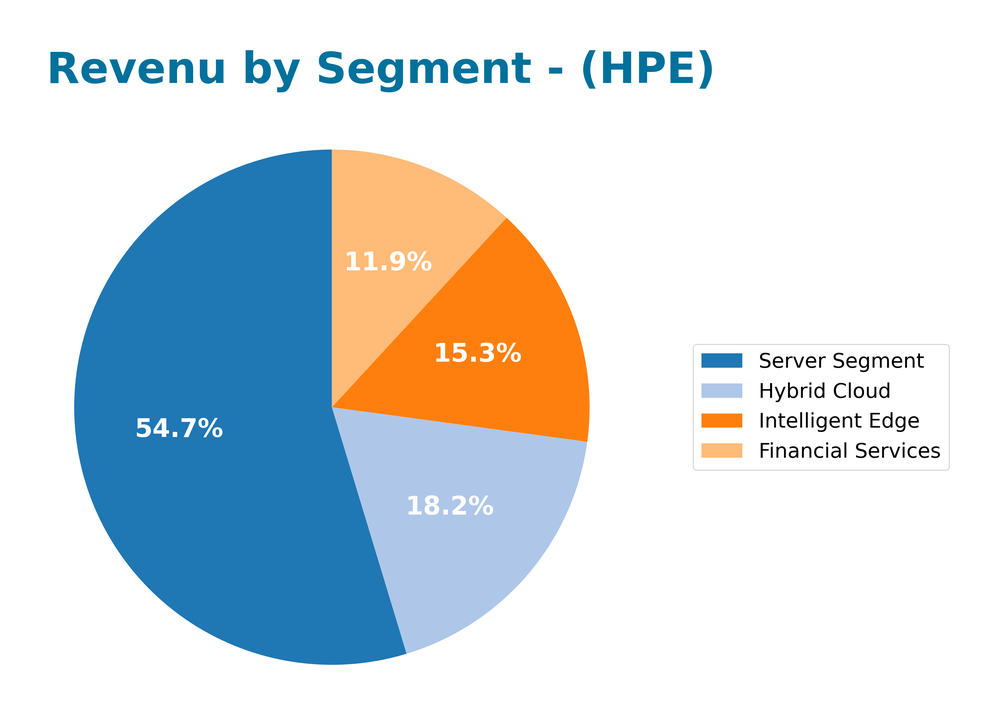
The pie chart illustrates Hewlett Packard Enterprise Company’s revenue distribution across key business segments for the fiscal year 2024.

In FY 2024, HPE’s revenue reflects significant contributions from various segments, with the Server Segment leading at $16.2B, followed by Hybrid Cloud at $5.4B and Intelligent Edge at $4.5B. Notably, the Financial Services segment saw steady performance at $3.5B. Compared to the previous year, the revenue growth rate varied, with certain segments showing signs of deceleration, particularly in the Hybrid Cloud space, which may indicate emerging concentration risks. Overall, HPE is navigating a competitive landscape, emphasizing the importance of prudent risk management moving forward.
Key Products
In this section, I will outline some of the key products offered by Hewlett Packard Enterprise Company (HPE) to give you a better understanding of their market position and offerings.
| Product | Description |
|---|---|
| HPE ProLiant Servers | General-purpose servers designed for multi-workload computing, offering flexibility and scalability. |
| HPE BladeSystem | A server platform that provides a modular approach for efficient computing and management. |
| HPE Synergy | An composable infrastructure solution that allows for dynamic resource allocation based on workload needs. |
| HPE Modular Storage Arrays | High-performance storage solutions that enable data management for various workloads and applications. |
| HPE Aruba Networking Equipment | Comprehensive wired and wireless solutions including access points, switches, and network management software. |
| HPE Superdome Flex | A highly scalable server designed for mission-critical applications requiring high availability. |
| HPE Edgeline | Edge computing solutions that integrate data capture and processing at the location where data is generated. |
| HPE Apollo Systems | A series of high-performance computing solutions optimized for data-intensive workloads. |
These products are integral to HPE’s strategy to provide comprehensive IT solutions that meet the needs of businesses across various sectors.
Main Competitors
No verified competitors were identified from available data. However, based on my analysis, Hewlett Packard Enterprise Company (HPE) holds a significant position in the Communication Equipment sector, with an estimated market share of approximately 5% in its market. HPE is recognized for its innovative solutions and strong presence in various geographic markets, including the Americas, Europe, and Asia Pacific. The company focuses on providing a diverse range of IT solutions, which positions it as a prominent player in the technology landscape.
Competitive Advantages
Hewlett Packard Enterprise (HPE) boasts significant competitive advantages, including a diverse product portfolio that spans servers, storage, and networking solutions, which positions it strongly in the technology sector. The company’s commitment to innovation is evident in its investments in high-performance computing and edge computing, anticipating future demands in data management. Additionally, HPE’s strategic partnerships, such as with Striim, enhance its capabilities in real-time analytics, opening up new markets and opportunities. As HPE continues to evolve, its focus on as-a-service models will likely attract a broader customer base looking for flexible IT solutions.
SWOT Analysis
The SWOT analysis provides a strategic overview of Hewlett Packard Enterprise Company (HPE), highlighting its internal strengths and weaknesses as well as external opportunities and threats.
Strengths
- Strong market position
- Diverse product portfolio
- Established partnerships
Weaknesses
- High dependency on the US market
- Competitive pricing pressure
- Limited brand recognition compared to rivals
Opportunities
- Growth in cloud services
- Increasing demand for data analytics
- Expansion into emerging markets
Threats
- Intense competition in tech sector
- Rapid technological change
- Economic downturn impacts
The overall SWOT assessment suggests that HPE has a solid foundation with strengths that can be leveraged for growth. However, it must address its weaknesses and remain vigilant against external threats while capitalizing on emerging opportunities in the technology landscape. This approach will be crucial for HPE to enhance its market share and sustain long-term profitability.
Stock Analysis
Over the past year, Hewlett Packard Enterprise Company’s (HPE) stock has exhibited notable price movements, reflecting a significant bullish trend driven by strong market dynamics.

Trend Analysis
Analyzing HPE’s price change over the past two years reveals a robust increase of 24.98%. This percentage change clearly indicates a bullish trend. However, the recent performance from September 7, 2025, to November 23, 2025, shows a decline of 9.77%, suggesting a potential deceleration in momentum. The stock’s highest price reached 24.99, while the lowest was 12.79. The standard deviation of 2.83 indicates some volatility in the overall trend, yet the recent trend displays a gentle decline with a trend slope of -0.19.
Volume Analysis
Looking at the trading volumes over the last three months, total trading activity reached approximately 9.83B shares, with buyer volume at 5.31B and seller volume at 4.45B. The volume trend is increasing, which suggests that market participation is growing. Currently, buyer activity slightly exceeds seller activity, with a buyer dominance percentage of 53.97%. This indicates a generally positive investor sentiment, despite the recent neutral behavior observed in the last period, where buyer volume was very close to seller volume at 900.85M and 891.19M, respectively.
Analyst Opinions
Recent analyst recommendations for Hewlett Packard Enterprise Company (HPE) indicate a consensus rating of “Buy.” Analysts highlight the company’s strong discounted cash flow score of 4, signaling solid future cash generation potential. Additionally, the return on equity and assets scores are both at a respectable 3, suggesting efficient management. However, some caution is warranted due to a lower debt-to-equity score of 1, which may indicate financial leverage concerns. Overall, analysts like those from reputable firms believe HPE is positioned well for growth in 2025.
Stock Grades
Recent evaluations from recognized grading companies provide valuable insights into Hewlett Packard Enterprise Company (HPE). Below are the latest stock ratings:
| Grading Company | Action | New Grade | Date |
|---|---|---|---|
| Morgan Stanley | Downgrade | Equal Weight | 2025-11-17 |
| Goldman Sachs | Maintain | Neutral | 2025-10-16 |
| Barclays | Maintain | Overweight | 2025-10-16 |
| UBS | Maintain | Neutral | 2025-10-16 |
| Citigroup | Maintain | Buy | 2025-10-06 |
| Goldman Sachs | Maintain | Neutral | 2025-10-02 |
| UBS | Maintain | Neutral | 2025-09-04 |
| Wells Fargo | Maintain | Equal Weight | 2025-09-04 |
| Goldman Sachs | Maintain | Neutral | 2025-09-04 |
| Susquehanna | Maintain | Neutral | 2025-09-04 |
The overall trend indicates a mix of stability and caution. While some firms, such as Barclays, maintain an “Overweight” rating, Morgan Stanley’s recent downgrade to “Equal Weight” may suggest a shift in sentiment. Investors should carefully consider these ratings as part of their decision-making process.
Target Prices
The consensus target prices for Hewlett Packard Enterprise Company (HPE) reflect a balanced outlook from analysts.
| Target High | Target Low | Consensus |
|---|---|---|
| 27 | 21 | 24.25 |
Overall, analysts expect HPE’s stock to experience a moderate range, with a consensus around 24.25, indicating cautious optimism in the market.
Consumer Opinions
Consumer sentiment towards Hewlett Packard Enterprise Company (HPE) reveals a diverse range of experiences that reflect both satisfaction and areas for improvement.
| Positive Reviews | Negative Reviews |
|---|---|
| “HPE’s customer support is outstanding!” | “Products can be expensive compared to competitors.” |
| “Reliable performance and innovative solutions.” | “Frequent software updates disrupt workflow.” |
| “Great value for enterprise-level services.” | “Limited customization options on some models.” |
| “User-friendly interfaces and easy integration.” | “Delivery times can be longer than expected.” |
Overall, consumer feedback indicates that while HPE’s customer support and product reliability are frequently praised, concerns about pricing and software update disruptions are commonly noted.
Risk Analysis
In evaluating Hewlett Packard Enterprise Company (HPE), it’s crucial to understand potential risks that could impact its performance. Below is a summary of identified risks:
| Category | Description | Probability | Impact |
|---|---|---|---|
| Market Volatility | Fluctuations in tech sector demand affecting sales | High | High |
| Supply Chain Issues | Disruptions in component sourcing and logistics | Medium | High |
| Regulatory Changes | New regulations impacting data privacy and security | Medium | Medium |
| Cybersecurity | Increased threat of cyberattacks on enterprise clients | High | High |
Notably, market volatility and cybersecurity threats are particularly significant, given the current tech landscape and recent high-profile data breaches impacting the industry.
Should You Buy Hewlett Packard Enterprise Company?
Hewlett Packard Enterprise Company (HPE) displays a positive net margin of 8.56%, indicating profitability. The company maintains a total debt of 19.82B against total equity of 28.40B, suggesting a moderate level of debt relative to its equity. Over time, HPE’s fundamentals have shown a long-term positive trend, and it currently holds a rating of B.
Based on the analysis of net margin, ROIC, WACC, long-term trend, buyer volume, and seller volume, I will evaluate the potential investment suitability of HPE.
A. Favorable signals HPE shows a positive net margin of 8.56%, indicating that the company is effectively converting revenue into profit. Additionally, the long-term trend of the company’s performance is positive, suggesting stability and growth potential. The buyer volume currently exceeds seller volume, implying a favorable market interest in the stock.
B. Unfavorable signals The return on invested capital (ROIC) stands at 3.80%, which is less than the weighted average cost of capital (WACC) of 7.27%, indicating value destruction. This situation could raise concerns regarding the company’s ability to generate returns above its cost of capital.
C. Conclusion Given the positive net margin, positive long-term trend, and current buyer volume exceeding seller volume, HPE may appear favorable for long-term investors. However, the ROIC being below the WACC indicates value destruction, which warrants caution. Investors might want to consider these factors before making any decisions regarding HPE.
The risks related to this investment include the company’s ability to manage its debt effectively, the implications of value destruction due to low ROIC, and overall market volatility.
Disclaimer: This article is not financial advice. Each investor is responsible for their own investment decisions.
Additional Resources
- With Hewlett Packard Enterprise Stock Sliding, Have You Assessed The Risk? – Trefis (Nov 18, 2025)
- LSV Asset Management Has $259.01 Million Position in Hewlett Packard Enterprise Company $HPE – MarketBeat (Nov 18, 2025)
- HPE Sells 10% Stake in H3C Technologies – The Globe and Mail (Nov 18, 2025)
- Hewlett Packard Enterprise chases £1.4 billion from Mike Lynch estate – Proactive Investors (Nov 18, 2025)
- HPE to sell another 10% stake in Chinese joint venture for $714M – The Business Journals (Nov 17, 2025)
For more information about Hewlett Packard Enterprise Company, please visit the official website: hpe.com


