In today’s rapidly evolving market, identifying the right investment opportunities is crucial. This analysis compares Teradyne, Inc. (TER) and Nordson Corporation (NDSN), two companies operating in distinct yet overlapping sectors: semiconductors and industrial machinery. Both firms are recognized for their innovative technologies and robust growth strategies, which position them well within their respective industries. Join me as we delve into the strengths and potential risks of each company to discover which one may be the more compelling investment choice for you.
Table of contents
Company Overview
Teradyne, Inc. Overview
Teradyne, Inc. operates as a leader in the semiconductor testing sector, providing automated test equipment and solutions across various markets, including automotive, industrial, and consumer electronics. With a market capitalization of approximately $29B, Teradyne’s strategic segments include Semiconductor Test, System Test, Industrial Automation, and Wireless Test, allowing it to address diverse customer needs. The company’s innovative solutions, such as collaborative robotic arms and advanced test systems, are essential for manufacturers looking to enhance efficiency and accuracy. Founded in 1960 and headquartered in North Reading, Massachusetts, Teradyne continues to innovate in a rapidly evolving technological landscape.
Nordson Corporation Overview
Nordson Corporation specializes in precision dispensing solutions for adhesives, coatings, and other fluids, serving multiple industries, including consumer goods and semiconductor manufacturing. With a market capitalization of about $13B, Nordson operates through two primary segments: Industrial Precision Solutions and Advanced Technology Solutions. The company emphasizes automation and precision in its processes, providing high-quality systems that improve production efficiency. Established in 1935 and based in Westlake, Ohio, Nordson remains committed to engineering excellence and customer satisfaction.
Key Similarities and Differences
Both Teradyne and Nordson are leaders in their respective industries, focusing on automation and precision. However, Teradyne primarily concentrates on semiconductor testing technologies, while Nordson specializes in dispensing systems for a wider range of fluids and materials. This distinction highlights their unique market positions and customer bases.
Income Statement Comparison
The following table provides a comparison of key income statement metrics for Teradyne, Inc. (TER) and Nordson Corporation (NDSN) based on their most recent fiscal years.
| Metric | Teradyne, Inc. (TER) | Nordson Corporation (NDSN) |
|---|---|---|
| Revenue | 2.82B | 2.69B |
| EBITDA | 732M | 811M |
| EBIT | 613M | 674M |
| Net Income | 542M | 467M |
| EPS | 3.41 | 8.17 |
Interpretation of Income Statement
In the most recent fiscal year, Teradyne reported revenue growth of 5.2% compared to the previous year, while Nordson experienced a modest increase of 1.3%. Teradyne’s net income also rose significantly by 20.9%, reflecting improved operational efficiency and margins. Conversely, Nordson’s net income declined slightly, suggesting challenges in maintaining profitability amidst rising costs. Overall, while Teradyne shows positive momentum in both revenue and net income, Nordson’s stability indicates potential areas of concern that investors should monitor closely.
Financial Ratios Comparison
In this section, I present a comparative analysis of key financial metrics for Teradyne, Inc. (TER) and Nordson Corporation (NDSN) based on the most recent data available.
| Metric | [Company A: TER] | [Company B: NDSN] |
|---|---|---|
| ROE | 19.24% | 15.94% |
| ROIC | 17.25% | 9.65% |
| P/E | 36.93 | 30.56 |
| P/B | 7.11 | 4.87 |
| Current Ratio | 2.91 | 2.41 |
| Quick Ratio | 1.84 | 1.51 |
| D/E | 0.03 | 0.79 |
| Debt-to-Assets | 2.07% | 38.67% |
| Interest Coverage | 165.54 | 7.58 |
| Asset Turnover | 0.76 | 0.45 |
| Fixed Asset Turnover | 4.88 | 4.21 |
| Payout ratio | 14.09% | 34.55% |
| Dividend yield | 0.38% | 1.13% |
Interpretation of Financial Ratios
The ratios indicate that Teradyne, Inc. demonstrates stronger efficiency and profitability metrics compared to Nordson Corporation, particularly in ROE, ROIC, and interest coverage. However, the higher P/E and P/B ratios suggest that TER may be overvalued relative to NDSN. Additionally, Nordson’s higher debt levels raise concerns about financial leverage, which could impact risk. Investors should weigh these factors carefully when considering their portfolios.
Dividend and Shareholder Returns
Teradyne, Inc. (TER) boasts a dividend yield of 0.38%, with a payout ratio of approximately 14.1%. This indicates a sustainable distribution supported by strong free cash flow. Conversely, Nordson Corporation (NDSN) offers a higher yield of 1.13% and a payout ratio of 34.5%, showcasing a commitment to return value to shareholders. Both companies engage in share buyback programs, enhancing shareholder value over the long term. Overall, these distributions support sustainable value creation.
Strategic Positioning
In the semiconductor and industrial machinery sectors, Teradyne, Inc. (TER) and Nordson Corporation (NDSN) face varying levels of competitive pressure. Teradyne holds a strong market share in semiconductor testing equipment, benefiting from technological advancements and automation trends. Meanwhile, Nordson’s diverse product offerings in adhesive dispensing systems enable it to maintain a solid foothold in the industrial market. However, both companies must navigate ongoing technological disruptions and adapt to evolving market demands to sustain their competitive edges.
Stock Comparison
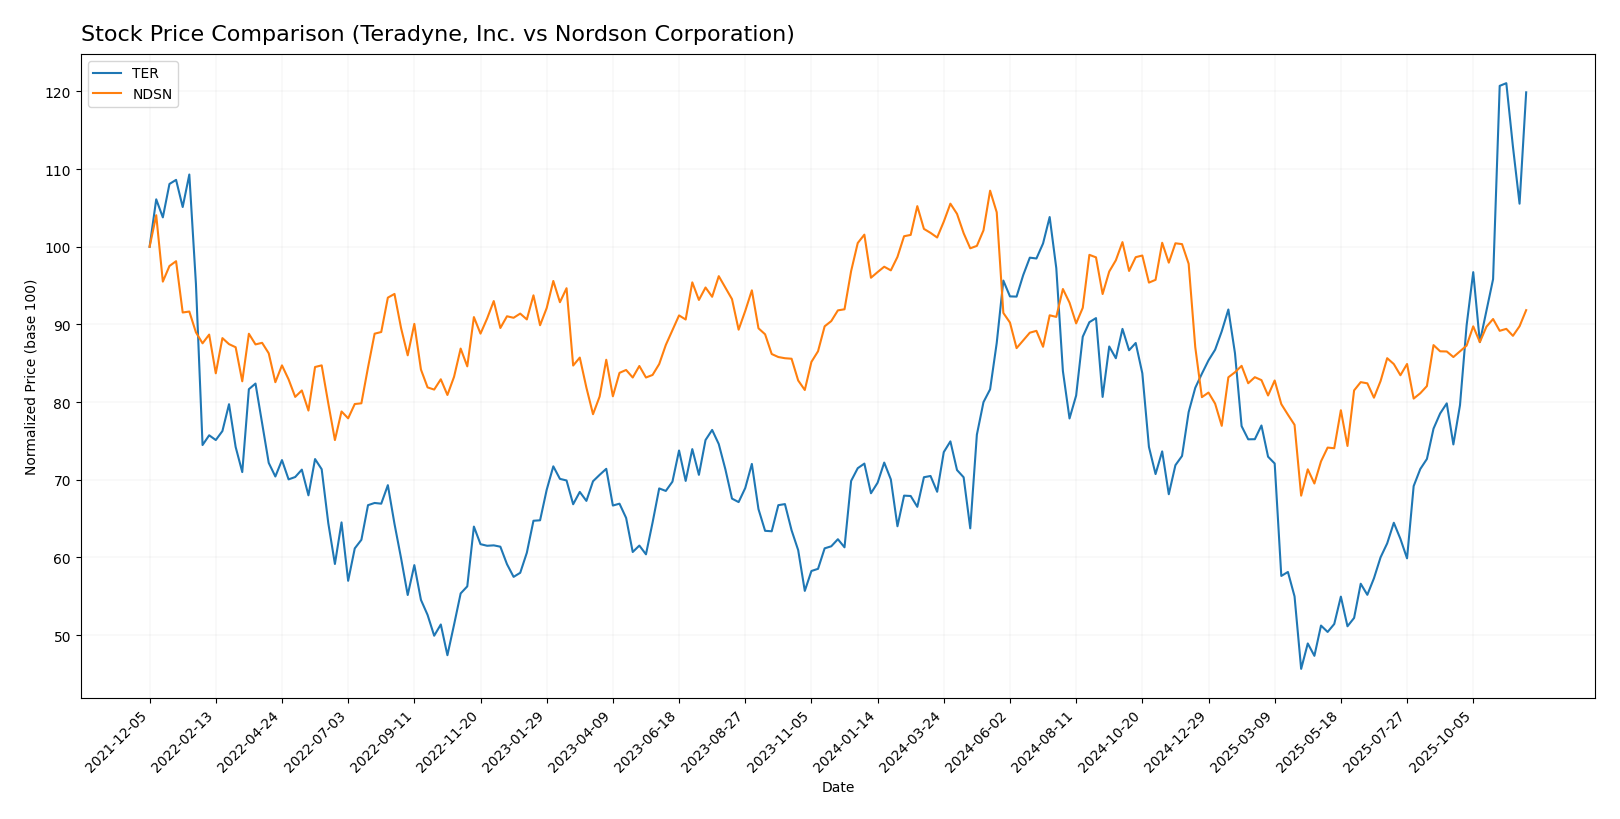
This section delves into the weekly stock price movements of Teradyne, Inc. (TER) and Nordson Corporation (NDSN) over the past year, highlighting significant price fluctuations and trading dynamics that can inform investment decisions.
Trend Analysis
For Teradyne, Inc. (TER), the stock has experienced a robust bullish trend with a remarkable percentage change of +75.64% over the past year. This significant increase indicates a strong upward momentum, supported by an acceleration in price movement. The stock reached a notable high of 182.28, with a low of 68.72. The standard deviation of 24.49 suggests a moderate level of volatility. Recently, from September 14, 2025, to November 30, 2025, the stock has also shown a positive change of +60.83%, further underlining its accelerating bullish trend.
In contrast, Nordson Corporation (NDSN) presents a bearish trend with a percentage change of -4.35% over the past year. This decline indicates a downward trajectory, accompanied by an acceleration in the negative price movement. The stock’s highest price was 278.89, while it reached a low of 176.73. With a standard deviation of 23.84, this stock also exhibits moderate volatility. However, in a recent analysis between September 14, 2025, and November 30, 2025, NDSN showed a positive shift with a 7.04% change, suggesting a potential recovery, although it still reflects a bearish overall trend.
Analyst Opinions
Recent analyst recommendations for Teradyne, Inc. (TER) indicate a “Buy” rating, largely due to its solid return on assets (5) and equity (4), despite a lower score in price-to-earnings (1). Analysts highlight its strong fundamentals as a key reason for optimism. Conversely, Nordson Corporation (NDSN) also carries a “Buy” rating, bolstered by a robust return on assets (5) and a favorable discounted cash flow score (4). The consensus for both companies this year leans towards a “Buy,” suggesting strong potential for growth in the current market.
Stock Grades
I’ve gathered some recent stock grades from credible grading companies for two companies: Teradyne, Inc. (TER) and Nordson Corporation (NDSN). Here’s a detailed look at their current ratings.
Teradyne, Inc. Grades
| Grading Company | Action | New Grade | Date |
|---|---|---|---|
| Citigroup | maintain | Buy | 2025-11-12 |
| Goldman Sachs | maintain | Sell | 2025-10-30 |
| JP Morgan | maintain | Neutral | 2025-10-30 |
| UBS | maintain | Buy | 2025-10-30 |
| Evercore ISI Group | maintain | Outperform | 2025-10-30 |
| Stifel | maintain | Hold | 2025-10-28 |
| Morgan Stanley | maintain | Equal Weight | 2025-10-14 |
Nordson Corporation Grades
| Grading Company | Action | New Grade | Date |
|---|---|---|---|
| Oppenheimer | maintain | Outperform | 2025-08-25 |
| Baird | maintain | Neutral | 2025-08-22 |
| Keybanc | maintain | Overweight | 2025-07-15 |
| Oppenheimer | upgrade | Outperform | 2025-05-30 |
| Baird | maintain | Neutral | 2025-05-30 |
| Keybanc | maintain | Overweight | 2025-04-08 |
| Keybanc | upgrade | Overweight | 2025-03-04 |
| Baird | maintain | Neutral | 2025-02-21 |
| Loop Capital | upgrade | Buy | 2025-01-22 |
| Seaport Global | upgrade | Buy | 2024-12-17 |
Overall, Teradyne has a mixed set of grades with both Buy and Sell recommendations, indicating caution among analysts. In contrast, Nordson shows a more positive trend with a majority of grades leaning towards Outperform and Buy, suggesting a favorable outlook.
Target Prices
The latest analyst consensus indicates promising target prices for both Teradyne, Inc. and Nordson Corporation.
| Company | Target High | Target Low | Consensus |
|---|---|---|---|
| Teradyne, Inc. | 215 | 119 | 172.67 |
| Nordson Corporation | 285 | 240 | 263 |
For Teradyne, the target consensus of 172.67 suggests a slight premium compared to its current price of 180.65. Meanwhile, Nordson’s consensus of 263 offers significant upside potential against its current price of 238.83, reflecting overall positive analyst sentiment.
Strengths and Weaknesses
The following table outlines the strengths and weaknesses of Teradyne, Inc. (TER) and Nordson Corporation (NDSN) based on the most recent available data.
| Criterion | Teradyne, Inc. | Nordson Corporation |
|---|---|---|
| Diversification | High | Moderate |
| Profitability | High (Net Margin: 19.23%) | Moderate (Net Margin: 17.37%) |
| Innovation | Strong R&D focus | Steady product innovation |
| Global presence | Extensive | Strong but regional focus |
| Market Share | Significant | Moderate |
| Debt level | Very low (Debt/Equity: 0.03) | Moderate (Debt/Equity: 0.79) |
Key takeaways indicate that while Teradyne demonstrates superior profitability and a very low debt level, Nordson has a solid innovation track record but carries a higher debt-to-equity ratio, highlighting the need for caution in investment decisions.
Risk Analysis
The following table summarizes the key risks associated with Teradyne, Inc. and Nordson Corporation based on their most recent fiscal year data.
| Metric | Teradyne, Inc. | Nordson Corporation |
|---|---|---|
| Market Risk | High | Moderate |
| Regulatory Risk | Moderate | High |
| Operational Risk | Moderate | Moderate |
| Environmental Risk | Low | Moderate |
| Geopolitical Risk | High | Moderate |
Both companies face significant market and geopolitical risks, particularly due to the semiconductor industry’s volatility and global supply chain issues. Regulatory risks are more pronounced for Nordson, reflecting its broader industrial exposure.
Which one to choose?
In comparing Teradyne, Inc. (TER) and Nordson Corporation (NDSN), both companies exhibit solid fundamentals, yet their market positions diverge. TER shows a strong gross profit margin of 58.5% and impressive growth with a recent stock price increase of 75.64%, reflecting bullish trends. Meanwhile, NDSN’s gross profit margin stands at 55.2%, but it has experienced a decline of 4.35% in stock value. Analysts rate TER with a grade of B, while NDSN holds a slightly higher grade of B+. However, TER’s lower price-to-earnings ratio (36.93) compared to NDSN (30.56) suggests it might be relatively overvalued.
For investors seeking growth potential, TER appears favorable, while those looking for stability might favor NDSN. Nevertheless, both companies face risks such as competition and market dependency that could impact performance.
Disclaimer: This article is not financial advice. Each investor is responsible for their own investment decisions.
Go further
I encourage you to read the complete analyses of Teradyne, Inc. and Nordson Corporation to enhance your investment decisions: