In the evolving landscape of technology and industrial innovation, Teradyne, Inc. (TER) and Kadant Inc. (KAI) stand out as compelling contenders. Both companies operate within industries that are critical to modern manufacturing and automation, yet they approach innovation in distinct ways. Teradyne focuses on semiconductor testing and automation solutions, while Kadant specializes in engineered systems for fluid handling and industrial processing. As we delve into this comparison, I invite you to explore which of these two companies presents the most intriguing investment opportunity for your portfolio.
Table of contents
Company Overview
Teradyne, Inc. Overview
Teradyne, Inc. operates within the semiconductor testing industry, providing innovative solutions for automated testing of electronic devices. Founded in 1960 and headquartered in North Reading, Massachusetts, the company has positioned itself as a leader in the market by developing advanced equipment across several segments, including Semiconductor Test, Industrial Automation, and Wireless Test. Teradyne’s cutting-edge technology supports a wide range of applications, from automotive to consumer electronics, ensuring quality and efficiency in the manufacturing process. With a market capitalization of approximately $28.8B, Teradyne continues to drive growth through technological advancements and a robust customer base, which includes integrated device manufacturers and fabless companies.
Kadant Inc. Overview
Kadant Inc., established in 1991 and headquartered in Westford, Massachusetts, specializes in engineered systems and technologies for diverse industrial applications. The company operates through three primary segments: Flow Control, Industrial Processing, and Material Handling. Kadant is known for its innovative fluid-handling systems, industrial automation products, and recycling solutions, serving industries such as packaging, wood products, and alternative fuels. With a market capitalization of around $3.27B, Kadant is committed to sustainability and efficiency, offering products that enhance operational performance while minimizing environmental impact.
Key Similarities and Differences
Both Teradyne and Kadant operate in technology-driven sectors, focusing on automation and efficiency in their respective markets. However, while Teradyne is primarily involved in semiconductor testing and related technologies, Kadant provides solutions for industrial processing and material handling. This distinction highlights their unique business models, catering to different industries and customer needs.
Income Statement Comparison
The following table presents a comparison of the income statements for Teradyne, Inc. (TER) and Kadant Inc. (KAI) for the most recent fiscal year, highlighting key financial metrics.
| Metric | Teradyne, Inc. | Kadant Inc. |
|---|---|---|
| Revenue | 2.82B | 1.05B |
| EBITDA | 732M | 223M |
| EBIT | 613M | 173M |
| Net Income | 542M | 112M |
| EPS | 3.41 | 9.51 |
Interpretation of Income Statement
In the latest fiscal year, Teradyne showed a revenue increase to 2.82B, up from 2.68B in the previous year, indicating a positive growth trend. Kadant also demonstrated growth with revenue rising to 1.05B from 958M. Teradyne’s EBITDA margin improved slightly, reflecting operational efficiency, while Kadant maintained stable margins. However, Teradyne’s net income rose to 542M, compared to a prior year of 449M, indicating effective cost management despite market pressures. Kadant’s net income also saw a positive shift, rising to 112M, suggesting resilience in its business model. Overall, both companies are navigating their market environments effectively, though Teradyne appears to be experiencing stronger growth.
Financial Ratios Comparison
The following table presents a comparative analysis of key financial ratios for Teradyne, Inc. (TER) and Kadant Inc. (KAI). This will help investors evaluate the financial health of both companies.
| Metric | Teradyne (TER) | Kadant (KAI) |
|---|---|---|
| ROE | 19.24% | 13.17% |
| ROIC | 17.25% | 10.08% |
| P/E | 36.93 | 36.90 |
| P/B | 7.11 | 4.86 |
| Current Ratio | 2.91 | 2.31 |
| Quick Ratio | 1.84 | 1.55 |
| D/E | 0.03 | 0.38 |
| Debt-to-Assets | 0.02 | 0.23 |
| Interest Coverage | 165.54 | 8.55 |
| Asset Turnover | 0.76 | 0.74 |
| Fixed Asset Turnover | 4.88 | 6.18 |
| Payout ratio | 14.09% | 13.15% |
| Dividend yield | 0.38% | 0.36% |
Interpretation of Financial Ratios
Teradyne showcases stronger financial health with a higher ROE and ROIC, indicating effective capital utilization. Its low debt levels (D/E and Debt-to-Assets) suggest a conservative approach to leverage, enhancing stability. Conversely, Kadant’s lower interest coverage signifies potential vulnerability in servicing debt. While both companies have comparable P/E ratios, Teradyne’s ratios reflect superior profitability and risk management, making it a potentially safer investment choice.
Dividend and Shareholder Returns
Teradyne, Inc. (TER) maintains a dividend payout ratio of approximately 14.1%, yielding around 0.38%. This is supported by a consistent free cash flow, indicating sustainable distributions. Conversely, Kadant Inc. (KAI) demonstrates a lower payout ratio of about 13.1% with a yield of 0.36%, reflecting its focus on reinvestment. Both companies engage in share buyback programs, enhancing shareholder returns. Overall, their strategies appear aligned with long-term value creation.
Strategic Positioning
Teradyne, Inc. (TER) holds a significant market share in the semiconductor testing industry, leveraging its diverse product range to combat competitive pressure and technological disruptions. With a market cap of 28.8B and a beta of 1.85, it exhibits strong volatility, reflecting its growth potential. Conversely, Kadant Inc. (KAI) operates in the industrial machinery sector, with a market cap of 3.27B, focusing on engineered systems. While both companies face competition, Teradyne’s advanced technology positions it favorably amid rapid industry changes.
Stock Comparison
In this analysis, I will examine the stock performance of Teradyne, Inc. (TER) and Kadant Inc. (KAI) over the past year, highlighting key price movements and trading dynamics.
Trend Analysis
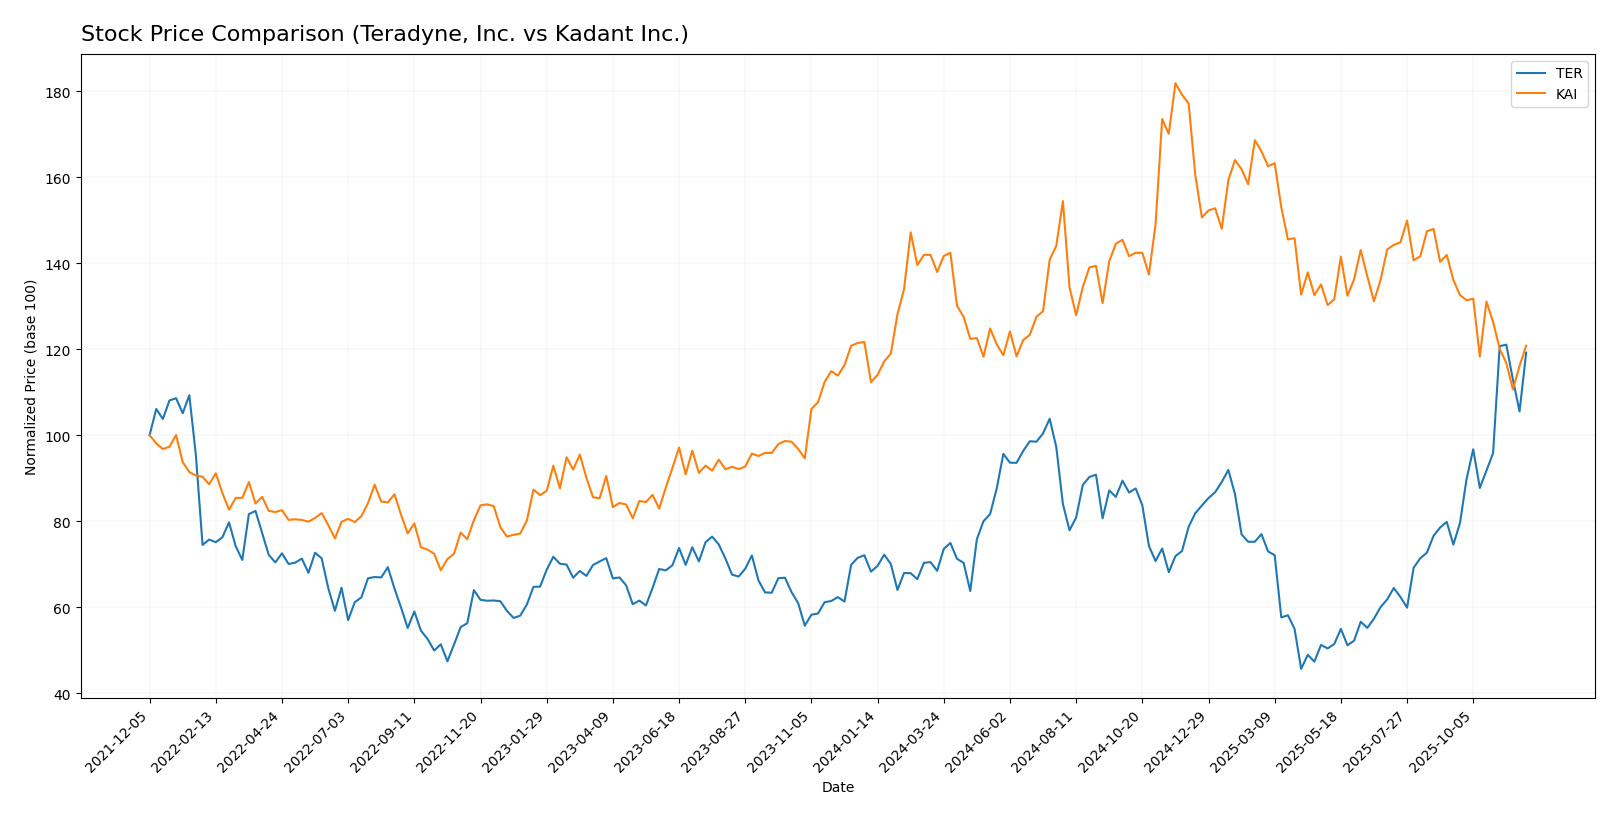
Teradyne, Inc. (TER) has experienced a substantial increase in its stock price, with a percentage change of +74.66% over the past year. This indicates a bullish trend, supported by notable acceleration in price movement. The stock has reached a high of 182.28 and a low of 68.72, with a standard deviation of 24.47 suggesting significant volatility. Recently, from September 14, 2025, to November 30, 2025, the stock reflected a price change of +59.93%, reinforcing the overall bullish sentiment.
Kadant Inc. (KAI) has also shown a positive price change of +7.58% over the last year, which is classified as a bullish trend despite a recent downturn. The stock’s highest price was 419.01 and the lowest was 254.91, with a standard deviation of 35.59 indicating considerable volatility. However, the recent trend from September 14, 2025, to November 30, 2025, revealed a decline of -11.22%, indicating a deceleration in price movement.
In summary, while both stocks are in a generally positive trend over the past year, Teradyne displays stronger momentum compared to Kadant’s recent challenges.
Analyst Opinions
Recent recommendations for Teradyne, Inc. (TER) suggest a “Buy” rating from analysts due to solid performance metrics, particularly in return on assets and equity, despite a lower score in price-to-earnings. Meanwhile, Kadant Inc. (KAI) has garnered a “Buy” rating as well, with analysts praising its strong cash flow and asset management. The consensus for both companies is a “Buy” for 2025, reflecting positive sentiment in their growth potential and financial health. Analysts agree on both companies’ capability to navigate market challenges effectively.
Stock Grades
In this section, I present the latest stock ratings for Teradyne, Inc. and Kadant Inc., based on reliable analyses from recognized grading companies.
Teradyne, Inc. Grades
| Grading Company | Action | New Grade | Date |
|---|---|---|---|
| Citigroup | maintain | Buy | 2025-11-12 |
| Goldman Sachs | maintain | Sell | 2025-10-30 |
| JP Morgan | maintain | Neutral | 2025-10-30 |
| UBS | maintain | Buy | 2025-10-30 |
| Evercore ISI Group | maintain | Outperform | 2025-10-30 |
| Stifel | maintain | Hold | 2025-10-28 |
| Evercore ISI Group | maintain | Outperform | 2025-10-28 |
| UBS | maintain | Buy | 2025-10-20 |
| Morgan Stanley | maintain | Equal Weight | 2025-10-14 |
| Stifel | maintain | Hold | 2025-10-13 |
Kadant Inc. Grades
| Grading Company | Action | New Grade | Date |
|---|---|---|---|
| Barrington Research | maintain | Outperform | 2025-10-30 |
| Barrington Research | maintain | Outperform | 2025-10-29 |
| Barrington Research | maintain | Outperform | 2025-10-27 |
| Barrington Research | maintain | Outperform | 2025-10-10 |
| Barrington Research | maintain | Outperform | 2025-09-23 |
| DA Davidson | maintain | Neutral | 2025-08-04 |
| Barrington Research | maintain | Outperform | 2025-07-30 |
| Barrington Research | maintain | Outperform | 2025-07-29 |
| Barrington Research | maintain | Outperform | 2025-05-01 |
| DA Davidson | maintain | Neutral | 2025-05-01 |
Overall, both Teradyne and Kadant have maintained strong ratings from their respective grading companies, with Kadant showing a consistent “Outperform” assessment. While Teradyne has a mix of ratings, it maintains a solid “Buy” recommendation from several firms, indicating a cautious but positive outlook for these stocks.
Target Prices
The consensus target prices for Teradyne, Inc. and Kadant Inc. reflect optimistic outlooks from analysts.
| Company | Target High | Target Low | Consensus |
|---|---|---|---|
| Teradyne, Inc. | 215 | 119 | 172.67 |
| Kadant Inc. | 410 | 275 | 342.5 |
Analysts expect Teradyne, Inc. to reach a consensus of 172.67, slightly below its current price of 179.38, suggesting a cautious near-term outlook. In contrast, Kadant Inc. has a consensus of 342.5, indicating significant upside potential from its current price of 277.81.
Strengths and Weaknesses
Below is a comparison of the strengths and weaknesses of Teradyne, Inc. (Ticker: TER) and Kadant Inc. (Ticker: KAI).
| Criterion | Teradyne, Inc. | Kadant Inc. |
|---|---|---|
| Diversification | High (multiple segments in tech) | Moderate (focused on industrial systems) |
| Profitability | Strong margins (Net profit margin: 19.2%) | Moderate margins (Net profit margin: 10.5%) |
| Innovation | High (focus on automation and testing tech) | Moderate (engineering systems) |
| Global presence | Established worldwide | Established but less global reach |
| Market Share | Significant in semiconductor testing | Niche in industrial machinery |
| Debt level | Low (Debt to equity: 2.7%) | Moderate (Debt to equity: 38.1%) |
Key takeaways: Teradyne exhibits strong profitability and innovation, positioning it favorably within the tech sector. In contrast, Kadant, while stable, faces challenges with profitability and higher debt levels, suggesting a greater risk for investors.
Risk Analysis
The following table summarizes the risks associated with Teradyne, Inc. and Kadant Inc., highlighting key metrics that investors should consider.
| Metric | Teradyne, Inc. (TER) | Kadant Inc. (KAI) |
|---|---|---|
| Market Risk | High | Moderate |
| Regulatory Risk | Moderate | High |
| Operational Risk | Moderate | Moderate |
| Environmental Risk | Low | High |
| Geopolitical Risk | Moderate | Moderate |
In analyzing the risks, Teradyne faces significant market and regulatory challenges, particularly in the semiconductor industry, which is sensitive to global supply chain disruptions. Kadant, on the other hand, has higher environmental risks due to its industrial operations, necessitating compliance with stringent regulations. Investors should weigh these risks against potential returns carefully.
Which one to choose?
When comparing Teradyne, Inc. (TER) and Kadant Inc. (KAI), we can see distinct differences in financial performance and market trends. Teradyne exhibits a solid profit margin of 19.23% and a robust growth trajectory with a stock price increase of 74.66% over the past year. In contrast, Kadant has a lower profit margin of 10.59% but benefits from a strong balance sheet with a current ratio of 2.31. Analysts rate both companies as “B” and “B+”, respectively, indicating a favorable outlook, but TER’s stronger earnings growth and stock momentum suggest it may be more suited for growth-focused investors.
Investors prioritizing growth may prefer Teradyne, while those seeking solid fundamentals and stability might find Kadant attractive. Nonetheless, both companies face risks from industry competition and market fluctuations.
Disclaimer: This article is not financial advice. Each investor is responsible for their own investment decisions.
Go further
I encourage you to read the complete analyses of Teradyne, Inc. and Kadant Inc. to enhance your investment decisions: