In the fast-evolving landscapes of technology and industrial machinery, two companies stand out: Teradyne, Inc. (TER) and JBT Marel Corporation (JBTM). While Teradyne specializes in semiconductor testing and automation, JBT Marel focuses on innovative solutions for the food and beverage industry. This article compares their market positions, growth strategies, and innovation approaches, helping investors weigh which company presents the most compelling opportunity. Join me as we explore the nuances of these two intriguing firms and determine which is the better investment choice.
Table of contents
Company Overview
Teradyne, Inc. Overview
Teradyne, Inc. is a leading provider of automatic test equipment, primarily serving the semiconductor, defense, and industrial automation sectors. Established in 1960 and headquartered in North Reading, Massachusetts, Teradyne operates through multiple segments, including Semiconductor Test, System Test, Industrial Automation, and Wireless Test. The company’s mission is to enable customers to achieve higher efficiency and reliability in their manufacturing processes through innovative testing solutions. With a market capitalization of approximately $28.8B, Teradyne has positioned itself as a critical player in the semiconductor testing space, catering to a diverse range of industries from automotive to consumer electronics.
JBT Marel Corporation Overview
JBT Marel Corporation specializes in technology solutions tailored for the food and beverage industry. Founded in 1994 and headquartered in Chicago, Illinois, the company provides an extensive array of processing solutions, including chilling, cooking, and packaging, to various sectors like poultry, meat, and pharmaceuticals. By integrating advanced automation and robotics into its offerings, JBT Marel aims to enhance operational efficiency and product quality for its clients. With a market capitalization of around $7.3B, the company has established a significant presence in the industrial machinery sector, especially in the food processing industry.
Key Similarities and Differences
Both Teradyne and JBT Marel focus on providing specialized technology solutions, but they cater to different industries—Teradyne in semiconductor testing and JBT Marel in food processing. While Teradyne emphasizes testing and automation in electronics, JBT Marel focuses on food and beverage processing technologies. Their business models diverge in target markets and types of solutions offered, highlighting the breadth of technology application across industries.
Income Statement Comparison
In this section, I present a comparison of the most recent income statements for Teradyne, Inc. (TER) and JBT Marel Corporation (JBTM) to help you evaluate their financial performance.
| Metric | Teradyne, Inc. (TER) | JBT Marel Corporation (JBTM) |
|---|---|---|
| Revenue | 2.82B | 1.72B |
| EBITDA | 732M | 204M |
| EBIT | 613M | 115M |
| Net Income | 542M | 85M |
| EPS | 3.41 | 2.67 |
Interpretation of Income Statement
The income statements for 2024 indicate that Teradyne, Inc. experienced solid revenue growth, increasing from 2.67B in 2023 to 2.82B in 2024, while JBT Marel Corporation also saw an increase, albeit less pronounced, from 1.66B to 1.72B. Teradyne’s net income grew significantly from 448M to 542M, reflecting improved operational efficiency despite a competitive market. JBTM’s net income remained stable at 85M, indicating consistent performance. Overall, Teradyne’s margins improved, suggesting effective cost management, while JBTM’s growth appears steady but limited, highlighting potential areas for operational improvement.
Financial Ratios Comparison
The following table presents a comparison of the most recent financial metrics and ratios for Company A (Teradyne, Inc.) and Company B (JBT Marel Corporation).
| Metric | Teradyne, Inc. | JBT Marel Corporation |
|---|---|---|
| ROE | 19.24% | 5.53% |
| ROIC | 17.25% | 3.65% |
| P/E | 36.93 | 47.63 |
| P/B | 7.11 | 2.63 |
| Current Ratio | 2.91 | 3.48 |
| Quick Ratio | 1.84 | 3.04 |
| D/E | 0.03 | 0.81 |
| Debt-to-Assets | 2.07% | 36.68% |
| Interest Coverage | 165.54 | 6.10 |
| Asset Turnover | 0.76 | 0.50 |
| Fixed Asset Turnover | 4.88 | 7.34 |
| Payout ratio | 14.09% | 15.34% |
| Dividend yield | 0.38% | 0.32% |
Interpretation of Financial Ratios
In analyzing these ratios, Teradyne displays stronger profitability indicators with higher ROE and ROIC, showcasing effective capital use. The P/E ratio suggests it is more expensive relative to earnings than JBT, which could imply higher growth expectations. However, JBT has a better current and quick ratio, indicating superior liquidity. The significantly lower debt levels in Teradyne reveal less financial risk, while JBT’s higher debt ratios raise concerns about leverage and financial stability. Overall, both companies have their strengths and weaknesses requiring careful consideration.
Dividend and Shareholder Returns
Teradyne, Inc. (TER) has a dividend payout ratio of approximately 14.1%, providing a dividend yield of 0.38%. The company supports its dividend through solid free cash flow, indicating a sustainable distribution strategy. In contrast, JBT Marel Corporation (JBTM) has a significantly lower dividend payout ratio of 2.2%, reflecting a high reinvestment strategy aimed at growth. Both companies engage in share buybacks, enhancing shareholder returns. Overall, TER’s approach appears more aligned with immediate shareholder value, while JBTM’s strategy may foster long-term growth potential.
Strategic Positioning
Teradyne, Inc. (TER) holds a significant market share in the semiconductor test equipment sector, leveraging advanced technology to cater to diverse applications, including automotive and consumer electronics. Meanwhile, JBT Marel Corporation (JBTM) is positioned within the industrial machinery market, focusing on food and beverage technology solutions. Both companies face competitive pressures, with technological advancements continuously reshaping their industries. As they navigate these challenges, maintaining a strong R&D focus will be crucial for sustaining their market positions.
Stock Comparison
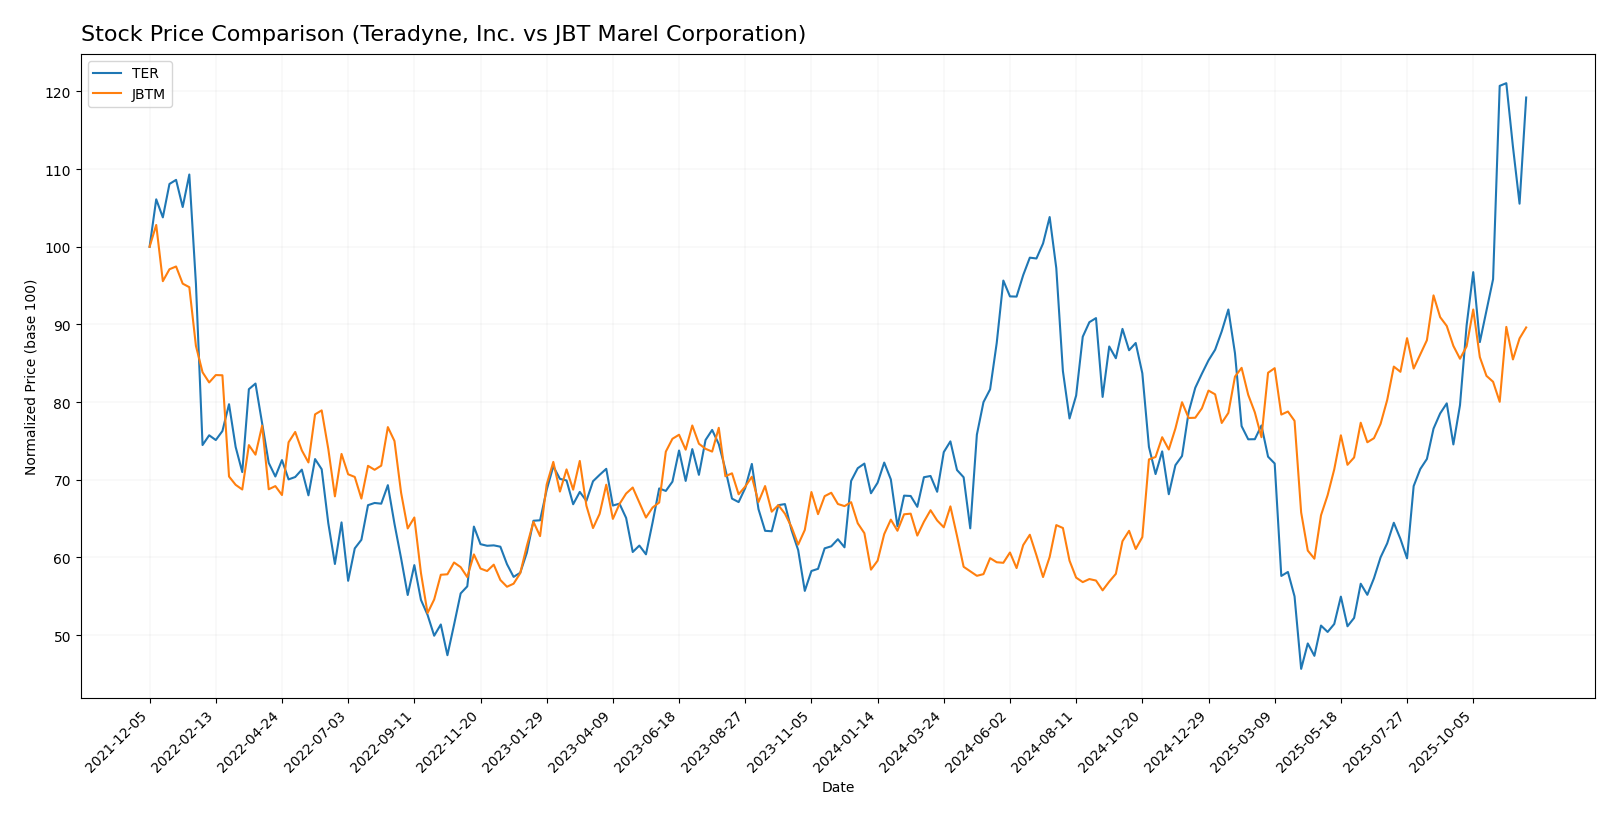
In this section, I will analyze the weekly stock price movements of Teradyne, Inc. (TER) and JBT Marel Corporation (JBTM) over the past year, highlighting key price fluctuations and trading dynamics that may influence investment decisions.
Trend Analysis
For Teradyne, Inc. (TER), the overall percentage change over the past year is +74.66%. This indicates a bullish trend, supported by a notable highest price of 182.28 and a lowest price of 68.72. The trend shows acceleration with a standard deviation of 24.47, suggesting significant price volatility.
In the recent period from September 14, 2025, to November 30, 2025, TER has experienced a price change of +59.93%, further reinforcing its bullish outlook. The standard deviation during this timeframe is 23.21, indicating ongoing volatility.
For JBT Marel Corporation (JBTM), the overall percentage change is +53.38%, also reflecting a bullish trend. The stock has seen a high of 147.7 and a low of 87.85. However, the trend is characterized by deceleration, with a standard deviation of 17.44, pointing to reduced volatility compared to TER.
In the recent analysis period from September 14, 2025, to November 30, 2025, JBTM’s price change is a modest +2.72%, placing it within a neutral trend. The standard deviation of 5.02 indicates lower volatility during this timeframe, with a trend slope of 0.05.
Overall, both stocks show positive long-term trends, but the level of volatility and recent price movements suggest different risk profiles for investors to consider.
Analyst Opinions
Recent recommendations for Teradyne, Inc. (TER) show a consensus rating of “Buy,” with analysts highlighting a strong return on assets (5) and a solid return on equity (4), indicating operational efficiency. In contrast, JBT Marel Corporation (JBTM) has received a “Hold” rating, attributed to lower performance metrics across key indicators, particularly return on equity (1). Analysts suggest caution with JBTM due to its weaker financials. Overall, I find the consensus leaning towards a positive outlook for TER while remaining cautious about JBTM’s potential.
Stock Grades
In the dynamic landscape of trading, it’s essential to stay informed about the latest stock ratings from reputable grading companies. Here’s a look at the current grades for Teradyne, Inc. and JBT Marel Corporation.
Teradyne, Inc. Grades
| Grading Company | Action | New Grade | Date |
|---|---|---|---|
| Citigroup | Maintain | Buy | 2025-11-12 |
| Goldman Sachs | Maintain | Sell | 2025-10-30 |
| JP Morgan | Maintain | Neutral | 2025-10-30 |
| UBS | Maintain | Buy | 2025-10-30 |
| Evercore ISI Group | Maintain | Outperform | 2025-10-30 |
| Stifel | Maintain | Hold | 2025-10-28 |
| Evercore ISI Group | Maintain | Outperform | 2025-10-28 |
| UBS | Maintain | Buy | 2025-10-20 |
| Morgan Stanley | Maintain | Equal Weight | 2025-10-14 |
| Stifel | Maintain | Hold | 2025-10-13 |
JBT Marel Corporation Grades
| Grading Company | Action | New Grade | Date |
|---|---|---|---|
| William Blair | Upgrade | Outperform | 2025-08-06 |
Overall, Teradyne, Inc. shows a mixed sentiment with multiple firms maintaining their grades while JBT Marel Corporation has received an upgrade to “Outperform.” This indicates a cautious but optimistic outlook for JBTM, whereas TER’s diverse opinions suggest a careful approach for investors.
Target Prices
The following target prices have been established by analysts for Teradyne, Inc. and JBT Marel Corporation, reflecting their market expectations.
| Company | Target High | Target Low | Consensus |
|---|---|---|---|
| Teradyne, Inc. (TER) | 215 | 119 | 172.67 |
| JBT Marel Corporation (JBTM) | 169 | 169 | 169 |
For Teradyne, the consensus price of 172.67 is slightly below the current market price of 179.38, indicating a potential for modest price corrections. In contrast, JBT Marel’s consensus matches its stock price, suggesting a stable outlook.
Strengths and Weaknesses
The following table outlines the strengths and weaknesses of Teradyne, Inc. (TER) and JBT Marel Corporation (JBTM) based on the most recent data.
| Criterion | Teradyne, Inc. | JBT Marel Corporation |
|---|---|---|
| Diversification | High | Moderate |
| Profitability | Strong (19.23% net margin) | Moderate (4.98% net margin) |
| Innovation | High (advanced tech in semiconductors) | Moderate (food processing solutions) |
| Global presence | Extensive | Good |
| Market Share | Significant | Moderate |
| Debt level | Low (2.07% debt-to-equity) | High (81.08% debt-to-equity) |
Key takeaways: Teradyne demonstrates strong profitability and low debt levels, making it a robust choice for investors. Conversely, JBT Marel, while diversified, carries higher debt and lower profitability, indicating more risk.
Risk Analysis
In this section, I will outline key risks associated with two companies, Teradyne, Inc. and JBT Marel Corporation, to help you understand potential challenges.
| Metric | Teradyne, Inc. | JBT Marel Corporation |
|---|---|---|
| Market Risk | High | Moderate |
| Regulatory Risk | Moderate | High |
| Operational Risk | Low | Moderate |
| Environmental Risk | Low | High |
| Geopolitical Risk | Moderate | High |
Both companies face significant market and regulatory risks, with JBT Marel being more exposed to environmental and geopolitical challenges. Recent supply chain issues and fluctuations in commodity prices could impact their financial performance.
Which one to choose?
When comparing Teradyne, Inc. (TER) and JBT Marel Corporation (JBTM), the fundamentals suggest that TER may be the more profitable choice for investors. TER exhibits robust financial health with a market cap of approximately 20B, a net profit margin of 19.23%, and a solid return on equity (ROE) of 19.24%. In contrast, JBTM has a lower market cap of 4B, with a net profit margin of 4.98% and an ROE of 5.53%.
Analyst ratings reflect this sentiment, with TER receiving a “B” rating compared to JBTM’s “C.” The stock trends are also favorable for TER, showing a bullish trend with a 74.66% price change over the past year, while JBTM shows deceleration despite a 53.38% increase. However, JBTM’s industry faces significant competition and market dependence, which may present risks.
Recommendation: Investors focused on growth may prefer TER, while those prioritizing a lower-risk profile may find JBTM appealing.
Disclaimer: This article is not financial advice. Each investor is responsible for their own investment decisions.
Go further
I encourage you to read the complete analyses of Teradyne, Inc. and JBT Marel Corporation to enhance your investment decisions: