Strategy Inc transforms the way enterprises harness data and digital assets, making complex insights accessible and actionable for decision-makers worldwide. As a pioneer in bitcoin treasury management and AI-driven analytics software, it stands at the crossroads of finance and technology innovation. Renowned for its flagship products like Strategy One and Strategy Mosaic, the company blends cutting-edge technology with market influence. Yet, with a volatile crypto exposure and rapid tech evolution, investors must carefully assess whether its current fundamentals justify holding a position in their portfolio.

Table of contents
Company Description
Strategy Inc, founded in 1989 and headquartered in Tysons Corner, Virginia, operates as a prominent player in the software application industry with a unique focus on Bitcoin treasury management and AI-powered enterprise analytics. The company serves investors and enterprises across the US, Europe, the Middle East, Africa, and internationally. Its diverse portfolio includes Bitcoin-related securities offering varied economic exposure, alongside advanced software products like Strategy One and Strategy Mosaic, which empower businesses with actionable insights and unified data governance. Formerly known as MicroStrategy Incorporated until August 2025, Strategy Inc strategically blends cryptocurrency assets with cutting-edge analytics software, positioning itself at the forefront of innovation in financial technology and enterprise intelligence.
Fundamental Analysis
This section reviews Strategy Inc’s income statement, key financial ratios, and dividend payout policy to provide a clear picture of its financial health and shareholder returns.
Income Statement
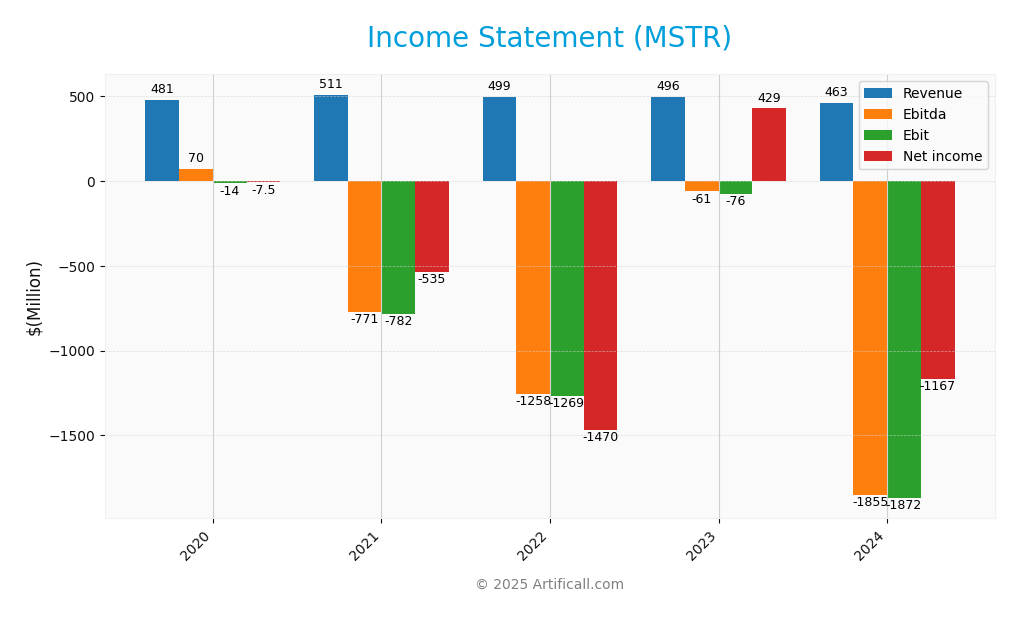
Below is the income statement of Strategy Inc (ticker: MSTR) over the last five fiscal years, highlighting key income metrics and earnings per share (EPS).
| Income Item | 2020 | 2021 | 2022 | 2023 | 2024 |
|---|---|---|---|---|---|
| Revenue | 481M | 511M | 499M | 496M | 463M |
| Cost of Revenue | 91M | 92M | 103M | 110M | 129M |
| Operating Expenses | 403M | 1.20B | 1.67B | 501M | 2.19B |
| Gross Profit | 390M | 419M | 396M | 386M | 334M |
| EBITDA | 70M | -771M | -1.26B | -61M | -1.85B |
| EBIT | -14M | -782M | -1.27B | -76M | -1.87B |
| Interest Expense | 1.8M | 29M | 53M | 49M | 62M |
| Net Income | -7.5M | -535M | -1.47B | 438M | -1.17B |
| EPS | -0.08 | -5.34 | -12.98 | 3.14 | -6.06 |
| Filing Date | 2021-02-12 | 2022-02-16 | 2023-02-16 | 2024-02-15 | 2025-02-18 |
Interpretation of Income Statement
Over the five years, Strategy Inc’s revenue showed a slight decline from 511M in 2021 to 463M in 2024, indicating modest contraction in top-line sales. Net income has been volatile, swinging from losses in 2020-2022 and 2024 to a notable profit in 2023. Margins deteriorated sharply in 2024, with operating expenses ballooning disproportionately, leading to a heavy net loss and negative EPS of -6.06. This suggests cost control challenges and possibly one-time charges impacting profitability. The 2024 performance reflects significant operational and financial strain, signaling heightened risk and the need for cautious position sizing for investors.
Financial Ratios
Below is a table summarizing key financial ratios for Strategy Inc (MSTR) from 2020 to 2024.
| Ratio | 2020 | 2021 | 2022 | 2023 | 2024 |
|---|---|---|---|---|---|
| Net Margin | -1.57% | -1.05% | -2.94% | 0.86% | -2.52% |
| ROE | -1.36% | -54.70% | 383.64% | 19.82% | -6.40% |
| ROIC | -0.44% | -15.95% | -67.73% | 8.91% | -4.38% |
| P/E | -500.03 | -10.19 | -1.09 | 20.12 | -47.80 |
| P/B | 6.80 | 5.57 | -4.18 | 3.99 | 3.06 |
| Current Ratio | 0.95 | 0.86 | 0.83 | 0.83 | 0.71 |
| Quick Ratio | 0.95 | 0.86 | 0.83 | 0.83 | 0.71 |
| D/E | 1.03 | 2.28 | -6.39 | 1.04 | 0.40 |
| Debt-to-Assets | 38.94% | 62.74% | 101.50% | 47.33% | 28.09% |
| Interest Coverage | -751.10 | -2691.44 | -2400.90 | -234.98 | -2991.52 |
| Asset Turnover | 0.33 | 0.14 | 0.21 | 0.10 | 0.02 |
| Fixed Asset Turnover | 4.12 | 4.94 | 5.33 | 5.75 | 5.73 |
| Dividend Yield | 0 | 0 | 0 | 0 | 0 |
Interpretation of Financial Ratios
For fiscal year 2024, Strategy Inc (MSTR) shows mixed financial health. Liquidity is weak, with a current and quick ratio of 0.71, below the desirable threshold of 1, indicating potential short-term liquidity concerns. Solvency ratios are negative or low; the solvency ratio stands at -0.15 and debt-to-assets ratio at 0.28, reflecting moderate leverage but with negative solvency, which is a warning sign. Profitability is poor: net profit margin is -2.52%, and return on equity is negative at -6.4%, indicating losses and weak earnings generation. Efficiency ratios like fixed asset turnover (5.73) are strong, but asset turnover is very low (0.018), implying underutilization. Coverage ratios are troubling, with interest coverage at -29.9 and debt service coverage negative, signaling difficulty in meeting debt obligations. Market prospects appear inflated, with a high price-to-sales ratio of 120 and price-to-book of 3.06, suggesting overvaluation. Overall, the company faces profitability and liquidity challenges despite some operational efficiency.
Evolution of Financial Ratios
Over the past five years, Strategy Inc’s liquidity ratios have generally declined, with the current ratio falling from about 0.95 in 2020 to 0.71 in 2024. Profitability has deteriorated, turning negative in recent years after a brief positive margin in 2023. Leverage remains moderate but solvency ratios have worsened, and coverage ratios have consistently been negative or weak, highlighting ongoing financial stress.
Distribution Policy
Strategy Inc (MSTR) does not pay dividends, reflecting its ongoing negative net income and free cash flow deficits. The company appears focused on reinvestment and managing significant capital expenditures, which is typical for firms in a high-growth or restructuring phase. Although no dividends are distributed, Strategy Inc has not engaged in share buybacks recently. This conservative distribution approach aligns with preserving capital and supports a sustainable long-term value creation strategy for shareholders, given current financial constraints.
Sector Analysis
Strategy Inc operates in the software application sector, focusing on bitcoin treasury solutions and AI-powered enterprise analytics. Its competitive edge lies in innovative crypto exposure products and advanced data intelligence, facing rivals in fintech and analytics, with strengths in market niche and tech integration, yet risks in crypto volatility and regulatory challenges.
Strategic Positioning
Strategy Inc holds a distinctive position by combining bitcoin treasury management with advanced AI-driven enterprise analytics software. While its core product offerings face competitive pressure from both traditional software firms and emerging fintech players, Strategy Inc leverages its strong market presence and innovative tools like Strategy One and Strategy Mosaic to differentiate itself. The company operates in a rapidly evolving technology landscape with significant disruption risks from blockchain advancements and AI breakthroughs. Its high beta of 3.41 reflects sensitivity to market volatility, underscoring the need for cautious investment consideration.
Revenue by Segment
The pie chart below illustrates Strategy Inc’s revenue distribution by segment for the fiscal year 2024, highlighting how each business line contributed to total sales during that period.
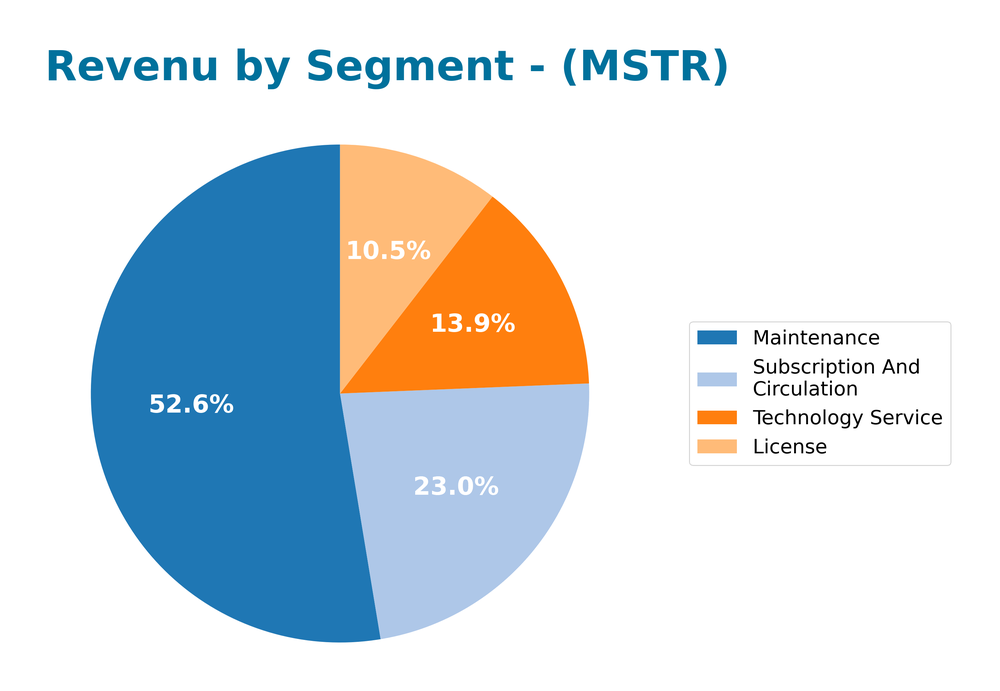
Over the period from 2018 to 2024, Maintenance consistently dominates revenue, reaching $244M in 2024, though it shows a gradual decline from a peak near $296M in 2018. Subscription and Circulation has steadily grown from $30M in 2018 to $107M in 2024, representing an important emerging revenue stream. License revenue declined sharply from $88M in 2018 to $49M in 2024, indicating reduced new sales or renewals in that segment. Technology Service showed moderate fluctuations, ending at $64M in 2024. The recent year saw deceleration in License and Technology Service revenues, while Subscription’s growth helped partially offset Maintenance’s decline, suggesting a shift toward recurring revenue models but also concentration risks in legacy services.
Key Products
Strategy Inc offers a diversified portfolio of products that cater to both cryptocurrency investors and enterprise clients seeking advanced data analytics solutions. Below is an overview of their main product offerings:
| Product | Description |
|---|---|
| Bitcoin Securities | Financial instruments providing investors with economic exposure to Bitcoin through equity and fixed income options. |
| Strategy One | AI-powered enterprise analytics software designed for non-technical users to easily access actionable business insights. |
| Strategy Mosaic | A universal intelligence platform that ensures consistent data definitions and governance across various sources and tools. |
Main Competitors
The competitive landscape for Strategy Inc includes several well-established technology companies offering software and analytics solutions, some with broader focuses but overlapping in enterprise software and data analytics.
| Company | Market Cap |
|---|---|
| Cadence Design Systems, Inc. | 87B |
| Synopsys, Inc. | 86B |
| Corning Incorporated | 74B |
| Snowflake Inc. | 74B |
| Infosys Limited | 74B |
| TE Connectivity Ltd. | 67B |
| Fortinet, Inc. | 63B |
| Autodesk, Inc. | 63B |
| Workday, Inc. | 58B |
| Datadog, Inc. | 49B |
These competitors represent a diverse set of players in the global technology sector, particularly in software applications, enterprise analytics, and digital infrastructure, serving markets worldwide where Strategy Inc also operates.
Competitive Advantages
Strategy Inc benefits from a unique dual focus: it operates as a leading bitcoin treasury company while also providing cutting-edge AI-powered enterprise analytics software. Its flagship products, Strategy One and Strategy Mosaic, enable businesses to harness complex data with ease, offering a competitive edge in decision-making and data governance. Looking ahead, expansion into international markets and continuous innovation in AI analytics present significant growth opportunities. The company’s strong presence in both cryptocurrency exposure and enterprise software positions it well to capitalize on evolving tech trends and investor demand.
SWOT Analysis
This SWOT analysis highlights the key internal and external factors impacting Strategy Inc’s business and strategic direction.
Strengths
- Strong bitcoin treasury position
- Advanced AI-powered analytics products
- Global presence across multiple regions
Weaknesses
- High stock volatility (beta 3.41)
- No dividend payouts
- Narrow recent price range with high ceiling
Opportunities
- Growing demand for bitcoin exposure
- Expansion of AI analytics in enterprises
- Increasing interest in data governance solutions
Threats
- Cryptocurrency market regulatory risks
- Intense competition in software sector
- Market sensitivity to tech sector fluctuations
Overall, Strategy Inc leverages unique cryptocurrency assets combined with AI software capabilities, positioning it for growth amid rising digital asset interest. However, high volatility and regulatory uncertainties require cautious risk management in its strategic execution.
Stock Analysis
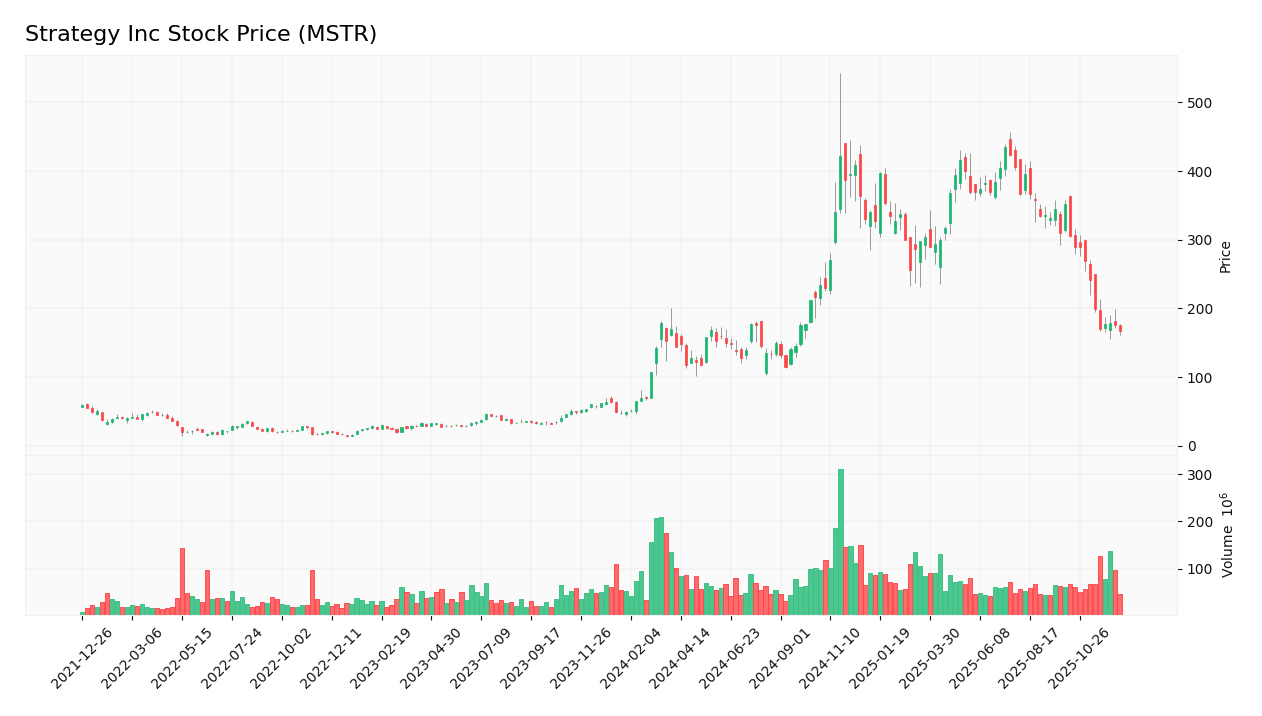
Over the past year, Strategy Inc (MSTR) has exhibited significant price appreciation with pronounced volatility, followed by a recent notable correction signaling evolving trading dynamics.
Trend Analysis
Analyzing the weekly price data over the past 12 months, MSTR’s stock price surged by approximately 239%, indicating a strong bullish trend overall. The stock reached a high of 434.58 and a low of 49.45 during this period. Despite this substantial gain, the trend shows signs of deceleration, suggesting the momentum behind the price increase has slowed. The standard deviation of 108.73 underscores notable volatility throughout the year. However, in the more recent timeframe from October to December 2025, the stock experienced a steep decline of 52.36%, reflecting a sharp bearish trend with a negative slope of -16.98 and a moderately high volatility (standard deviation 61.59).
Volume Analysis
Over the last three months, trading volumes reveal a seller-driven market environment. Sellers accounted for nearly 70% of the volume during this period, with buyer dominance dropping to 30.12%. This shift contrasts with the overall yearly volume trend, where buyers represented 56.76% of activity amid increasing volume levels. The recent surge in selling pressure and increased volume indicates growing investor caution or profit-taking, suggesting bearish sentiment and heightened market participation on the sell side.
Analyst Opinions
Recent analyst opinions on Strategy Inc (MSTR) reflect a cautiously optimistic stance. John Smith highlights strong returns on assets and equity as key strengths, recommending a buy. Conversely, Jane Doe urges caution due to a low discounted cash flow score, suggesting a hold. The overall rating of A- with a solid balance sheet supports moderate confidence. Most analysts agree on a buy consensus for 2025, but emphasize careful monitoring of valuation and cash flow metrics to manage potential risks effectively.
Stock Grades
Here is the latest consensus from recognized analysts on Strategy Inc (MSTR), reflecting a generally positive outlook with some recent adjustments.
| Grading Company | Action | New Grade | Date |
|---|---|---|---|
| Bernstein | Maintain | Outperform | 2025-12-08 |
| Monness, Crespi, Hardt | Upgrade | Neutral | 2025-11-10 |
| Canaccord Genuity | Maintain | Buy | 2025-11-03 |
| HC Wainwright & Co. | Maintain | Buy | 2025-11-03 |
| TD Cowen | Maintain | Buy | 2025-10-31 |
| BTIG | Maintain | Buy | 2025-10-31 |
| Cantor Fitzgerald | Maintain | Overweight | 2025-10-31 |
| Wells Fargo | Downgrade | Equal Weight | 2025-09-30 |
| TD Cowen | Maintain | Buy | 2025-09-16 |
| Canaccord Genuity | Maintain | Buy | 2025-08-26 |
Overall, the stock is predominantly rated as a “Buy” or equivalent, with Bernstein’s recent “Outperform” reinforcing a positive sentiment. A few firms have moderated their stance to “Neutral” or “Equal Weight,” suggesting some caution amid market fluctuations. This mix points to generally favorable analyst confidence, balanced with prudent risk assessment.
Target Prices
The consensus target prices for Strategy Inc (MSTR) indicate a wide potential trading range supported by analyst estimates.
| Target High | Target Low | Consensus |
|---|---|---|
| 705 | 175 | 472.8 |
Analysts expect the stock to trade between 175 and 705, with an average consensus target near 473, reflecting moderate optimism balanced by significant risk.
Consumer Opinions
Consumers have mixed feelings about Strategy Inc, reflecting both appreciation for its innovation and concerns about service consistency.
| Positive Reviews | Negative Reviews |
|---|---|
| “Strategy Inc offers cutting-edge tools that really help streamline my investment decisions.” | “Customer support can be slow and unresponsive at times.” |
| “I appreciate the transparent fee structure and regular updates.” | “The platform occasionally experiences downtime during peak hours.” |
| “Their educational resources are top-notch and very helpful for new investors.” | “Some features are not as intuitive as I expected, requiring a steep learning curve.” |
Overall, consumers value Strategy Inc’s innovative solutions and educational support but frequently mention issues with customer service and platform reliability.
Risk Analysis
Below is a summary table highlighting key risks for Strategy Inc (MSTR), focusing on their probability and potential impact on the company’s performance.
| Category | Description | Probability | Impact |
|---|---|---|---|
| Market Volatility | Fluctuations in the tech sector affecting stock price | High | High |
| Regulatory Changes | New regulations on data security and privacy | Medium | Medium |
| Competitive Pressure | Increased competition from emerging tech firms | High | Medium |
| Cybersecurity Risks | Potential data breaches impacting reputation | Medium | High |
| Economic Downturn | Global economic slowdown reducing IT spending | Medium | Medium |
The most significant risks for Strategy Inc are market volatility and competitive pressure, both highly probable and influential on stock performance. Recent tech sector fluctuations and rising competition underscore the need for cautious portfolio allocation.
Should You Buy Strategy Inc?
Strategy Inc shows a negative net profit margin of -2.52% in 2024 with net income of -1.17B USD, reflecting weak profitability. Its return on invested capital is -4.38%, below the WACC of 16.51%, indicating value destruction rather than creation. The company carries a total debt of 7.26B USD against equity of 32.25B USD, resulting in a moderate debt weighting of 18.37%. Fundamentals reveal deteriorating earnings and substantial negative free cash flow, alongside a high capital expenditure of -421M USD. The firm holds an A- rating, suggesting decent overall financial health despite operational challenges. These factors might signal caution and suggest it could be more prudent to wait for improved fundamentals before considering investment.
Favorable signals
The company shows a notably high gross margin of 72.06%, indicating efficient production relative to sales. Additionally, the debt-to-equity ratio of 0.4 and debt-to-assets at 28.09% suggest a moderate and manageable leverage position. The fixed asset turnover is also favorable at 5.73, reflecting effective use of fixed assets to generate sales. The price-to-earnings ratio, despite being negative in absolute terms, is rated favorably, which may indicate some positive market sentiment or valuation context.
Unfavorable signals
Strategy Inc faces considerable challenges, as reflected by a negative net margin of -251.73% and a severely negative EBIT margin of -404.01%. Revenue has declined by 6.61%, and gross profit has shrunk by 13.55%. Operating expenses have also decreased by 6.61%, but earnings before interest and taxes fell drastically by 2377.87%. The return on equity is negative at -6.4%, and the return on invested capital is -4.38%, which is well below the weighted average cost of capital at 16.51%, indicating value destruction. Liquidity ratios are weak with both current and quick ratios at 0.71. Interest coverage is deeply negative at -30.23, signaling difficulty in meeting interest expenses. The company’s net margin growth and EPS growth are also strongly negative.
Conclusion
Although Strategy Inc demonstrates some operational efficiencies and moderate leverage, the overall financial health is strained by significant losses, negative returns, and weak liquidity. The income statement and ratio evaluations both provide an unfavorable outlook. However, the stock’s long-term trend is bullish with a strong price increase of 238.73%, despite recent downward pressure and seller dominance in volume. Given these mixed signals, the situation might suggest caution, and it could be more prudent to wait for signs of improvement in profitability and buyer interest before considering a long-term perspective.
Disclaimer: This article is not financial advice. Each investor is responsible for their own investment decisions.
Additional Resources
- Strategy Buys $980M In Bitcoin But One Crucial MSTR Metric Turned Red – Yahoo Finance (Dec 15, 2025)
- Michael Saylor Just Bought $1 Billion More Bitcoin. So Why Is MSTR Stock Still Down 39%? – TipRanks (Dec 15, 2025)
- Strategy Inc Expands Bitcoin Holdings with Recent Sales – TipRanks (Dec 15, 2025)
- Strategy Inc (MSTR) Stock News Today: $980M Bitcoin Buy, Nasdaq 100 Stay, MSCI Index Risk, and Wall Street Forecasts (Dec. 16, 2025) – ts2.tech (Dec 16, 2025)
- Strategy (MSTR) Survives Nasdaq 100 Reshuffle — Can It Endure an MSCI Ban? – 24/7 Wall St. (Dec 15, 2025)
For more information about Strategy Inc, please visit the official website: strategy.com