In the dynamic world of technology, two companies stand out in the semiconductor industry: STMicroelectronics N.V. (STM) and Silicon Laboratories Inc. (SLAB). Both companies are at the forefront of innovation, providing essential components for a range of applications, from automotive to IoT solutions. With their overlapping markets and distinct strategies, comparing STM and SLAB can reveal compelling insights for investors. Join me as we explore which of these companies offers the most promising investment opportunity.
Table of contents
Company Overview
STMicroelectronics N.V. Overview
STMicroelectronics N.V. (Ticker: STM) is a leading player in the semiconductor industry, focusing on the design, development, and manufacturing of a diverse range of semiconductor products. With a market capitalization of approximately $20.3B, STMicroelectronics operates through various segments, including Automotive and Discrete, Analog, MEMS and Sensors, and Microcontrollers and Digital ICs. The company caters to multiple sectors, such as automotive, industrial, personal electronics, and communications. Headquartered in Schiphol, the Netherlands, STMicroelectronics is committed to innovation and sustainability, aiming to drive advancements in technology that enhance everyday life.
Silicon Laboratories Inc. Overview
Silicon Laboratories Inc. (Ticker: SLAB), a fabless semiconductor company based in Austin, Texas, specializes in providing analog-intensive mixed-signal solutions. With a market cap of around $4.1B, Silicon Labs focuses on the Internet of Things (IoT) applications, delivering wireless microcontrollers and sensor products for connected devices. Its offerings target diverse sectors, including industrial automation, smart home technology, and medical instrumentation. Since its founding in 1996, Silicon Labs has built a reputation for excellence in design and innovation, positioning itself as a key enabler of smart, connected solutions globally.
Key Similarities and Differences
While both companies operate within the semiconductor industry, STMicroelectronics has a broader product range, serving multiple sectors including automotive and industrial applications, whereas Silicon Laboratories specializes primarily in IoT and mixed-signal solutions. Additionally, STMicroelectronics has a significantly larger market capitalization and employee base compared to Silicon Labs, reflecting its extensive global reach and operational scale.
Income Statement Comparison
The following table compares the most recent income statements of STMicroelectronics N.V. (STM) and Silicon Laboratories Inc. (SLAB), highlighting key financial metrics for analysis.
| Metric | STM | SLAB |
|---|---|---|
| Revenue | 13.27B | 584.39M |
| EBITDA | 3.72B | -104.92M |
| EBIT | 1.96B | -153.50M |
| Net Income | 1.56B | -191.01M |
| EPS | 1.73 | -5.93 |
Interpretation of Income Statement
In the latest year, STM reported a decline in revenue to 13.27B, down from 17.29B in the previous year, which reflects a challenging market environment. However, STM’s EBITDA margin remains robust, indicating effective cost management despite lower sales. Conversely, SLAB experienced a significant drop in revenue to 584.39M from 782.26M, leading to negative margins and a net loss of 191.01M. This performance suggests ongoing operational challenges and potential restructuring needs. Overall, STM displays resilience with positive earnings, while SLAB’s recent trends warrant caution for investors.
Financial Ratios Comparison
In this section, I present a comparative analysis of key financial metrics for STMicroelectronics N.V. (STM) and Silicon Laboratories Inc. (SLAB). The table includes the most recent revenue and financial ratios to help in evaluating their performance.
| Metric | STM | SLAB |
|---|---|---|
| ROE | 25.17% | -17.69% |
| ROIC | 6.34% | -18.15% |
| P/E | 10.76 | -121.88 |
| P/B | 1.29 | 3.48 |
| Current Ratio | 3.11 | 6.15 |
| Quick Ratio | 2.37 | 5.07 |
| D/E | 0.18 | 0.05 |
| Debt-to-Assets | 12.80% | 4.49% |
| Interest Coverage | 19.72 | -126.33 |
| Asset Turnover | 0.54 | 0.48 |
| Fixed Asset Turnover | 1.22 | 4.42 |
| Payout Ratio | 18.50% | 0.00% |
| Dividend Yield | 1.28% | 0.00% |
Interpretation of Financial Ratios
The financial ratios indicate that STM is performing significantly better than SLAB across most metrics. STM boasts a healthy ROE and ROIC, while SLAB’s negative returns raise concerns about profitability. Additionally, STM’s strong current and quick ratios suggest robust liquidity compared to SLAB’s, which, despite being high, reflects potential inefficiencies in asset management. The high interest coverage for STM further implies a strong capacity to meet its debt obligations, contrasting sharply with SLAB’s negative coverage. These factors should be carefully considered when evaluating potential investments in these companies.
Dividend and Shareholder Returns
STMicroelectronics N.V. (STM) pays dividends, with a current yield of 1.28% and a payout ratio of 18.5%, indicating a sustainable approach to shareholder returns. The company has also engaged in share buybacks, further supporting its commitment to returning value. In contrast, Silicon Laboratories Inc. (SLAB) does not pay dividends, likely due to its focus on growth and reinvestment strategies. This approach may align with long-term shareholder value creation, but carries risks if profitability does not improve.
Strategic Positioning
STMicroelectronics N.V. (STM) holds a significant market share in the semiconductor industry, particularly in automotive and industrial applications, driven by a diverse product portfolio that includes integrated circuits and sensors. In contrast, Silicon Laboratories Inc. (SLAB) focuses on analog-intensive mixed-signal solutions for IoT applications, competing in a niche market. Both companies face competitive pressure from rapidly advancing technologies and must continuously innovate to maintain their positions. With STM’s broader market reach and SLAB’s specialized offerings, their strategies reflect different approaches to navigating technological disruptions.
Stock Comparison
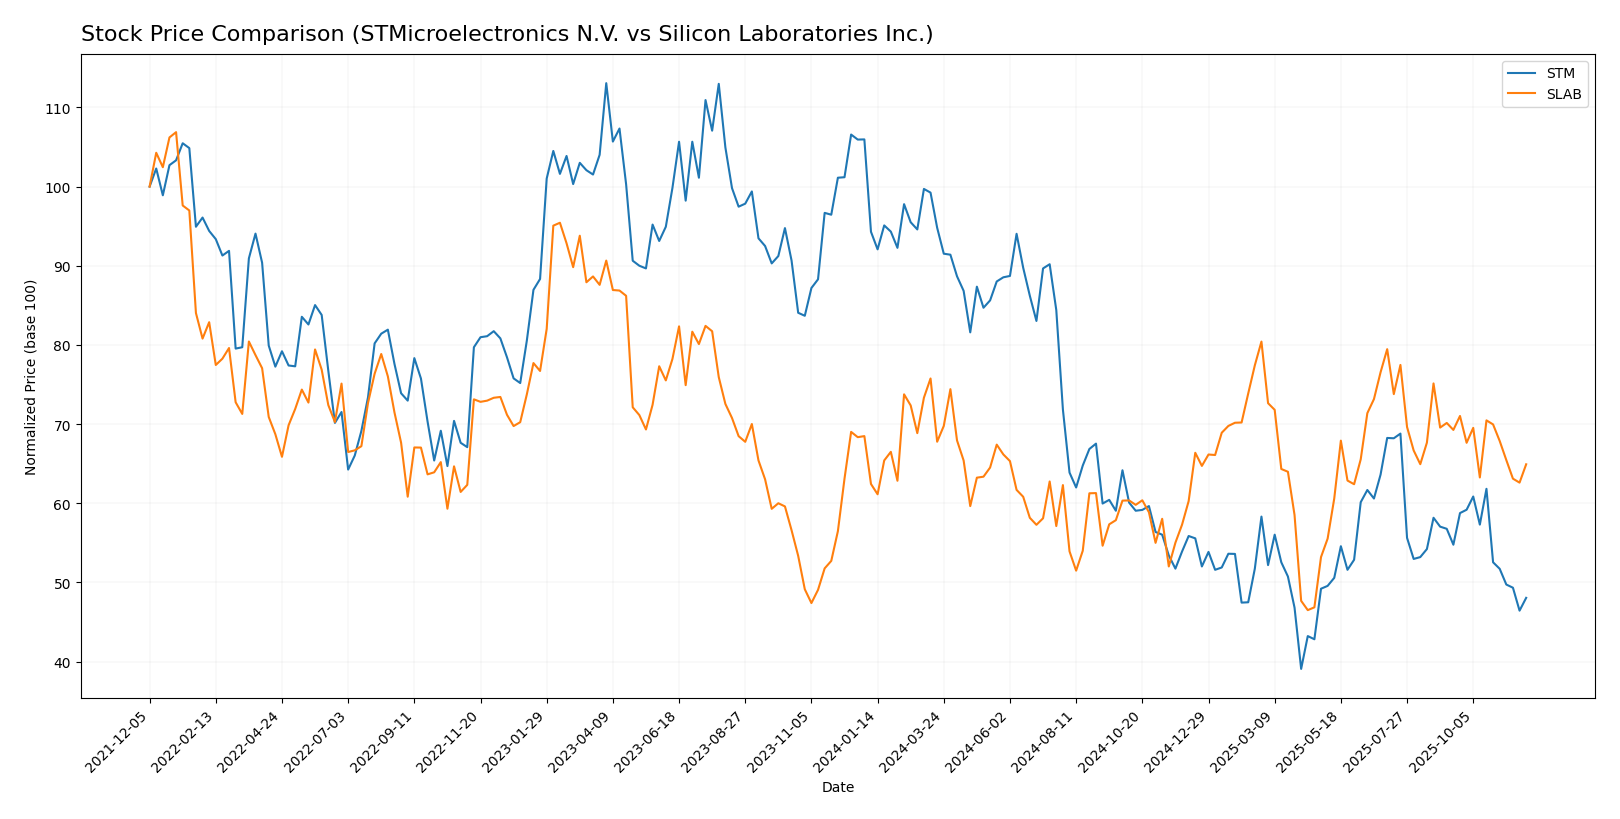
In reviewing the weekly stock price movements for STMicroelectronics N.V. (STM) and Silicon Laboratories Inc. (SLAB) over the past year, we observe significant fluctuations and differing trading dynamics that investors should consider before making decisions.
Trend Analysis
STMicroelectronics N.V. (STM) has experienced a substantial decrease of -49.04% over the past year, indicating a bearish trend. This trend has shown deceleration, with notable highs at 47.17 and lows at 18.49. Additionally, the recent trend from September 14, 2025, to November 30, 2025, reflects a further decline of -12.25% with a standard deviation of 2.4, suggesting increased volatility in this timeframe.
Silicon Laboratories Inc. (SLAB) has recorded an overall increase of 3.98% in the past year, categorized as a bullish trend. However, the recent analysis from September 14, 2025, to November 30, 2025, shows a decline of -6.27%, with a standard deviation of 5.71, indicating a slight downward pressure despite the overall positive performance. The highest price during this period was 155.33, while the lowest was 89.82.
Both stocks demonstrate significant movements, but investors should exercise caution, particularly with STM’s pronounced bearish trend and SLAB’s recent downturn amidst an otherwise optimistic outlook.
Analyst Opinions
Recent analyst recommendations for STMicroelectronics N.V. (STM) highlight a “Buy” rating, with notable support from analysts who emphasize its strong return on assets and favorable price-to-book ratio. The overall score of 3 indicates solid performance metrics. In contrast, Silicon Laboratories Inc. (SLAB) has received a “Sell” rating, with analysts citing weak return on equity and a concerning debt-to-equity ratio, reflected in its overall score of 1. The consensus for STM is a Buy, while SLAB leans towards Sell for the current year.
Stock Grades
In today’s analysis, I present the latest stock ratings for STMicroelectronics N.V. (STM) and Silicon Laboratories Inc. (SLAB), based on reliable assessments from reputable grading companies.
STMicroelectronics N.V. Grades
| Grading Company | Action | New Grade | Date |
|---|---|---|---|
| TD Cowen | maintain | Buy | 2025-10-24 |
| Susquehanna | maintain | Positive | 2025-10-22 |
| Susquehanna | maintain | Positive | 2025-07-25 |
| Susquehanna | maintain | Positive | 2025-07-22 |
| Baird | upgrade | Outperform | 2025-07-22 |
| Jefferies | upgrade | Buy | 2025-02-19 |
| Bernstein | downgrade | Market Perform | 2025-02-05 |
| Susquehanna | maintain | Positive | 2025-01-31 |
| Barclays | downgrade | Underweight | 2025-01-22 |
| JP Morgan | downgrade | Neutral | 2024-12-09 |
Silicon Laboratories Inc. Grades
| Grading Company | Action | New Grade | Date |
|---|---|---|---|
| Susquehanna | maintain | Neutral | 2025-08-06 |
| Morgan Stanley | maintain | Equal Weight | 2025-08-06 |
| Barclays | maintain | Equal Weight | 2025-08-05 |
| Susquehanna | maintain | Neutral | 2025-07-22 |
| Stifel | maintain | Buy | 2025-07-18 |
| Keybanc | maintain | Overweight | 2025-07-08 |
| Benchmark | maintain | Buy | 2025-05-27 |
| Needham | maintain | Buy | 2025-05-14 |
| Benchmark | maintain | Buy | 2025-05-14 |
| Susquehanna | maintain | Neutral | 2025-05-14 |
Overall, STMicroelectronics shows a positive trend with several upgrades and consistent positive ratings, indicating strong market confidence. Meanwhile, Silicon Laboratories maintains a stable position with several neutral ratings, suggesting cautious investor sentiment.
Target Prices
The current consensus target prices for STM and SLAB indicate positive growth potential according to analysts.
| Company | Target High | Target Low | Consensus |
|---|---|---|---|
| STMicroelectronics | 45 | 22 | 33.38 |
| Silicon Laboratories | 165 | 130 | 147.5 |
For STMicroelectronics, the target consensus of 33.38 suggests a significant upside from the current price of 22.745. Similarly, Silicon Laboratories has a consensus target of 147.5, indicating strong growth potential from its current price of 125.54. Both companies show promising outlooks based on analyst expectations.
Strengths and Weaknesses
The following table outlines the strengths and weaknesses of STMicroelectronics N.V. (STM) and Silicon Laboratories Inc. (SLAB) based on the most recent data.
| Criterion | STMicroelectronics N.V. | Silicon Laboratories Inc. |
|---|---|---|
| Diversification | High | Moderate |
| Profitability | Strong (Net Margin: 24%) | Weak (Net Margin: -4.4%) |
| Innovation | High | Moderate |
| Global presence | Strong | Moderate |
| Market Share | Strong | Growing |
| Debt level | Low (Debt/Equity: 0.19) | Very Low (Debt/Equity: 0.05) |
Key takeaways from the analysis indicate that while STMicroelectronics demonstrates robust profitability and low debt levels, Silicon Laboratories is facing challenges with profitability but shows potential in market growth.
Risk Analysis
In the table below, I summarize the various risks associated with STMicroelectronics N.V. (STM) and Silicon Laboratories Inc. (SLAB).
| Metric | STM | SLAB |
|---|---|---|
| Market Risk | Moderate | High |
| Regulatory Risk | Low | Moderate |
| Operational Risk | Moderate | High |
| Environmental Risk | Low | Moderate |
| Geopolitical Risk | Moderate | High |
Both companies face significant market and operational risks due to fluctuating semiconductor demand and supply chain disruptions. SLAB’s high operational risk stems from negative profit margins, reflecting ongoing challenges.
Which one to choose?
In comparing STMicroelectronics (STM) and Silicon Laboratories (SLAB), STM shows stronger fundamentals with a market cap of 22.47B compared to SLAB’s 4.11B. STM has a gross profit margin of 39.34% and a net profit margin of 11.73%, while SLAB reported negative margins. STM’s price-to-earnings (P/E) ratio stands at 14.43, significantly more favorable than SLAB’s negative P/E. Analyst ratings also reflect this, with STM rated B+ versus SLAB’s C-. Stock trends indicate STM is currently in a bearish trend with a -49.04% change, while SLAB shows a bullish trend with a modest 3.98% increase.
Investors focused on stability and growth may prefer STM, while those willing to take risks for potentially high returns might consider SLAB, understanding the inherent risks in its volatile performance and negative margins.
Disclaimer: This article is not financial advice. Each investor is responsible for their own investment decisions.
Go further
I encourage you to read the complete analyses of STMicroelectronics N.V. and Silicon Laboratories Inc. to enhance your investment decisions: