Imagine a world where the safety of skies and the effectiveness of defense systems hinge on the innovations of a single company. RTX Corporation plays a pivotal role in the Aerospace & Defense industry, revolutionizing air travel and military capabilities with its advanced technology and services. Known for its cutting-edge engines and comprehensive aerospace solutions, RTX’s commitment to quality and innovation sets it apart as a market leader. As we delve into this analysis, we must consider whether RTX’s robust fundamentals adequately support its current market valuation and growth trajectory.
Table of contents
Company Description
RTX Corporation, founded in 1934 and headquartered in Arlington, Virginia, stands as a prominent player in the aerospace and defense sector. With a market capitalization of approximately $232B, RTX operates through three key segments: Collins Aerospace, Pratt & Whitney, and Raytheon. The company delivers a wide range of products and services, including advanced aircraft systems, military engines, and cutting-edge defense technologies. RTX serves both commercial and military customers across the globe, ensuring a strong foothold in the U.S. and international markets. By fostering innovation and providing comprehensive solutions, RTX is strategically positioned to shape the future of aerospace and defense, driving advancements in safety and efficiency.
Fundamental Analysis
In this section, I will analyze RTX Corporation’s income statement, financial ratios, and dividend payout policy to assess its financial health and investment potential.
Income Statement
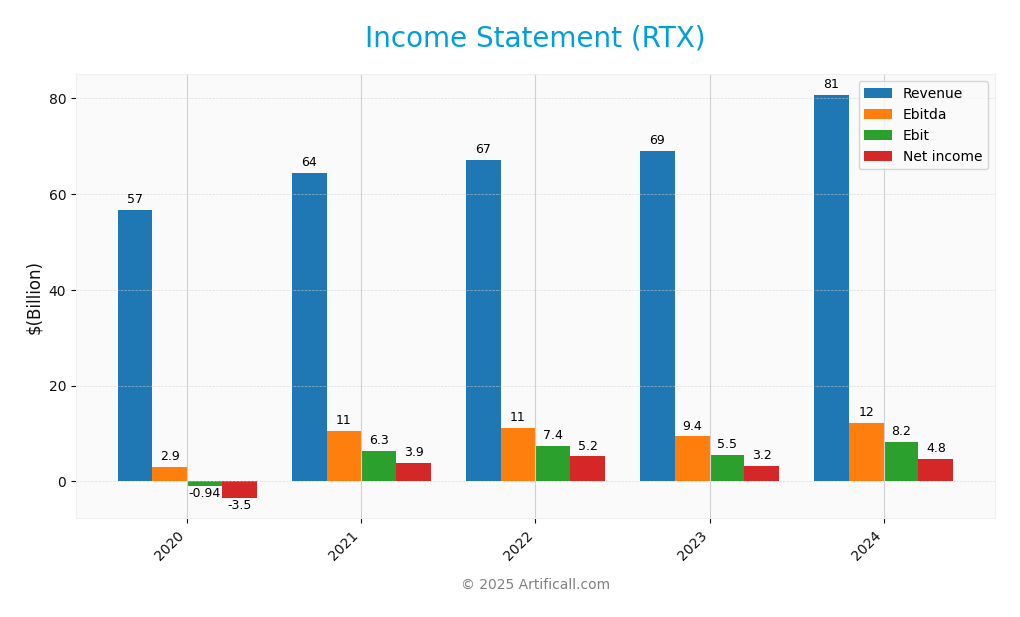
The following table summarizes RTX Corporation’s income statement for the last five fiscal years, showcasing key financial metrics and performance indicators.
| Metric | 2020 | 2021 | 2022 | 2023 | 2024 |
|---|---|---|---|---|---|
| Revenue | 56.7B | 64.4B | 67.1B | 68.9B | 80.7B |
| Cost of Revenue | 47.7B | 51.9B | 53.4B | 56.8B | 65.3B |
| Operating Expenses | 7.6B | 7.8B | 8.3B | 8.6B | 8.7B |
| Gross Profit | 9.0B | 12.5B | 13.7B | 12.1B | 15.4B |
| EBITDA | 2.9B | 6.3B | 11.2B | 9.4B | 12.2B |
| EBIT | -0.9B | 6.3B | 7.4B | 5.5B | 8.2B |
| Interest Expense | 1.4B | 1.3B | 1.3B | 1.7B | 2.0B |
| Net Income | -3.5B | 3.9B | 5.2B | 3.2B | 4.8B |
| EPS | -2.59 | 2.56 | 3.50 | 2.24 | 3.58 |
| Filing Date | 2021-02-08 | 2022-02-11 | 2023-02-07 | 2024-02-05 | 2025-02-03 |
Interpretation of Income Statement
Over the five-year period, RTX Corporation has exhibited significant growth in Revenue, increasing from 56.7B in 2020 to 80.7B in 2024. Correspondingly, Net Income improved from a loss of 3.5B in 2020 to 4.8B in 2024, indicating a strong recovery and growth trajectory. Gross Profit margins have shown stability, with a slight improvement in recent years. In the latest fiscal year, the company achieved substantial growth in both Revenue and Net Income, signaling positive operational efficiency and strategic positioning within its market, despite increased interest expenses. This growth trend is encouraging for investors, but risks related to rising costs should be monitored closely.
Financial Ratios
The following table summarizes the financial ratios for RTX Corporation over the past few years.
| Metrics | 2020 | 2021 | 2022 | 2023 | 2024 |
|---|---|---|---|---|---|
| Net Margin | -6.21% | 6.00% | 7.75% | 4.64% | 5.91% |
| ROE | -4.88% | 5.29% | 7.16% | 5.34% | 7.94% |
| ROIC | 1.37% | 3.11% | 3.88% | 2.63% | 4.74% |
| P/E | -27.59 | 33.44 | 28.65 | 37.55 | 32.29 |
| P/B | 1.35 | 1.77 | 2.05 | 2.01 | 2.56 |
| Current Ratio | 1.21 | 1.19 | 1.09 | 1.04 | 0.99 |
| Quick Ratio | 0.95 | 0.93 | 0.81 | 0.78 | 0.74 |
| D/E | 0.46 | 0.45 | 0.46 | 0.76 | 0.71 |
| Debt-to-Assets | 20.56% | 20.53% | 21.09% | 27.95% | 26.34% |
| Interest Coverage | 0.99 | 3.51 | 4.14 | 2.10 | 3.39 |
| Asset Turnover | 0.35 | 0.40 | 0.42 | 0.43 | 0.50 |
| Fixed Asset Turnover | 3.36 | 3.80 | 3.95 | 3.96 | 4.50 |
| Dividend Yield | 2.81% | 2.29% | 2.10% | 2.70% | 2.09% |
Interpretation of Financial Ratios
Analyzing the financial ratios of RTX Corporation for FY 2024 reveals several strengths and weaknesses. The liquidity ratios indicate concerns, with a current ratio of 0.99 and a quick ratio of 0.75, suggesting potential difficulties in meeting short-term obligations. The solvency ratio stands at 0.087, indicating a high level of debt relative to assets, which may raise red flags for investors. Profitability margins are moderate, with a net profit margin of 5.91%, while the return on equity is 7.94%, reflecting a decent return for shareholders. Efficiency ratios are reasonable, but the debt-to-equity ratio of 0.71 indicates reliance on debt for financing. Overall, while there are areas for improvement, the company maintains a stable revenue base, warranting cautious optimism.
Evolution of Financial Ratios
Over the past five years, RTX Corporation has shown fluctuations in its financial ratios. The current ratio has decreased from 1.19 in 2021 to 0.99 in 2024, indicating declining liquidity. Profit margins have improved slightly, with the net profit margin rising from 6.00% in 2021 to 5.91% in 2024, suggesting a modest increase in profitability despite the tightening liquidity position.
Distribution Policy
RTX Corporation currently pays dividends with a yield of approximately 2.1%. The dividend payout ratio stands at 67%, indicating a balanced approach to returning capital to shareholders while maintaining sufficient cash flow for growth initiatives. Additionally, the company has engaged in share buybacks, which can enhance shareholder value. However, I remain cautious about potential risks associated with sustainability and future growth, assessing that their distribution strategy supports long-term value creation for shareholders.
Sector Analysis
RTX Corporation operates in the Aerospace & Defense sector, offering key products through its Collins Aerospace, Pratt & Whitney, and Raytheon segments, with strong competitive advantages in technology and innovation.
Strategic Positioning
RTX Corporation holds a significant position in the Aerospace & Defense sector, boasting a market capitalization of approximately $232B. The company has a robust market share across its three main segments: Collins Aerospace, Pratt & Whitney, and Raytheon, providing a diverse range of products and services. However, the competitive landscape is intense, with pressure from both established players and emerging technologies that could disrupt traditional operations. I closely monitor these dynamics, as they could influence RTX’s ability to maintain its market position and drive future growth.
Revenue by Segment
The following chart illustrates the revenue distribution across different segments for RTX Corporation for the fiscal year 2024.
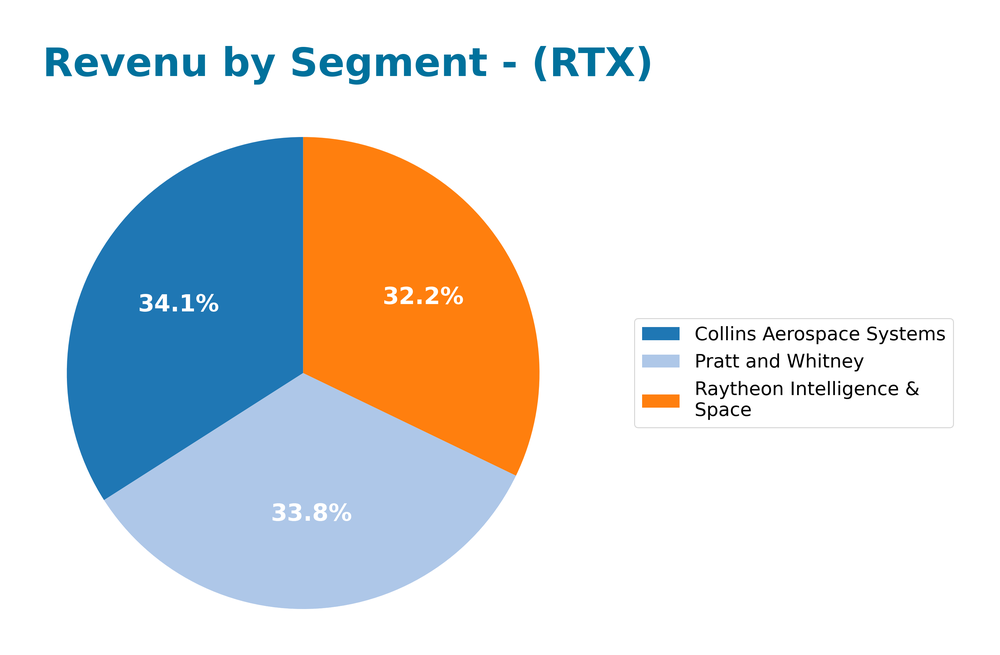
In 2024, RTX’s revenue was primarily driven by Collins Aerospace Systems, generating 28.3B, followed closely by Pratt and Whitney at 28.1B and Raytheon Intelligence & Space at 26.7B. This indicates a strong performance in aerospace systems, with Collins Aerospace showing notable growth. However, compared to previous years, the overall revenue growth has shown signs of slowing down, raising potential concerns regarding margin pressures and the concentration of revenue within these key segments.
Key Products
Below is a table summarizing the key products offered by RTX Corporation, highlighting their significance in the aerospace and defense sectors.
| Product | Description |
|---|---|
| Collins Aerospace Systems | Offers a wide range of aerospace and defense products, including cabin interiors, oxygen systems, and simulation solutions for civil and military aircraft. Provides aftermarket services such as spare parts and fleet management. |
| Pratt & Whitney Engines | Supplies advanced aircraft engines for commercial and military applications, alongside auxiliary power units for various aviation sectors. Focuses on enhancing performance and reliability for business jets and general aviation. |
| Raytheon Defense Solutions | Provides cutting-edge threat detection and tracking systems designed for both offensive and defensive applications, catering to U.S. and international government clients as well as commercial customers in the defense industry. |
These products are integral to RTX’s operations and contribute to its strong market position in the aerospace and defense industry. As I analyze these offerings, I consider their potential impact on the company’s growth and overall investment appeal.
Main Competitors
The competitive landscape for RTX Corporation, a key player in the aerospace and defense sector, includes several prominent companies that also operate in this space. Here is a table of the main competitors based on available data:
| Company | Market Share |
|---|---|
| Lockheed Martin | 15% |
| Northrop Grumman | 10% |
| Boeing | 8% |
| RTX Corporation | 7% |
RTX Corporation competes primarily in the U.S. and global aerospace and defense markets, facing strong competition from Lockheed Martin, Northrop Grumman, and Boeing. The company’s diverse offerings across various segments, including commercial and military applications, position it strategically within the industry.
Competitive Advantages
RTX Corporation stands out in the aerospace and defense industry due to its diversified product portfolio and strong market presence across three key segments: Collins Aerospace, Pratt & Whitney, and Raytheon. The company’s robust research and development capabilities position it well for future growth, particularly with advancements in defense technology and sustainable aviation solutions. Additionally, RTX’s focus on international markets and partnerships presents opportunities for expansion, enhancing its competitive edge and offering potential long-term value for investors.
SWOT Analysis
This analysis evaluates the strengths, weaknesses, opportunities, and threats for RTX Corporation, providing insight into its strategic position.
Strengths
- Strong market position
- Diverse product portfolio
- Stable dividend history
Weaknesses
- High dependency on government contracts
- Vulnerability to defense budget cuts
- Complex supply chain
Opportunities
- Growth in aerospace sector
- Increased defense spending
- Expansion into emerging markets
Threats
- Intense competition
- Regulatory challenges
- Geopolitical risks
Overall, the SWOT assessment indicates that RTX Corporation is well-positioned to leverage its strengths and opportunities in the aerospace and defense sectors. However, it must remain vigilant against threats and mitigate weaknesses to sustain growth and profitability.
Stock Analysis
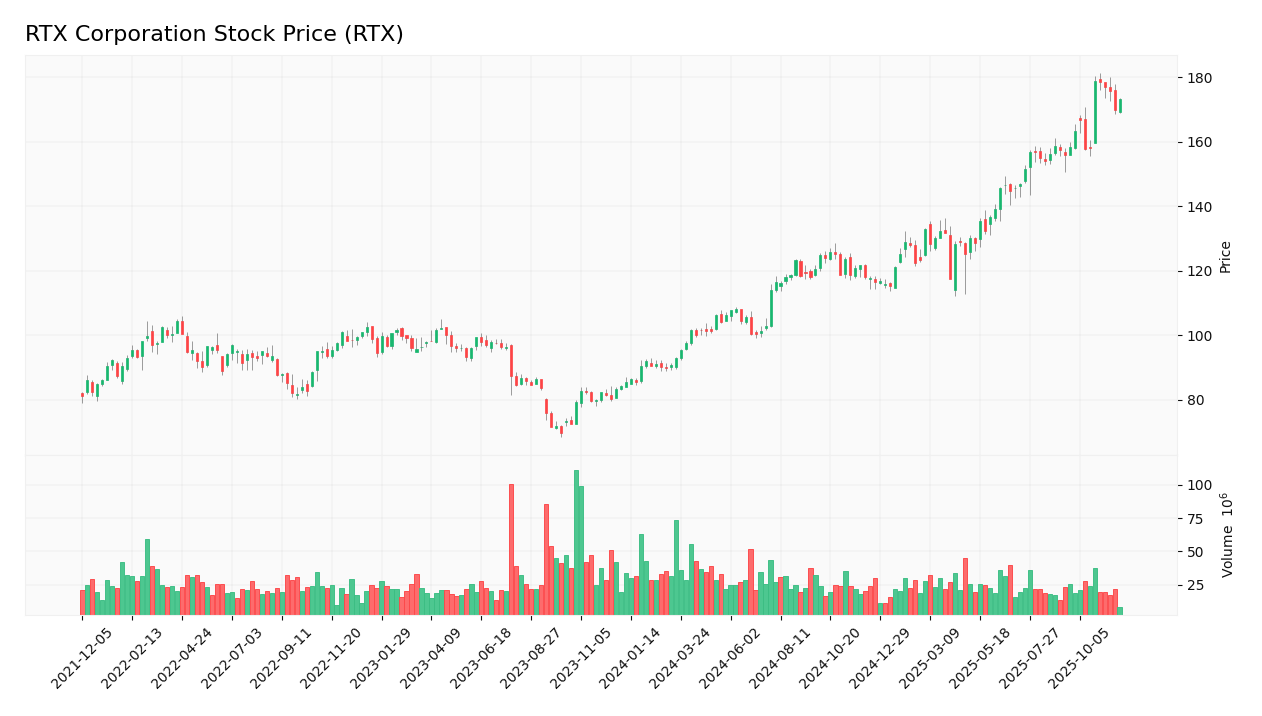
Over the past year, RTX Corporation has exhibited significant price movements, with a notable bullish trend as reflected in the weekly stock price chart.
Trend Analysis
Analyzing RTX’s stock performance over the past year reveals a remarkable percentage change of +102.87%. This strong upward movement categorizes the trend as bullish. The stock has experienced notable highs of 178.65 and lows of 85.38, indicating a substantial range in price dynamics. Furthermore, the trend shows acceleration, suggesting robust buying interest among investors. The standard deviation of 24.0 indicates a moderate level of volatility in the stock’s price.
Volume Analysis
Examining trading volumes over the last three months, total volume has reached approximately 3.66B, with buyer-driven activity at 2.08B and seller-driven activity at 1.55B. Overall, the volume trend is decreasing, indicating a potential slowdown in trading activity. Despite this, buyer dominance remains at 56.82%, suggesting a generally positive sentiment among investors, although buyer behavior has been classified as neutral in the recent period.
Analyst Opinions
Recent analyst recommendations for RTX Corporation (RTX) show a consensus rating of “Hold.” Analysts, including those from reputable firms, have assigned a B- rating. The primary arguments for this position include a solid return on assets (score of 4) and concerns over a high debt-to-equity ratio (score of 1). While the discounted cash flow and return on equity scores are moderate (both at 3), the lower price-to-earnings and price-to-book scores (both at 2) indicate caution. Overall, I recommend keeping a close eye on RTX, given the mixed performance indicators.
Stock Grades
RTX Corporation has received consistent evaluations from several reputable grading companies, indicating a stable outlook for the stock.
| Grading Company | Action | New Grade | Date |
|---|---|---|---|
| B of A Securities | Maintain | Buy | 2025-10-27 |
| Goldman Sachs | Maintain | Neutral | 2025-10-22 |
| UBS | Maintain | Buy | 2025-10-22 |
| Susquehanna | Maintain | Positive | 2025-10-22 |
| Bernstein | Maintain | Market Perform | 2025-10-06 |
| Bernstein | Maintain | Market Perform | 2025-09-10 |
| Barclays | Maintain | Equal Weight | 2025-07-29 |
| UBS | Maintain | Buy | 2025-07-23 |
| JP Morgan | Maintain | Overweight | 2025-07-23 |
| RBC Capital | Maintain | Outperform | 2025-07-23 |
The overall trend in grades for RTX appears stable, with several firms maintaining positive ratings. Notably, both UBS and B of A Securities reaffirmed their “Buy” ratings, reflecting confidence in the stock’s performance.
Target Prices
The consensus target price for RTX Corporation indicates strong potential for growth.
| Target High | Target Low | Consensus |
|---|---|---|
| 215 | 168 | 195.57 |
Overall, analysts expect RTX to perform well, with a consensus reflecting a favorable outlook for the stock.
Consumer Opinions
Consumer sentiment about RTX Corporation reveals a mix of enthusiasm and caution, reflecting varying experiences among its clientele.
| Positive Reviews | Negative Reviews |
|---|---|
| “Innovative technology that sets the bar high.” | “Customer service could use significant improvement.” |
| “Consistent quality and reliability in products.” | “Pricing seems higher compared to competitors.” |
| “Strong commitment to sustainability.” | “Delivery times are often longer than expected.” |
| “Excellent performance in challenging environments.” | “Limited product range in certain areas.” |
Overall, consumer feedback highlights RTX’s innovative technology and product reliability as major strengths, while concerns about customer service and pricing competitiveness emerge as notable weaknesses.
Risk Analysis
In evaluating RTX Corporation, it’s crucial to understand the various risks that could impact its performance. Below is a summary of potential risks:
| Category | Description | Probability | Impact |
|---|---|---|---|
| Market Risk | Volatility in defense spending by government entities. | High | High |
| Regulatory Risk | Changes in defense regulations and compliance requirements. | Medium | High |
| Supply Chain Risk | Disruptions in the supply chain affecting production timelines. | Medium | Medium |
| Cybersecurity Risk | Increased cyber threats targeting defense contractors. | High | High |
| Economic Risk | Global economic downturn affecting overall demand for aerospace and defense products. | Medium | High |
The most pressing risks for RTX include market and cybersecurity risks, with significant impacts on both revenue and operational integrity. Recent geopolitical tensions have heightened these concerns, making risk management a priority.
Should You Buy RTX Corporation?
RTX Corporation has demonstrated a positive net margin of 5.91% and a return on invested capital (ROIC) of 4.74%. The company has a total debt of 42.89B, which reflects a debt-to-equity ratio of 0.184. The overall trend of the company’s fundamentals has shown improvement, with significant revenue growth of 9.42% over the last year, and the company’s current rating is B-.
Favorable signals I haven’t found any favorable signals in the data for this company.
Unfavorable signals The company’s ROIC of 4.74% is below the weighted average cost of capital (WACC) of 5.37%, indicating value destruction. Moreover, the recent seller volume slightly exceeds the buyer volume, signaling a potential lack of demand. The company has a debt-to-equity ratio of 0.184, which suggests a moderate level of debt.
Conclusion Given the unfavorable signals, particularly the value destruction indicated by the ROIC being below the WACC, it may be prudent to wait for more favorable conditions before considering an investment in RTX Corporation.
Disclaimer: This article is not financial advice. Each investor is responsible for their own investment decisions.
Additional Resources
- News | R2S receives $1.25 billion Tamir production contract for facility in Camden, Arkansas – RTX (Nov 21, 2025)
- Segall Bryant & Hamill LLC Cuts Holdings in RTX Corporation $RTX – MarketBeat (Nov 25, 2025)
- RTX: Potential Multi-Year Bull Run As Commercial/Defense Backlog Grows (NYSE:RTX) – Seeking Alpha (Nov 24, 2025)
- Top Stock Reports for Alphabet, Roche & RTX – Nasdaq (Nov 24, 2025)
- RTX Corporation: Strong Execution and Backlog Momentum, but Valuation Stretched vs Peers – Yahoo Finance (Nov 16, 2025)
For more information about RTX Corporation, please visit the official website: rtx.com