In the evolving landscape of technology and industrial solutions, Roper Technologies, Inc. (ROP) and UiPath Inc. (PATH) stand out as innovative players. While ROP operates in the industrial machinery sector, providing a diverse range of engineered products and software, PATH specializes in robotic process automation (RPA) within the software infrastructure industry. Their distinct yet overlapping markets make this comparison intriguing, as both companies are pushing the boundaries of innovation. Join me as we explore which of these two companies may be the more compelling investment opportunity.
Table of contents
Company Overview
Roper Technologies, Inc. Overview
Roper Technologies, Inc. operates as a diversified technology company, focusing on software and engineered products across multiple sectors. Its mission revolves around designing innovative solutions that enhance operational efficiency for its customers. With a market capitalization of approximately $48B, Roper serves industries ranging from healthcare and financial services to industrial machinery. The company’s extensive portfolio includes cloud-based financial analytics, diagnostic software, and precision instruments. This versatility allows Roper to maintain a strong competitive position in the industrial sector.
UiPath Inc. Overview
UiPath Inc. specializes in robotic process automation (RPA), providing a comprehensive platform that streamlines automation processes for businesses. Founded in 2005, its mission is to empower organizations through intelligent automation solutions that enhance productivity and compliance. With a market cap of around $7.2B, UiPath plays a critical role in the technology sector by enabling companies to automate repetitive tasks through AI-driven platforms. Its low-code development environments make automation accessible to users without programming expertise, positioning UiPath as a leader in the software-infrastructure industry.
Key similarities between Roper Technologies and UiPath include their commitment to innovation and their focus on providing solutions that drive efficiency across various sectors. However, their business models differ significantly; Roper emphasizes a diversified portfolio of engineered products and software, while UiPath focuses specifically on RPA, catering primarily to automation needs within organizations.
Income Statement Comparison
The following table compares the most recent income statements of Roper Technologies, Inc. and UiPath Inc. to provide insights into their financial performance.
| Metric | Roper Technologies, Inc. | UiPath Inc. |
|---|---|---|
| Revenue | 7.04B | 1.43B |
| EBITDA | 3.04B | -145M |
| EBIT | 2.23B | -163M |
| Net Income | 1.55B | -74M |
| EPS | 14.47 | -0.13 |
Interpretation of Income Statement
Roper Technologies showed strong growth in revenue, increasing from 6.18B in 2023 to 7.04B in 2024, with a notable net income rise from 1.36B to 1.55B, reflecting improved operational efficiency. In contrast, UiPath experienced revenue growth from 1.31B in 2024 to 1.43B in 2025; however, it continued to operate at a loss, with a net income deficit of 74M. The contrasting performance indicates Roper’s robust profitability and margins, while UiPath’s ongoing losses signal potential concerns about sustainability amidst its growth trajectory.
Financial Ratios Comparison
The following table provides a comparative analysis of the most recent revenue and financial ratios for Roper Technologies, Inc. (ROP) and UiPath Inc. (PATH):
| Metric | ROP | PATH |
|---|---|---|
| ROE | 8.21% | -3.99% |
| ROIC | 5.50% | -7.41% |
| P/E | 35.94 | -108.04 |
| P/B | 2.95 | 4.31 |
| Current Ratio | 0.40 | 2.93 |
| Quick Ratio | 0.37 | 2.93 |
| D/E | 0.41 | 0.04 |
| Debt-to-Assets | 24.48% | 2.72% |
| Interest Coverage | 7.70 | N/A |
| Asset Turnover | 0.22 | 0.50 |
| Fixed Asset Turnover | 47.02 | 14.41 |
| Payout ratio | 20.78% | 0% |
| Dividend yield | 0.58% | 0% |
Interpretation of Financial Ratios
Roper Technologies (ROP) demonstrates stronger financial health compared to UiPath (PATH). ROP has solid profitability indicators, with positive ROE and ROIC, while PATH faces significant challenges with negative profitability ratios and high P/E. The current and quick ratios indicate ROP’s liquidity issues, but PATH’s ratios suggest strong liquidity. However, ROP’s lower debt ratios reflect effective leverage management, contrasting with PATH’s minimal debt load. Overall, ROP represents a more stable investment, while PATH may warrant caution due to its ongoing losses and profitability concerns.
Dividend and Shareholder Returns
Roper Technologies, Inc. (ROP) demonstrates a commitment to shareholder returns through regular dividends, with a payout ratio of approximately 21% and a dividend yield around 0.58%. This suggests sustainable distributions, supported by robust free cash flow. Conversely, UiPath Inc. (PATH) does not pay dividends, likely due to its focus on reinvesting for growth during its high-growth phase. Instead, PATH engages in share buybacks, indicating a strategic approach to enhancing shareholder value. Ultimately, ROP’s dividends and PATH’s buybacks both align with their long-term value creation strategies.
Strategic Positioning
Roper Technologies, Inc. (ROP) holds a substantial market share in the industrial machinery sector, leveraging diverse software and engineered solutions to mitigate competitive pressures. With a market cap of approximately $48B, it faces challenges from technological disruptions but continues to innovate. Conversely, UiPath Inc. (PATH) operates in the software-infrastructure domain, focusing on robotic process automation, and boasts a market cap of around $7.2B. The rapid advancement of AI and automation technologies presents both opportunities and competition in this dynamic landscape.
Stock Comparison
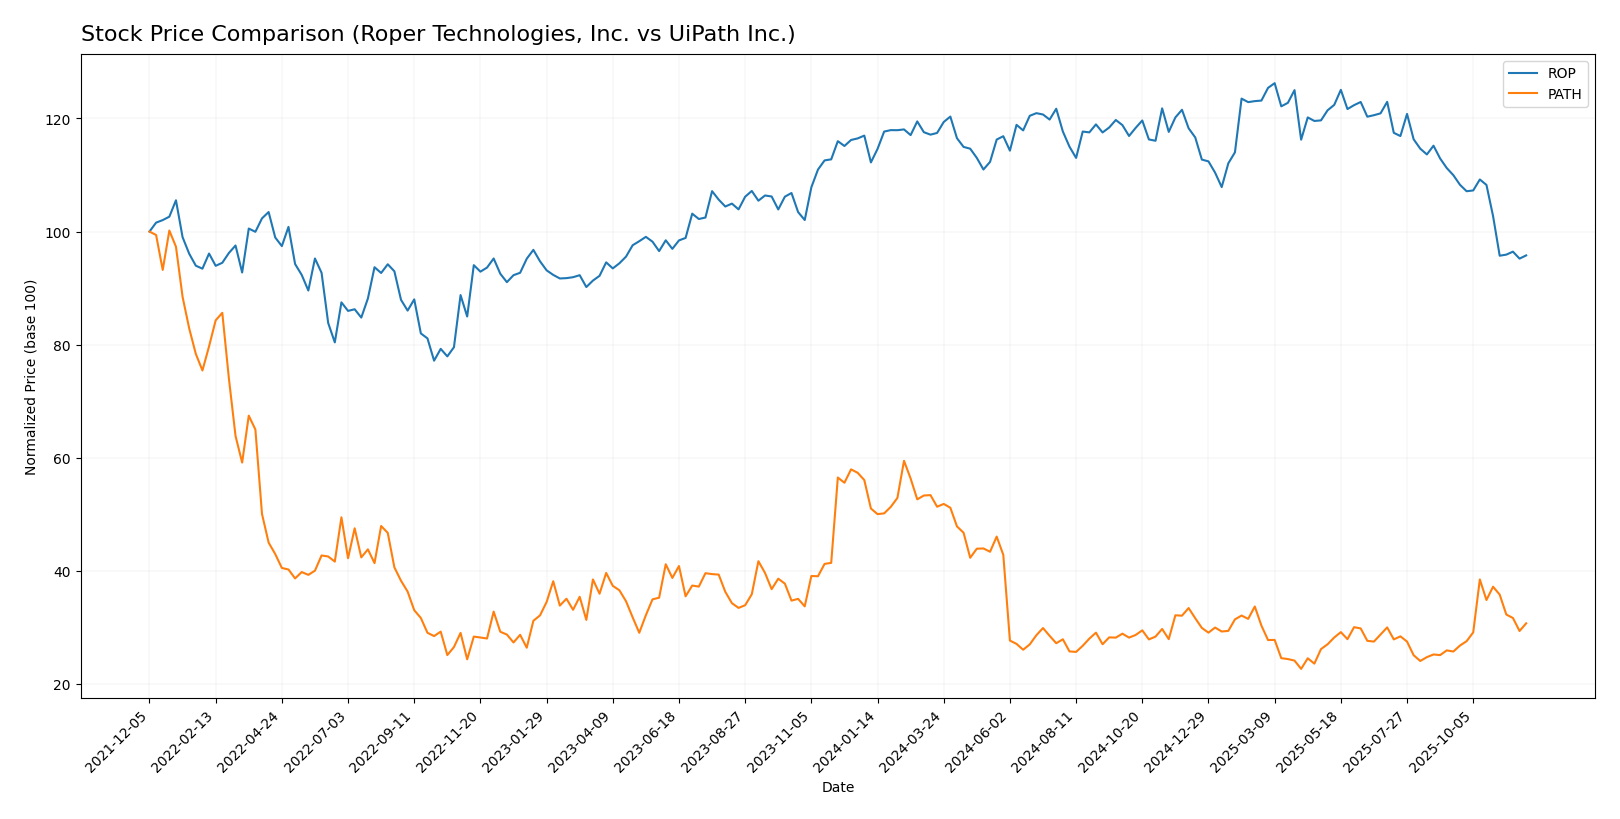
In this section, I will analyze the weekly stock price movements of Roper Technologies, Inc. (ROP) and UiPath Inc. (PATH) over the past year, focusing on key price dynamics and trends.
Trend Analysis
Roper Technologies, Inc. (ROP): Over the past year, ROP has experienced a price change of -14.66%, indicating a bearish trend. The stock has shown notable deceleration in its price movement, with a standard deviation of 30.17, reflecting significant volatility. The highest recorded price was 588.38, while the lowest was 443.75.
In the recent period from September 14, 2025, to November 30, 2025, ROP’s price change was -12.9%, with a standard deviation of 28.07. This further confirms the bearish trend, as the stock’s slope was measured at -7.35.
UiPath Inc. (PATH): In contrast, PATH has seen a significant decline of -39.81% over the past year, marking a bearish trend. However, the stock has shown acceleration during this period, with a standard deviation of 4.08. The highest price was 26.35, and the lowest was 10.04.
In the recent analysis period from September 14, 2025, to November 30, 2025, PATH experienced a price change of 19.39%, indicating a potential reversal or recovery phase. The standard deviation was low at 1.78, suggesting reduced volatility during this time, with a trend slope of 0.18.
In summary, ROP is facing a bearish trend with deceleration, while PATH, despite a significant long-term decline, has shown signs of recovery in the short term.
Analyst Opinions
Recent analyst recommendations for Roper Technologies, Inc. (ROP) show a consensus rating of “B+” with strong scores in discounted cash flow and return on assets. Analysts highlight its robust financial health and operational efficiency as key strengths. In contrast, UiPath Inc. (PATH) holds a “B-” rating, with analysts pointing out concerns over its price-to-earnings ratio and overall market position. The consensus for ROP leans towards a “buy,” while PATH is viewed more cautiously, suggesting a “hold” stance.
Stock Grades
In the current market environment, investors often seek reliable stock grades to inform their investment decisions. Here are the most recent ratings for Roper Technologies, Inc. and UiPath Inc.
Roper Technologies, Inc. Grades
| Grading Company | Action | New Grade | Date |
|---|---|---|---|
| RBC Capital | downgrade | Sector Perform | 2025-10-27 |
| Barclays | maintain | Underweight | 2025-10-27 |
| TD Cowen | maintain | Buy | 2025-10-24 |
| Raymond James | maintain | Strong Buy | 2025-10-24 |
| RBC Capital | maintain | Outperform | 2025-10-24 |
| Jefferies | maintain | Buy | 2025-10-24 |
| Mizuho | maintain | Neutral | 2025-10-17 |
| JP Morgan | downgrade | Underweight | 2025-10-15 |
| Barclays | maintain | Underweight | 2025-10-01 |
| Truist Securities | maintain | Buy | 2025-07-22 |
UiPath Inc. Grades
| Grading Company | Action | New Grade | Date |
|---|---|---|---|
| UBS | upgrade | Neutral | 2025-10-23 |
| BMO Capital | maintain | Market Perform | 2025-10-02 |
| Canaccord Genuity | maintain | Buy | 2025-09-08 |
| Truist Securities | maintain | Hold | 2025-09-05 |
| BMO Capital | maintain | Market Perform | 2025-09-05 |
| Needham | maintain | Hold | 2025-09-05 |
| Morgan Stanley | maintain | Equal Weight | 2025-06-02 |
| Canaccord Genuity | maintain | Buy | 2025-06-02 |
| Evercore ISI Group | maintain | In Line | 2025-05-30 |
| Scotiabank | maintain | Sector Perform | 2025-05-30 |
Overall, Roper Technologies has a mixed outlook with some downgrades, especially from RBC Capital and JP Morgan, indicating cautious sentiment. On the other hand, UiPath shows a positive shift with an upgrade from UBS, reflecting a more favorable outlook among analysts. Investors should consider these grades in their decision-making process while remaining aware of potential risks in the market.
Target Prices
A strong consensus from analysts suggests notable target prices for Roper Technologies, Inc. and UiPath Inc.
| Company | Target High | Target Low | Consensus |
|---|---|---|---|
| Roper Technologies, Inc. | 650 | 506 | 574.2 |
| UiPath Inc. | 17 | 13 | 15.33 |
Analysts expect Roper Technologies to reach a consensus target of 574.2, significantly above its current price of 446.41. For UiPath, the consensus target of 15.33 is slightly above its current price of 13.61, indicating a cautiously optimistic outlook.
Strengths and Weaknesses
The following table outlines the strengths and weaknesses of Roper Technologies, Inc. and UiPath Inc., providing a comparative analysis to aid your investment decisions.
| Criterion | Roper Technologies, Inc. | UiPath Inc. |
|---|---|---|
| Diversification | Strong across various sectors, including software and industrial products | Focused on RPA solutions with limited diversification |
| Profitability | High profit margins (Net Profit Margin: 22%) | Negative margins, struggling to achieve profitability |
| Innovation | Robust innovation in software and technology | Leading in RPA innovation but facing operational challenges |
| Global presence | Established presence in multiple countries | Primarily US-based with growing international presence |
| Market Share | Significant market share in industrial sectors | Competitive share in the RPA market, but faces stiff competition |
| Debt level | Moderate debt levels, manageable (Debt to Equity: 0.41) | Low debt levels (Debt to Equity: 0.04), but reliance on funding |
Key takeaways: Roper Technologies boasts strong diversification and profitability, making it a more stable investment. In contrast, UiPath’s focus on innovation in RPA is promising but tempered by current financial challenges.
Risk Analysis
In the following table, I analyze the key risks associated with two companies, Roper Technologies, Inc. (ROP) and UiPath Inc. (PATH).
| Metric | Roper Technologies, Inc. (ROP) | UiPath Inc. (PATH) |
|---|---|---|
| Market Risk | Moderate | High |
| Regulatory Risk | Low | Moderate |
| Operational Risk | Low | High |
| Environmental Risk | Low | Low |
| Geopolitical Risk | Moderate | High |
In summary, ROP faces lower risks with stable operations, while PATH encounters significant operational and market risks due to its dependence on technology adoption and competitive pressures. Recent financial performance has highlighted PATH’s struggles with profitability, underscoring the urgency of addressing these risks effectively.
Which one to choose?
When comparing Roper Technologies, Inc. (ROP) and UiPath Inc. (PATH), ROP shows stronger fundamentals with a market cap of $56B and a solid revenue growth trend, despite a recent bearish price movement. ROP holds a rating of B+ with robust profit margins (net margin of 22%) and efficient asset utilization (return on equity of 8%). In contrast, PATH, valued at $7.96B, struggles with negative earnings and a lower rating of B-, indicating potential operational challenges. Although PATH’s recent price recovery (up 19.39%) may attract speculative interest, its overall trend remains bearish.
Investors focused on stability may prefer ROP for its consistent performance and profitability. Conversely, growth-oriented investors might find speculative opportunities in PATH, albeit with significant risk due to its volatile financial metrics.
Specific risks include ROP’s exposure to competition and market dependence, while PATH faces ongoing operational loss challenges.
Disclaimer: This article is not financial advice. Each investor is responsible for their own investment decisions.
Go further
I encourage you to read the complete analyses of Roper Technologies, Inc. and UiPath Inc. to enhance your investment decisions: