In today’s rapidly evolving market, Roper Technologies, Inc. (ROP) and Asana, Inc. (ASAN) stand out as two compelling companies from different sectors. Roper operates in the industrial machinery space, focusing on innovative software and engineered products, while Asana thrives in the software application industry, offering a work management platform that enhances organizational efficiency. Both companies exhibit unique growth strategies and market potential, making them worthy of comparison. Join me as we explore which of these companies may be the more attractive investment opportunity for your portfolio.

Table of contents
Company Overview
Roper Technologies, Inc. Overview
Roper Technologies, Inc. operates within the industrial machinery sector, focusing on designing and developing advanced software and engineered products. Its diverse portfolio includes management and diagnostic solutions, cloud-based financial analytics, and various specialized equipment. Roper’s strategic positioning emphasizes innovation across industries such as healthcare, foodservice, and financial services, enabling it to deliver value through tailored solutions. With a market cap of approximately $48B, Roper continues to expand its influence by integrating technology with traditional industrial applications, ensuring robust growth potential.
Asana, Inc. Overview
Asana, Inc. is a key player in the software application industry, offering a comprehensive work management platform designed to facilitate task orchestration and productivity across teams. Founded in 2008, Asana serves a wide array of sectors, including technology, healthcare, and non-profits. The platform empowers users to manage everything from daily tasks to strategic initiatives efficiently. With a market capitalization of around $2.9B, Asana aims to enhance collaboration and transparency in workplaces worldwide, positioning itself as an essential tool for modern project management.
Roper Technologies and Asana both leverage technology to improve operational efficiency but operate in vastly different sectors. Roper focuses on specialized industrial solutions, while Asana targets workflow management across various industries. Their business models highlight distinct strategies: Roper integrates hardware with software for industrial applications, whereas Asana emphasizes software solutions to streamline team collaboration and project management.
Income Statement Comparison
The following table provides a comparison of key financial metrics from the most recent fiscal year for Roper Technologies, Inc. and Asana, Inc. This analysis will help investors assess the financial health and performance of these companies.
| Metric | Roper Technologies, Inc. | Asana, Inc. |
|---|---|---|
| Revenue | 7.04B | 723.88M |
| EBITDA | 3.04B | -229.55M |
| EBIT | 2.23B | -247.09M |
| Net Income | 1.55B | -255.54M |
| EPS | 14.47 | -1.11 |
Interpretation of Income Statement
Roper Technologies demonstrated significant revenue growth, increasing from 6.18B in 2023 to 7.04B in 2024, with a net income rise from 1.36B to 1.55B. This positive trend reflects improved operational efficiency and stable margins. In contrast, Asana continues to struggle, reporting a decline in revenue and a net loss of 255.54M in 2025, indicating ongoing challenges in achieving profitability. The stark difference in performance underscores the resilience of Roper’s business model compared to the volatility faced by Asana, which may warrant caution for potential investors.
Financial Ratios Comparison
The following table provides a comparative overview of key financial ratios for Roper Technologies, Inc. (ROP) and Asana, Inc. (ASAN), based on the most recent data.
| Metric | ROP | ASAN |
|---|---|---|
| ROE | 8.21% | -112.31% |
| ROIC | 5.50% | -54.04% |
| P/E | 35.94 | -19.16 |
| P/B | 2.95 | 21.52 |
| Current Ratio | 0.40 | 1.44 |
| Quick Ratio | 0.37 | 1.44 |
| D/E | 0.41 | 1.18 |
| Debt-to-Assets | 0.25 | 0.30 |
| Interest Coverage | 7.70 | -72.42 |
| Asset Turnover | 0.22 | 0.81 |
| Fixed Asset Turnover | 47.02 | 2.76 |
| Payout Ratio | 20.78% | 0% |
| Dividend Yield | 0.58% | 0% |
Interpretation of Financial Ratios
ROP demonstrates strong financial health with positive returns, manageable debt levels, and a solid dividend payout. In contrast, ASAN reveals significant challenges, highlighted by negative returns and a high debt-to-equity ratio, indicating potential liquidity issues. Investors should exercise caution with ASAN due to its negative margins and reliance on debt financing.
Dividend and Shareholder Returns
Roper Technologies, Inc. (ROP) rewards its shareholders with a dividend of $3.01 per share, maintaining a payout ratio of 21% and an annual yield of about 0.58%. This indicates a sustainable distribution supported by strong free cash flow. In contrast, Asana, Inc. (ASAN) does not pay dividends, reflecting a focus on reinvestment in growth and innovation, which is common in high-growth firms. Neither company currently engages in share buybacks. While ROP’s dividends enhance shareholder returns, ASAN’s strategy may support long-term value creation through reinvestment.
Strategic Positioning
Roper Technologies (ROP) holds a strong position in the industrial machinery sector, leveraging its diverse product offerings and robust market share to navigate competitive pressures. Asana (ASAN), in the software application industry, faces challenges from rapid technological disruption but continues to innovate its work management platform. Both companies exhibit resilience, yet investors should remain cautious as market dynamics evolve.
Stock Comparison
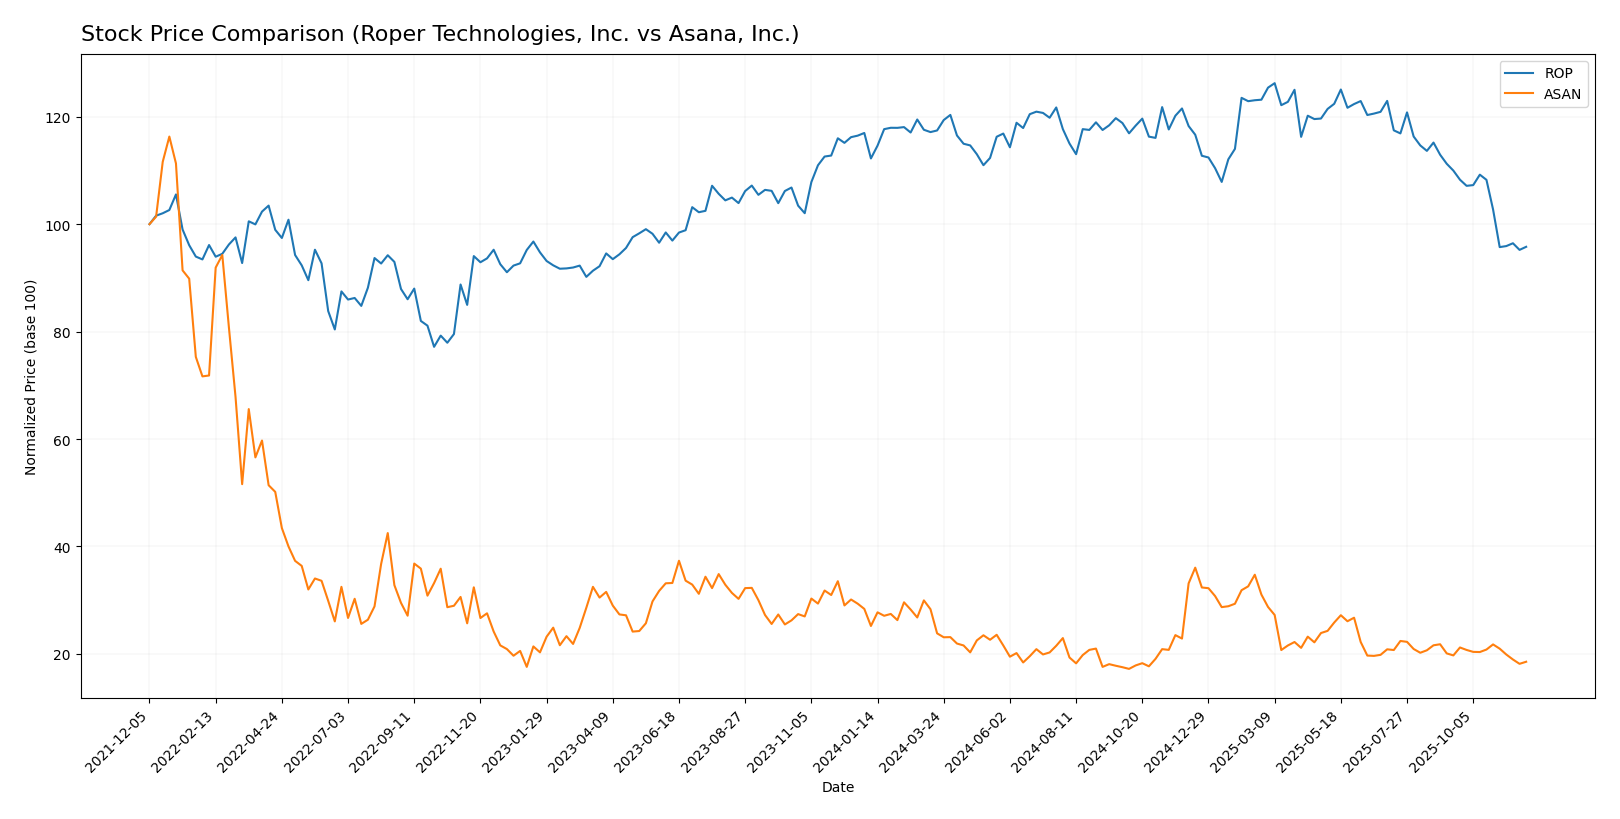
In the past year, Roper Technologies, Inc. (ROP) and Asana, Inc. (ASAN) have experienced significant price movements, reflecting broader trading dynamics that investors should closely examine.
Trend Analysis
Roper Technologies, Inc. (ROP) has seen a percentage change of -14.66% over the past year. This indicates a bearish trend, with a deceleration in price movement. The stock reached a high of 588.38 and a low of 443.75, with a standard deviation of 30.17, suggesting notable volatility in its price actions.
In the recent period from September 14, 2025, to November 30, 2025, ROP’s price change was -12.9%, contributing to an overall downward trajectory with a trend slope of -7.35.
Asana, Inc. (ASAN) has experienced a more pronounced decline, with a percentage change of -26.42% over the past year, indicating a bearish trend as well, with deceleration evident in its price dynamics. The stock has fluctuated between a high of 24.15 and a low of 11.53, with a lower standard deviation of 2.93, pointing to relatively less volatility compared to ROP.
For the recent period from September 14, 2025, to November 30, 2025, ASAN’s price change was -5.98%, reflecting continued negative momentum and a trend slope of -0.12.
Both companies are currently facing challenges, and their bearish trends warrant careful consideration for potential investors.
Analyst Opinions
Recent analyst recommendations indicate a clear divergence between Roper Technologies, Inc. (ROP) and Asana, Inc. (ASAN). Analysts have rated ROP with a solid “B+” due to its strong discounted cash flow and return metrics, suggesting a consensus buy for 2025. On the other hand, ASAN has been assigned a “D+” rating, reflecting concerns over its financial performance and high debt levels, leading to a consensus sell. Analysts recommend caution with ASAN while favoring ROP for potential growth.
Stock Grades
In the current market landscape, stock ratings can provide valuable insights into how analysts perceive company performance. Below is the latest grading data for Roper Technologies, Inc. and Asana, Inc.
Roper Technologies, Inc. Grades
| Grading Company | Action | New Grade | Date |
|---|---|---|---|
| RBC Capital | downgrade | Sector Perform | 2025-10-27 |
| Barclays | maintain | Underweight | 2025-10-27 |
| TD Cowen | maintain | Buy | 2025-10-24 |
| Raymond James | maintain | Strong Buy | 2025-10-24 |
| RBC Capital | maintain | Outperform | 2025-10-24 |
| Jefferies | maintain | Buy | 2025-10-24 |
| Mizuho | maintain | Neutral | 2025-10-17 |
| JP Morgan | downgrade | Underweight | 2025-10-15 |
| Barclays | maintain | Underweight | 2025-10-01 |
| Truist Securities | maintain | Buy | 2025-07-22 |
Asana, Inc. Grades
| Grading Company | Action | New Grade | Date |
|---|---|---|---|
| Baird | maintain | Neutral | 2025-09-04 |
| Morgan Stanley | maintain | Underweight | 2025-09-04 |
| Piper Sandler | maintain | Overweight | 2025-09-04 |
| Baird | maintain | Neutral | 2025-06-04 |
| UBS | maintain | Neutral | 2025-06-04 |
| Jefferies | maintain | Hold | 2025-06-04 |
| RBC Capital | maintain | Underperform | 2025-06-04 |
| Morgan Stanley | maintain | Underweight | 2025-06-04 |
| JMP Securities | maintain | Market Outperform | 2025-06-04 |
| B of A Securities | maintain | Buy | 2025-06-04 |
The overall trend indicates a mixed sentiment for Roper Technologies, with a recent downgrade from RBC Capital and maintenance of strong ratings from firms like Raymond James. In contrast, Asana’s grades show a more stable outlook, with several analysts maintaining their ratings at neutral or overweight, suggesting cautious optimism in the current market conditions.
Target Prices
The current consensus target prices for Roper Technologies, Inc. and Asana, Inc. suggest varied expectations from analysts.
| Company | Target High | Target Low | Consensus |
|---|---|---|---|
| Roper Technologies, Inc. | 650 | 506 | 574.2 |
| Asana, Inc. | 88 | 10 | 23.41 |
For Roper Technologies, the consensus target price of 574.2 indicates a significant upside potential compared to its current price of 446.47. Meanwhile, Asana’s consensus of 23.41 suggests a more modest expectation relative to its current price of 12.40, highlighting potential growth but also reflecting market caution.
Strengths and Weaknesses
The following table summarizes the strengths and weaknesses of Roper Technologies, Inc. (ROP) and Asana, Inc. (ASAN):
| Criterion | Roper Technologies, Inc. | Asana, Inc. |
|---|---|---|
| Diversification | High | Moderate |
| Profitability | Strong (Net Margin: 22%) | Negative (Net Margin: -35%) |
| Innovation | Strong | Moderate |
| Global presence | Extensive | Limited |
| Market Share | Leading | Growing |
| Debt level | Manageable (Debt/Equity: 0.41) | High (Debt/Equity: 1.18) |
Key takeaways indicate that Roper Technologies demonstrates strong profitability and a robust global presence, positioning it favorably in the market. In contrast, Asana faces profitability challenges and high debt levels, suggesting caution for potential investors.
Risk Analysis
In evaluating the potential risks associated with investing in different companies, I’ve compiled a comparison table highlighting key risk factors for Roper Technologies, Inc. (ROP) and Asana, Inc. (ASAN).
| Metric | Roper Technologies, Inc. | Asana, Inc. |
|---|---|---|
| Market Risk | Moderate | High |
| Regulatory Risk | Low | Moderate |
| Operational Risk | Moderate | High |
| Environmental Risk | Low | Moderate |
| Geopolitical Risk | Moderate | High |
Both companies face market and operational risks, but ASAN is particularly vulnerable given its higher operational and market risk ratings. The software sector’s volatility and competitive dynamics can heighten ASAN’s exposure to market fluctuations, while ROP’s diversified industrial portfolio offers some insulation against such risks.
Which one to choose?
When comparing Roper Technologies, Inc. (ROP) and Asana, Inc. (ASAN), the financial fundamentals clearly favor ROP. ROP has a market cap of approximately 56B, with solid profit margins (net profit margin of 22%) and a B+ rating, indicating a stable investment. In contrast, ASAN struggles with a D+ rating, negative margins, and a market cap of around 4.9B. ROP’s stock trend appears bearish with a price decline of 14.66% recently, while ASAN has seen a more significant drop of 26.42%.
For growth-oriented investors, ROP seems the safer option, while ASAN may appeal to those seeking a high-risk, high-reward scenario. However, investors should remain cautious of competition and market dependence risks inherent to both companies.
Disclaimer: This article is not financial advice. Each investor is responsible for their own investment decisions.
Go further
I encourage you to read the complete analyses of Roper Technologies, Inc. and Asana, Inc. to enhance your investment decisions: