Benefit from bearish market reversals
If you’ve spent time analyzing charts, you’ve probably noted that markets often give us clues about where they might be headed next. Some patterns signal a trend continuation, while others hint at a potential reversal. The Rising Broadening Wedge will help you detect bearish reversals. This pattern provides excellent short-selling signals.
Today, I will show you how to use the Rising Broadening Wedge to benefit from bearish market reversals and make profitable trades.
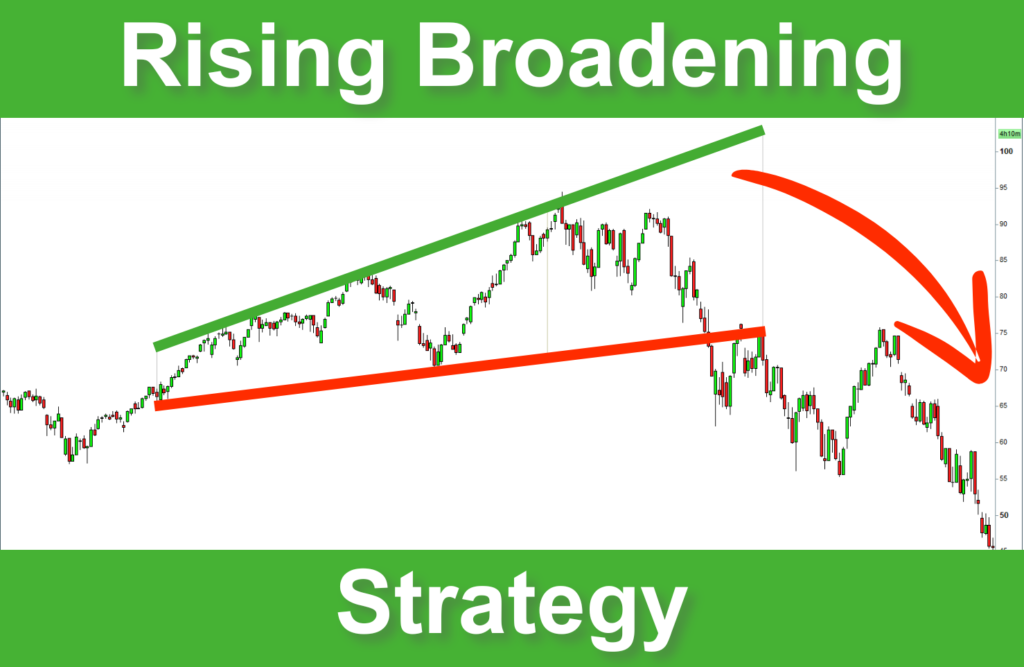
What is a Rising Broadening Wedge?
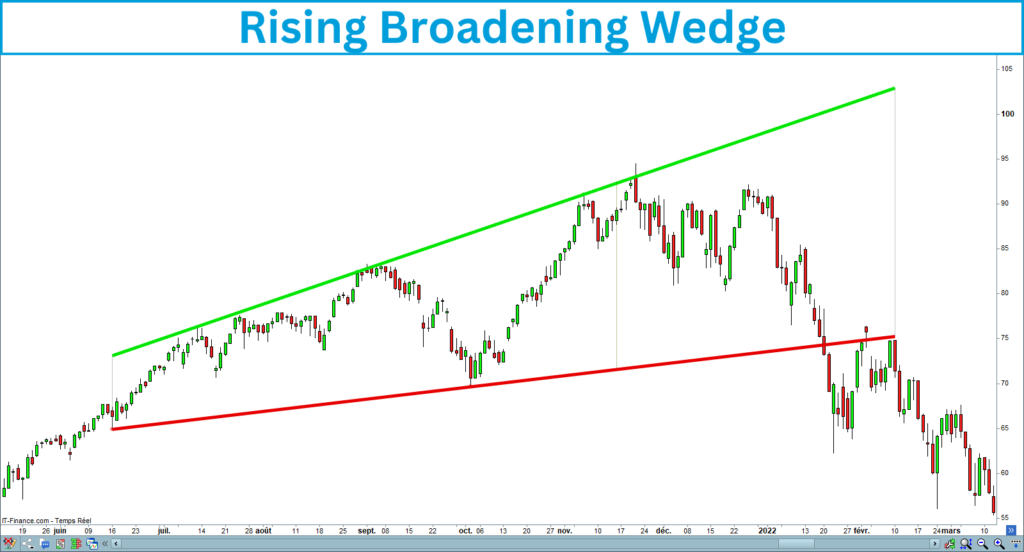
Before we get into the strategy, let’s first understand what a Rising Broadening Wedge is. This figure forms two upward-sloping trendlines: one connecting the higher highs and the other connecting the higher lows. The space between these two lines widens, creating a broadening effect. This increase in volatility reveals the market’s uncertainty and potential weakness.
Recognizing the Rising Broadening Wedge can help you to take advantage of a potential bearish reversal once the breakdown occurs. Here is an example of a rising broadening wedge that happened in the Nasdaq in the daily timeframe:
How to Identify the Pattern
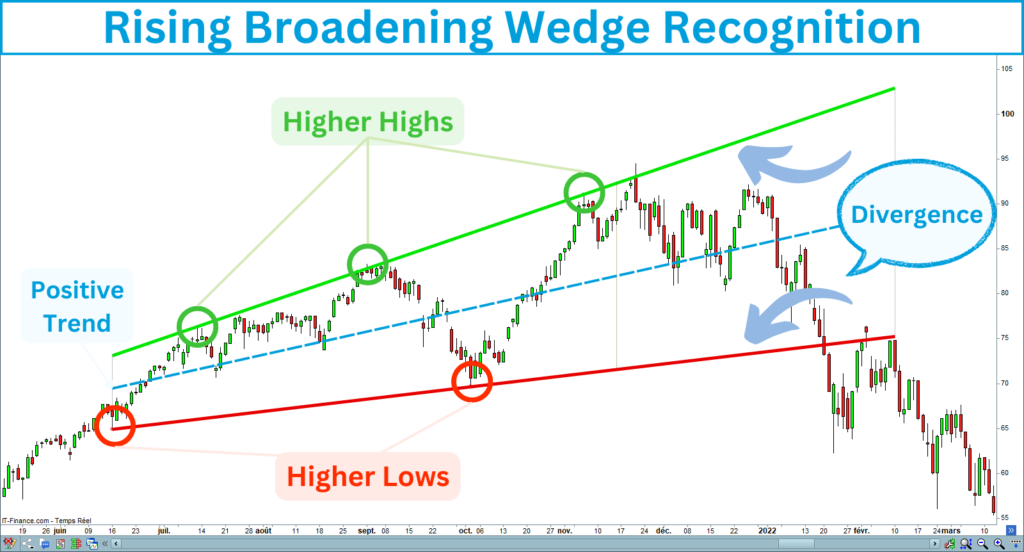
Here’s how I identify a Rising Broadening Wedge on the chart:
Rising Broadening Wedge Recognition
The following chart shows a rising broadening wedge meeting the previous criteria:
What is the Rising Broadening Wedge Breakout?
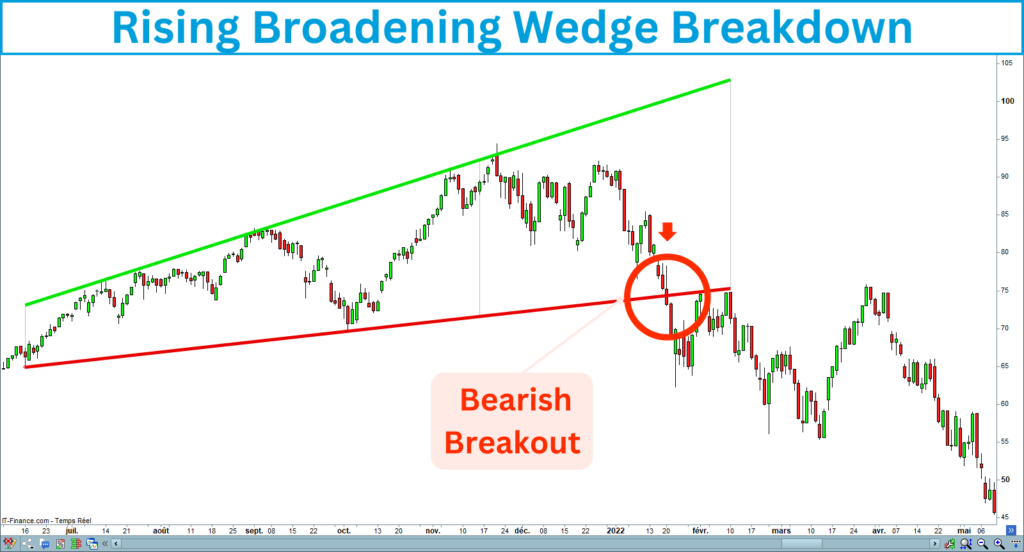
Once you’ve identified the rising broadening wedge characteristics, be ready for the breakout that could follow. The breakout occurs when the price breaks down the bottom line of the rising broadening. It suggests that the sellers have gained control, and a reversal is likely to occur. You can consider the breakdown of a rising broadening as a bearish reversal signal, presupposing that a downtrend will restart.
Waiting for a clear breakout is essential to avoid false signals. A false breakout happens when the price temporarily breaks below the downline but quickly reverses into the pattern. I will show you later how to confirm a breakout using volume and strength indicators.
The following chart shows the bottom line breakdown of a rising broadening wedge:
How to Trade the Rising Broadening Breakdown?
Now comes the exciting part: trade the rising broadening breakdown. I will present a step-by-step guide that includes everything you need to trade this pattern efficiently. You will learn to detect and confirm the selling signals, improve your success rate, and place the target and stop-loss.
Here are the steps you have to follow to trade the rising broadening wedges breakout:
1. Identify the rising broadening wedge
First, you have to draw the rising broadening wedge. Look for two diverging trendlines connecting higher lows and higher highs. Ensure that the price evolves in the pattern and that the wedge is ascending:

2. Wait for the Breakdown
You should only short-sell the market once the price breaks down at a critical level. Wait for the price to break down and close below the bottom line before opening a short entry. This ensures the breakout is real and not a simple fluctuation.
The following chart shows a breakdown of a rising broadening wedge:

3. Validate the breakdown
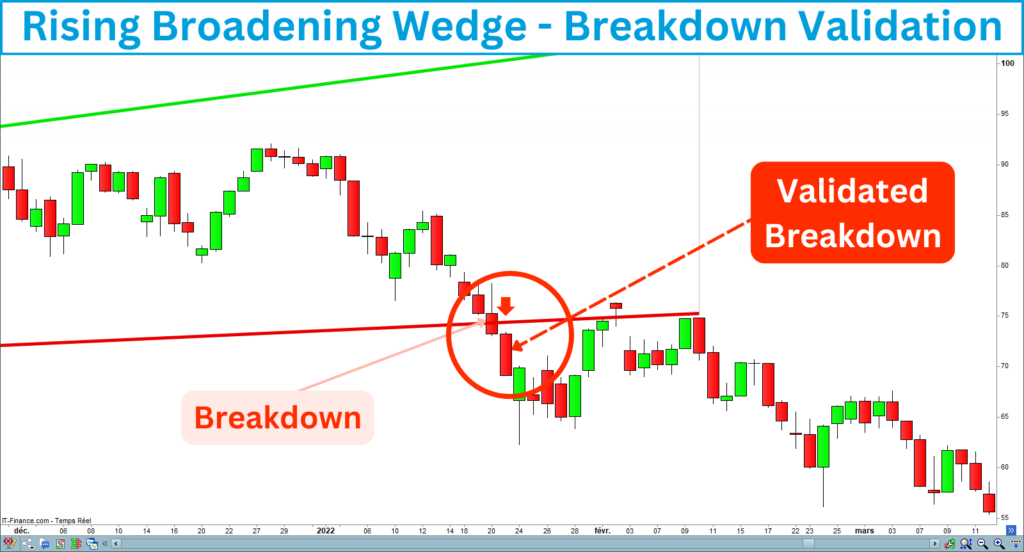
If waiting for the breakdown before opening an entry is an excellent idea, ensure the validation is better. Consider the signal is valid when the candle following the breakdown closes below the bottom line. Waiting for a validated breakout decreases your expected gains but increases the success rate of your trade.
The following chart shows a validated breakdown of a rising broadening wedge:
4. Confirm the signal with volumes
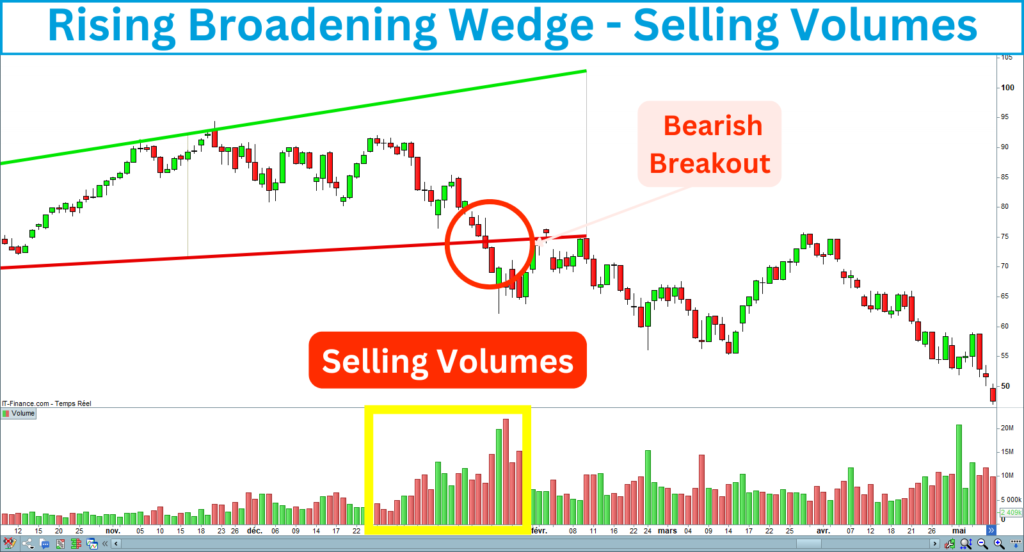
Volume is probably the best indicator for confirming a breakout because it reveals the strength of the signal. A breakdown preceded by and supported with significant volumes is more likely to result in a substantial price move. Conversely, a breakdown with low volume could indicate a bear trap. That is why you should always verify that seller volumes corroborate your short-sell signal.
The following chart shows a breakdown of the rising broadening wedge bottom line with selling volumes:
5. Search for a bearish divergence
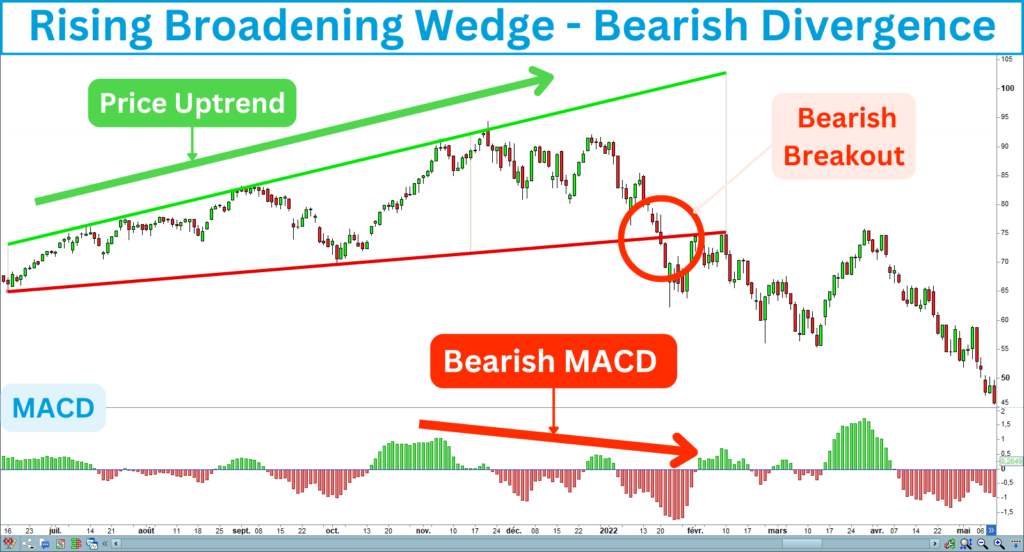
Remember, the rising broadening wedge breakdown is a reversal signal. That means you will sell the market when it has a long-term uptrend. That is why ensuring a bearish divergence before shorting the market is crucial.
A bearish divergence happens when a strength indicator turns bearish while the trend is still bullish. That indicates a weakness in the bull trend. You can use different indicators to measure the market strength: RSI, MACD, or Stochastic. You should ensure that at least one of these indicators shows a weakness sign before entering a trade.
The following chart shows a bearish divergence, confirming the breakdown of the rising broadening wedge:
6. Open a short-sell entry
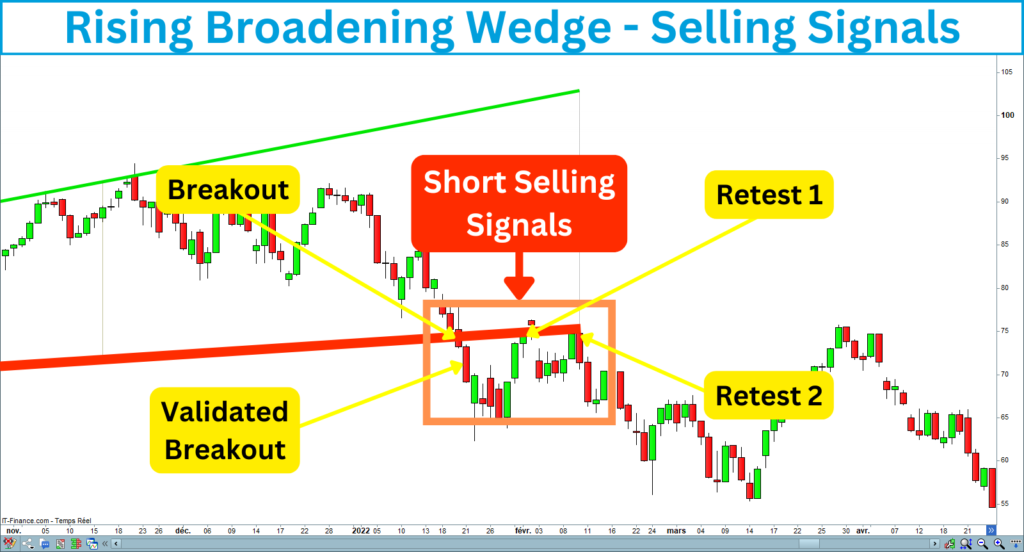
Once the breakdown is validated, supported by seller volumes and a bearish divergence, you can open a short-sell position. Keep in mind that the falling broadening wedge is a descending figure. While its bearish bias is less than the falling wedge, it’s important to remain cautious and attentive to market conditions.
The following chart shows when you can open a short-sell position after a rising broadening wedge breakout:
7. Set a Stop-Loss
Even if you ensure the breakout validation and its confirmation by volumes and market strength, you can never be sure your trade will go well. Managing the risk is crucial if you want to survive in trading. That is why you must always place a stop-loss order. If the price reverses and goes above this level, your trade will automatically close, limiting your potential losses.
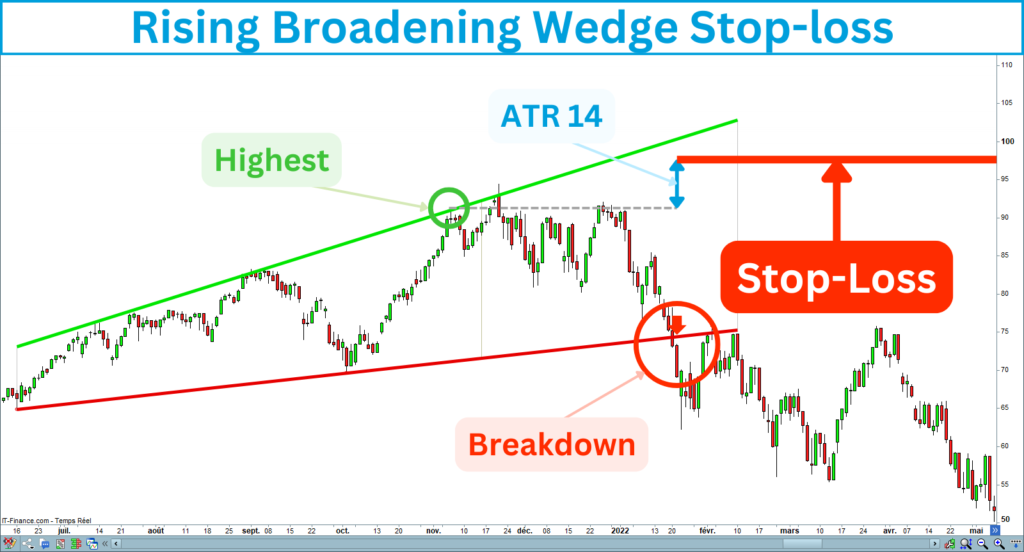
Habitually, I place a stop-loss above the last construction point of the wedge topline. To be more precise, I add the value of an ATR 14 above this point.
The following chart shows you where to place the stop-loss after the breakdown of a rising broadening wedge:
8. Set the Profit Target
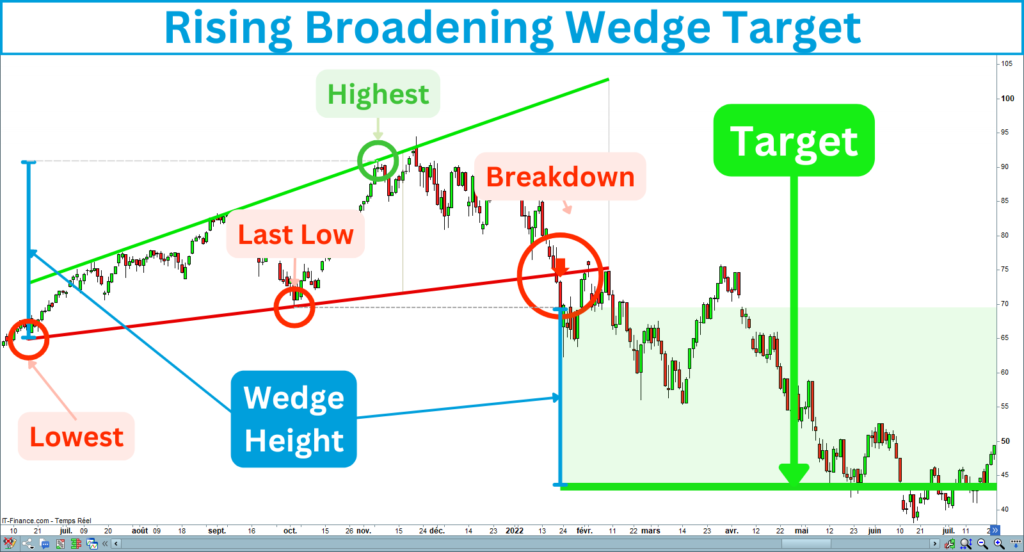
Correctly defining the target position is as important as the stop-loss. I usually measure the height of the pattern to determine the profit target. That corresponds to the distance between the highest high and the lowest low within the wedge.
I report this distance from the last low construction point of the rising broadening wedge. This gives me a clear exit strategy based on the pattern’s size and market conditions.
The following chart shows the target corresponding to the rising broadening wedge height:
Key Points to Remember
Here are the key points you should keep in mind when you trade the rising broadening wedges breakdown efficiently:
Rising Broadening Wedge Summary
The Rising Broadening Breakdown Strategy is a fantastic tool for spotting potential market reversals and profiting from sharp downward moves.
It is a challenging pattern, so you must confirm the selling signal with strength indicators and associate it with bad news.
The increase in volatility, corroborated by broadening and bear markets, implies the need for a perfect stop-loss and target positioning.
The expected gain of short-selling strategies will always be lower than long ones, so you should monitor and secure your latent profits using a trading stop.
If you are interested in the rising broadening breakout strategy, I created an indicator that recognizes this pattern. It draws the figure on the chart, detects the breakouts, and displays the target and stoploss.
The indicator is available on the Prorealcode’s marketplace:
https://market.prorealcode.com/product/ultimate-breaker
I wish you good trades 😊
Vivien


