In a world increasingly driven by data and connectivity, NVE Corporation is revolutionizing the semiconductor landscape with its cutting-edge spintronic technology. By harnessing the unique properties of electron spin, NVE designs innovative devices that enhance data acquisition and transmission, solidifying its position as a market leader. With a reputation for quality and forward-thinking solutions, the company significantly influences industries ranging from factory automation to medical devices. As we delve into NVE’s fundamentals, we must consider whether its growth potential and market valuation remain justified in this dynamic environment.
Table of contents
Company Description
NVE Corporation (NASDAQ: NVEC), founded in 1989 and headquartered in Eden Prairie, Minnesota, specializes in the development and sale of spintronic devices that leverage nanotechnology for data acquisition, storage, and transmission. Operating primarily in the semiconductor industry, NVE manufactures products such as sensors and couplers tailored for factory automation and medical applications, alongside research and development contracts in spintronic technologies. With a market capitalization of approximately $291M, NVE stands as a niche player in its field, focusing on innovative solutions for the industrial Internet of Things and medical device sectors. Through its cutting-edge technologies, NVE Corporation is shaping the future of electronics and contributing to the advancement of smart manufacturing and healthcare solutions.
Fundamental Analysis
In this section, I will analyze NVE Corporation’s income statement, financial ratios, and dividend payout policy to assess its investment potential.
Income Statement
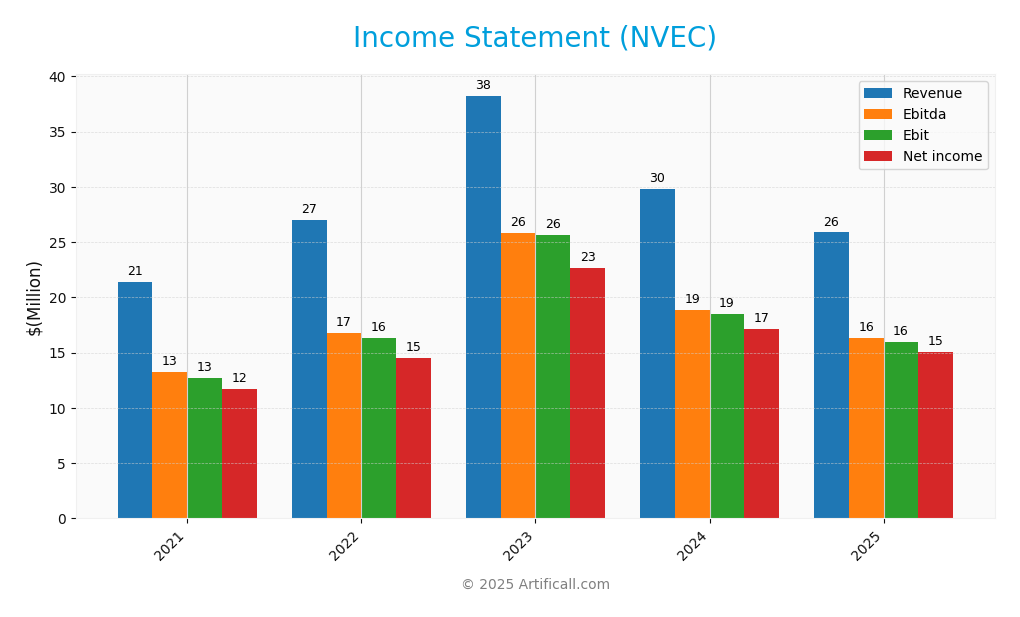
The Income Statement below provides a comprehensive view of NVE Corporation’s financial performance over the past five fiscal years, focusing on key income and expense metrics.
| Income Metrics | 2021 | 2022 | 2023 | 2024 | 2025 |
|---|---|---|---|---|---|
| Revenue | 21.37M | 26.99M | 38.25M | 29.80M | 25.87M |
| Cost of Revenue | 4.12M | 6.26M | 8.06M | 6.77M | 4.24M |
| Operating Expenses | 4.50M | 4.40M | 4.55M | 4.51M | 5.64M |
| Gross Profit | 17.24M | 20.72M | 30.19M | 23.03M | 21.64M |
| EBITDA | 13.29M | 16.75M | 25.84M | 18.83M | 16.32M |
| EBIT | 12.74M | 16.33M | 25.64M | 18.52M | 15.99M |
| Interest Expense | 0 | 0 | 0 | 0 | 0 |
| Net Income | 11.69M | 14.51M | 22.69M | 17.12M | 15.06M |
| EPS | 2.42 | 3.00 | 4.70 | 3.54 | 3.12 |
| Filing Date | 2021-05-05 | 2022-05-04 | 2023-05-03 | 2024-05-01 | 2025-05-07 |
Interpretation of Income Statement
Over the analyzed period, NVE Corporation’s revenue showed volatility, peaking in 2023 at 38.25M, before declining significantly in 2024 and 2025. Notably, net income followed a similar trend, reflecting a drop in profitability in recent years. While gross profit margins remained relatively stable, the increase in operating expenses in 2025 suggests a need for careful cost management. In 2025, despite lower revenue, the company maintained a net income of 15.06M, indicating resilience amidst challenges, though EPS decreased to 3.12, underscoring potential investor caution moving forward.
Financial Ratios
Below is a table summarizing the financial ratios for NVE Corporation (NVEC) over the available fiscal years.
| Ratio | 2021 | 2022 | 2023 | 2024 | 2025 |
|---|---|---|---|---|---|
| Net Margin | 54.73% | 53.76% | 59.33% | 57.46% | 58.22% |
| ROE | 16.50% | 22.47% | 33.83% | 26.12% | 24.19% |
| ROIC | 17.83% | 20.72% | 31.70% | 23.44% | 21.14% |
| P/E | 28.98 | 18.15 | 17.67 | 25.11 | 20.46 |
| P/B | 4.78 | 4.08 | 5.98 | 6.56 | 4.95 |
| Current Ratio | 23.71 | 16.90 | 16.80 | 32.05 | 28.40 |
| Quick Ratio | 19.92 | 14.82 | 13.30 | 25.14 | 22.03 |
| D/E | 0.0103 | 0.0093 | 0.0077 | 0.0054 | 0.0148 |
| Debt-to-Assets | 1.01% | 0.89% | 0.75% | 0.53% | 1.43% |
| Interest Coverage | – | – | – | – | – |
| Asset Turnover | 0.29 | 0.40 | 0.55 | 0.45 | 0.40 |
| Fixed Asset Turnover | 20.83 | 23.13 | 21.60 | 22.18 | 8.91 |
| Dividend Yield | 5.71% | 7.34% | 4.82% | 4.50% | 6.28% |
Interpretation of Financial Ratios
NVE Corporation (NVEC) exhibits strong liquidity, with a current ratio of 28.4 and a quick ratio of 22.0, indicating robust short-term financial health. Solvency is also solid, evidenced by a solvency ratio of 7.7, suggesting low financial risk. Profitability ratios are impressive, with a net profit margin of 58.2% and an operating profit margin of 61.8%, reflecting efficient cost management. However, the inventory turnover ratio at 0.57 raises concerns about inventory management. The price-to-earnings (P/E) ratio of 20.5 indicates moderate valuation, but the price-to-book ratio of 4.9 suggests potential overvaluation compared to book value. Overall, while most ratios are strong, the inventory turnover could be a point of concern.
Evolution of Financial Ratios
Over the past five years, NVEC’s financial ratios show a positive trend in profitability and liquidity, with significant improvements in margins and solvency. However, the inventory turnover has decreased, indicating potential inefficiencies in inventory management that need addressing.
Distribution Policy
NVE Corporation (NVEC) currently pays dividends, with a recent annual dividend of $4.00 per share. The dividend payout ratio stands at 1.28, indicating that distributions exceed net income, which poses some risk to sustainability. However, the company is also executing share buyback programs, which can enhance shareholder value. Given these factors, I assess that while the dividend strategy offers immediate returns, it may not be fully sustainable without adjustments in profitability, impacting long-term value creation.
Sector Analysis
NVE Corporation operates in the semiconductors industry, specializing in spintronic devices that enhance data acquisition, storage, and transmission, competing with established tech firms.
Strategic Positioning
NVE Corporation (NVEC) operates in the semiconductor industry, specializing in spintronic technology. Currently, the company holds a market cap of approximately $291M, with a share price around $60.11. Its competitive edge lies in its innovative spintronic products, which are essential for factory automation and medical devices. However, the competitive pressure is significant, as larger players in the semiconductor sector continuously innovate and expand their product lines. Moreover, the rapid pace of technological disruption necessitates that NVE remain agile in its R&D efforts to maintain its market position and capitalize on emerging opportunities in the industrial IoT market.
Revenue by Segment
The pie chart below illustrates NVE Corporation’s revenue segmentation for the fiscal year 2022, highlighting the contributions from the Contract Research and Development and Product segments.
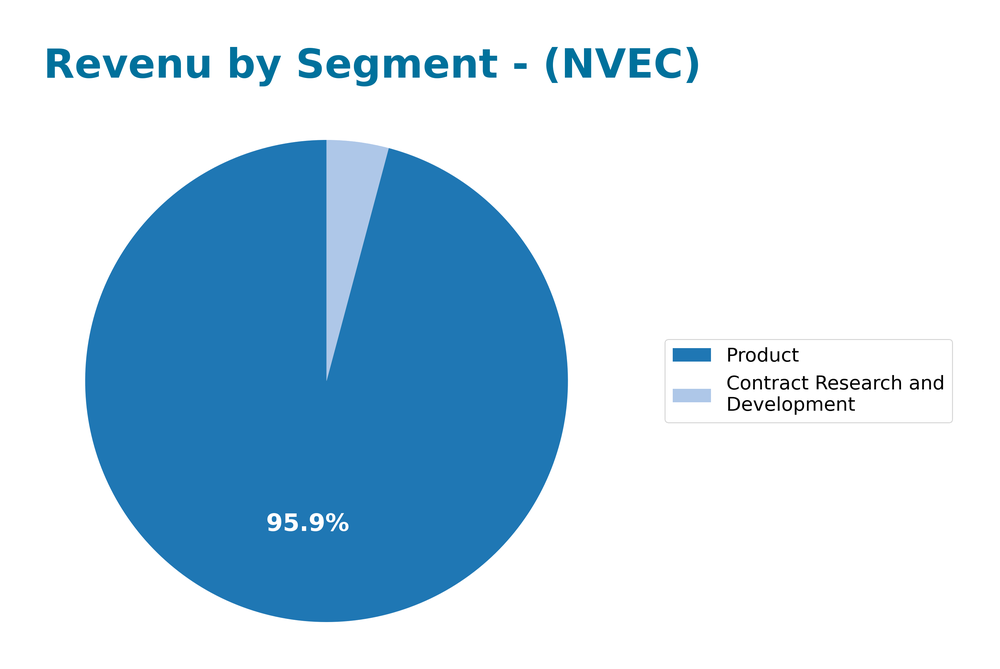
In FY 2022, NVE Corporation reported revenues of 1.12M from Contract Research and Development and 25.87M from Product sales. Over recent years, the Product segment has consistently driven the majority of revenue, showing growth from 20.54M in FY 2021 to 25.87M in FY 2022. However, the Contract Research and Development segment has shown fluctuations, peaking at 2.54M in FY 2018 before declining to 1.12M in 2022. This trend highlights potential concentration risks, as reliance on Product sales increases, and the revenue growth appears to have slowed down, indicating a possible need for diversification.
Key Products
NVE Corporation specializes in developing and selling innovative products that leverage spintronics technology. Below is a table highlighting some of their key products:
| Product | Description |
|---|---|
| Spintronic Sensors | Devices that detect the presence of magnetic or metallic materials to determine position or speed, primarily used in factory automation. |
| Medical Sensors | Custom sensors designed for medical devices that replace traditional electromechanical magnetic switches, enhancing reliability and performance. |
| Spintronic Couplers | Products designed for the industrial Internet of Things (IoT) market, facilitating data transmission and communication between devices. |
| Magnetoresistive RAM (MRAM) | Advanced memory technology that utilizes spintronics for faster and more efficient data storage and retrieval, ideal for a variety of applications. |
These products exemplify NVE Corporation’s commitment to innovation and excellence in the semiconductor industry.
Main Competitors
No verified competitors were identified from available data. NVE Corporation, operating in the semiconductor industry, has an estimated market share reflective of its niche in spintronics technology. The company focuses on developing innovative products for factory automation and the industrial Internet of Things, positioning itself as a specialized player within a competitive landscape.
Competitive Advantages
NVE Corporation has established a strong foothold in the semiconductor industry through its innovative use of spintronics technology, which allows for efficient data acquisition, storage, and transmission. This unique approach gives NVE a competitive edge, especially in niche markets like factory automation and medical devices. Looking ahead, the company is poised to capitalize on emerging opportunities in the industrial Internet of Things (IoT) sector, as demand for advanced and reliable sensors continues to grow. Additionally, NVE’s commitment to research and development positions it well for future product expansions and market penetration.
SWOT Analysis
This SWOT analysis for NVE Corporation (NVEC) aims to provide insights into its strategic position and potential future direction.
Strengths
- Innovative spintronic technology
- Strong market position in sensors
- Consistent dividend payments
Weaknesses
- Limited product range
- Small employee base (41)
- Dependence on specific markets
Opportunities
- Growth in IoT market
- Expansion of medical sensor applications
- Increasing demand for automation
Threats
- Intense competition in semiconductors
- Economic fluctuations
- Rapid technological changes
The overall SWOT assessment indicates that NVE Corporation possesses strong technological advantages and market opportunities but must address its weaknesses and external threats. A strategic focus on diversifying its product offerings and enhancing market presence could mitigate risks and capitalize on growth trends.
Stock Analysis
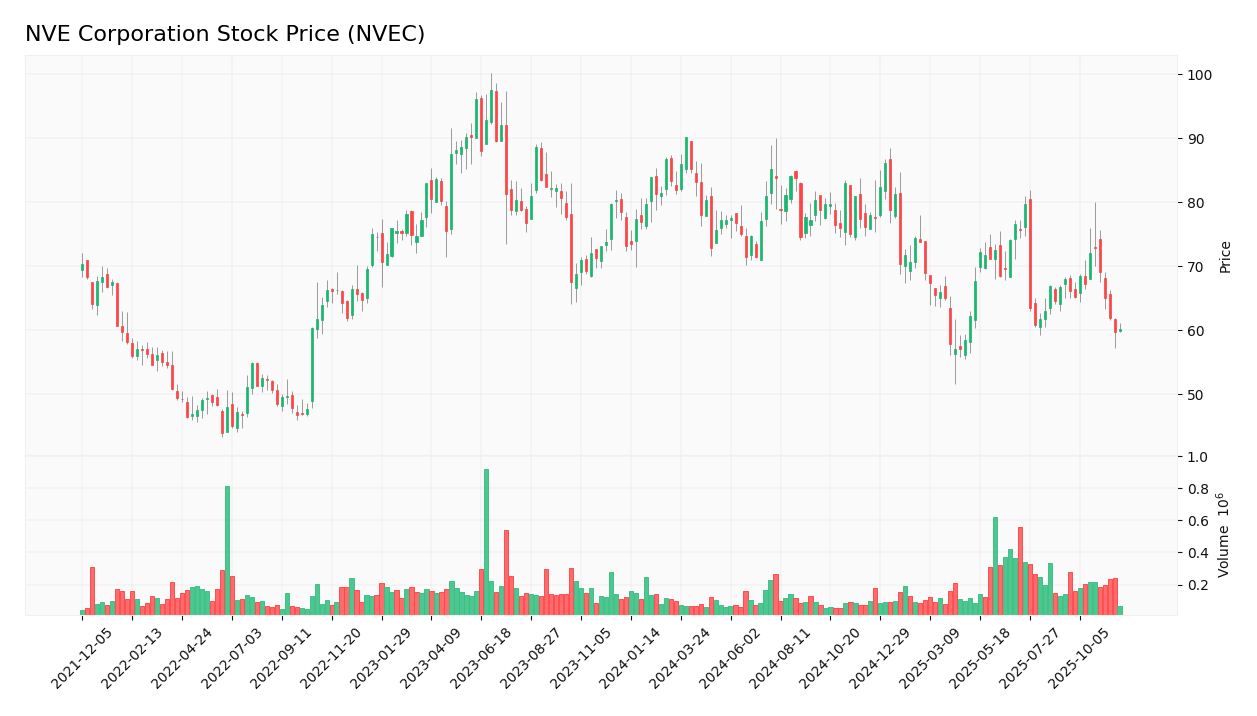
Over the past year, NVE Corporation (NVEC) has experienced significant price movements and trading dynamics, culminating in a substantial decline in its stock value.
Trend Analysis
Analyzing the stock’s performance over the past year, I find that NVEC has experienced a price change of -17.73%. This negative variation confirms a bearish trend in the stock’s trajectory. Additionally, the trend shows signs of deceleration, with notable highs at $90.18 and lows at $56.99. The standard deviation of 7.63 indicates some volatility within the price movements during this period.
Volume Analysis
In examining the trading volumes over the last three months, total volume reached approximately 18.5M shares. The volume trend appears to be increasing, with buyer volume at 9.39M and seller volume at 8.97M, resulting in a buyer dominance of 50.73%. However, recent activity has shifted towards seller dominance, with buyer volume at 817K and seller volume at 1.49M, indicating a seller-driven market sentiment. This suggests that investor participation may be cautious as the stock continues to face downward pressure.
Analyst Opinions
Recent analyst recommendations for NVE Corporation (NVEC) indicate a consensus to hold, with a B+ rating. Analysts highlight strong performance in return on assets (score 5) and return on equity (score 4) as positive indicators. However, concerns regarding the price-to-earnings (score 2) and price-to-book ratios (score 2) suggest caution. While the overall score stands at 3, reflecting stable performance, the mixed signals from analysts recommend a careful approach for investors considering NVEC in their portfolios.
Stock Grades
No verified stock grades were available from recognized analysts for NVE Corporation (NVEC). As a result, I cannot provide a reliable assessment of the stock’s current rating. It’s important to stay informed through credible sources to understand market sentiment and trends surrounding NVEC.
Target Prices
No verified target price data is available from recognized analysts for NVE Corporation (NVEC). The current market sentiment appears uncertain, reflecting a lack of consensus among investors.
Consumer Opinions
Consumer sentiment towards NVE Corporation (NVEC) is a mix of enthusiasm and caution, reflecting both strong product performance and areas for improvement.
| Positive Reviews | Negative Reviews |
|---|---|
| “Exceptional quality in their products!” | “Customer service could be improved.” |
| “Innovative technology that sets them apart.” | “Pricing is higher than competitors.” |
| “Fast delivery and reliable performance.” | “Occasional delays in product availability.” |
Overall, consumer feedback highlights NVE Corporation’s innovative technology and product quality as key strengths, while customer service and pricing remain common concerns among users.
Risk Analysis
Understanding the risks associated with investing in NVE Corporation (NVEC) is crucial for making informed decisions. Below is a summary of potential risks:
| Category | Description | Probability | Impact |
|---|---|---|---|
| Market Risk | Fluctuations in the stock market affecting NVEC’s valuation. | High | High |
| Regulatory Risk | Changes in regulations impacting operations and profitability. | Medium | High |
| Technology Risk | Rapid technological advancements could render NVEC’s products obsolete. | Medium | Medium |
| Supply Chain Risk | Disruptions in supply chains affecting production. | High | Medium |
| Competition Risk | Increased competition from emerging players in the market. | High | Medium |
The most notable risks for NVEC involve market fluctuations and regulatory changes, both of which can significantly alter the company’s financial standing and growth trajectory.
Should You Buy NVE Corporation?
NVE Corporation has demonstrated a positive net margin of 58.22%, indicating strong profitability. The company maintains a low total debt of 921K, reflecting a solid financial position. Over recent years, NVE’s fundamentals show a decline in revenue, down 13.18% in the latest fiscal year, but with a favorable rating of B+ suggesting generally positive market perception.
Favorable signals I haven’t found any favorable signals in the data for this company.
Unfavorable signals The company has a declining revenue trend, as reflected by the 13.18% decrease in revenue this year. The recent seller volume exceeds the buyer volume, indicating a seller-dominant market environment. Additionally, the stock trend is bearish with a price change of -17.73% over the overall period and -11.49% recently, suggesting a negative market sentiment.
Conclusion Given the unfavorable signals, it might be more prudent to wait for a potential turnaround before considering an investment in NVE Corporation.
Disclaimer: This article is not financial advice. Each investor is responsible for their own investment decisions.
Additional Resources
- NVE Corp (NVEC) Q2 2026 Earnings Call Highlights: Navigating Revenue Challenges with Strategic … – Yahoo Finance (Nov 04, 2025)
- NVE Corporation: Promising Applications With Spintronics Miniaturization (NASDAQ:NVEC) – Seeking Alpha (Oct 16, 2025)
- Earnings call transcript: NVE Corp Q2 2025 sees revenue dip, innovation focus – Investing.com (Jul 23, 2025)
- NVE Corporation Reports Second Quarter Results and Announces Quarterly Dividend – Business Wire (Oct 22, 2025)
- NVE (NVEC) Q1 2026 Earnings Call Transcript – The Motley Fool (Jul 23, 2025)
For more information about NVE Corporation, please visit the official website: nve.com